. 2023 Mar;10(9):e2207170.
doi: 10.1002/advs.202207170. Epub 2023 Jan 25.

Nicotinamide Mononucleotide Ameliorates Sleep Deprivation-Induced Gut Microbiota Dysbiosis and Restores Colonization Resistance against Intestinal Infections

Affiliations

Nicotinamide Mononucleotide Ameliorates Sleep Deprivation-Induced Gut Microbiota Dysbiosis and Restores Colonization Resistance against Intestinal Infections

Dan Fang et al. Adv Sci (Weinh). 2023 Mar.

Abstract

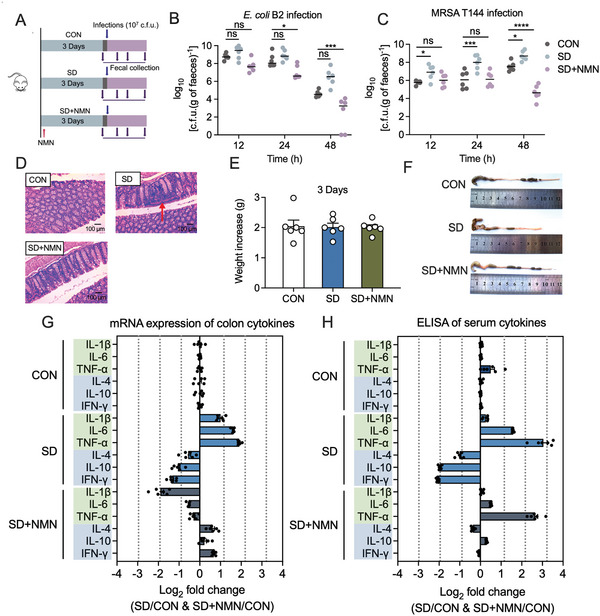
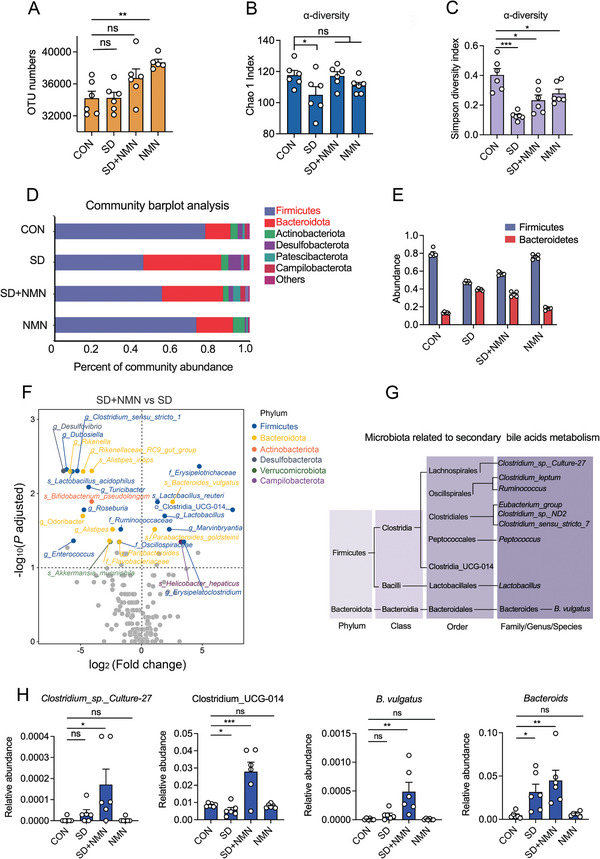
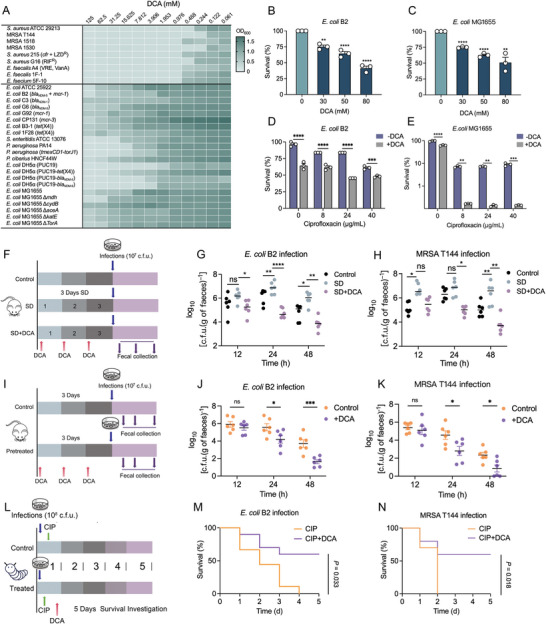
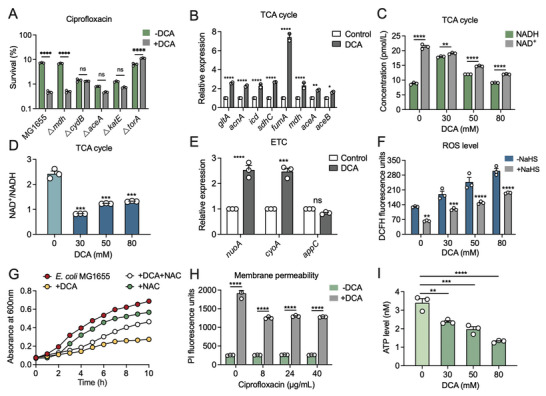
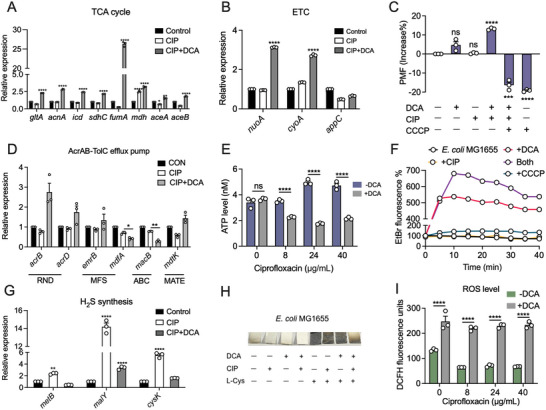
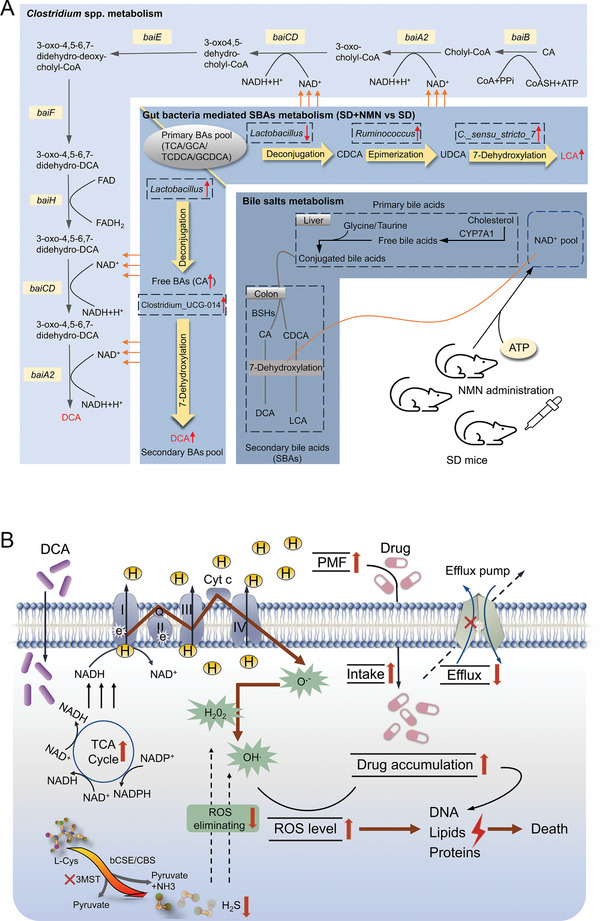
Gut microbiota-mediated colonization resistance (CR) is crucial in protecting the host from intestinal infections. Sleep deprivation (SD) is an important contributor in the disturbances of intestinal homeostasis. However, whether and how SD affects host CR remains largely unknown. Here, it is shown that SD impairs intestinal CR in mice, whereas nicotinamide mononucleotide (NMN) supplementation restores it. Microbial diversity and metabolomic analyses suggest that gut microbiota and metabolite profiles in SD-treated mice are highly shaped, whereas NMN reprograms these differences. Specifically, the altered gut microbiota in SD mice further incurs the disorder of secondary bile acids pool accompanied by a decrease in deoxycholic acid (DCA). Conversely, NMN supplementation retakes the potential benefits of DCA, which is associated with specific gut microbiota involved in primary bile acids metabolic flux. In animal models of infection, DCA is effective in preventing and treating bacterial infections when used alone or in combination with antibiotics. Mechanistically, DCA alone disrupts membrane permeability and aggravates oxidative damage, thereby reducing intestinal pathogen burden. Meanwhile, exogenous DCA promotes antibiotic accumulation and destroys oxidant-antioxidant system, thus potentiating antibiotic efficacy. Overall, this work highlights the important roles of gut microbiota and bile acid metabolism in the maintenance of intestinal CR.

Keywords: colonization resistance; gut microbiota; intestinal infections; metabolites; sleep deprivation.


Conflict of interest statement

The authors declare no conflict of interest.

Figures

Figure 1
Figure 1
NMN supplementation rescues SD‐elicited depletion of intestinal CR in mice. A) Experimental protocols of SD‐induced intestinal infection model. The mice were randomly divided into three groups (n = 6 independent animals per group), including CON, SD, and SD + NMN groups. CON, healthy unperturbed group; SD, sleep‐deprived group; SD + NMN, sleep‐deprived and NMN‐supplied group (NMN: 100 mg kg−1 per day). B,C) Bacterial loads in mice feces at 12, 24, and 48 h post‐infection by B) E. coli B2 or C) MRSA T144. D) H&E staining of the colon tissues (original magnification: ×400). Inflammation aggravation of colon was observed in SD‐treated mice as indicated by the pathologic expansion of lymphocyte infiltration, marked by red arrows. Scar bar, 100 µm. E) Body weight changes of mice in CON, SD, and SD + NMN groups (n = 6 independent animals per group). F) Representative images of mice colon in three groups. Among them, colon atrophy and mucosal bleeding were observed in SD‐treated mice. G) RT‐qPCR analysis of inflammatory cytokines in colon samples of CON, SD, SD + NMN mice. H) ELISA analysis of inflammatory cytokines in serum samples of CON, SD, SD + NMN mice. In (G) and (H), fold changes between two groups were logarithmically compared. The CON group was used as a reference for normalization. Pro‐inflammatory cytokines (IL‐1β, IL‐6, TNF‐α) were marked with light green and anti‐inflammatory cytokines (IL‐4, IL‐10, INF‐γ) were marked with light blue. Statistical significance in (B) and (C) was assessed by two‐way ANOVA with Sidak's multiple comparison test. *p < 0.05, **p < 0.01, ***p < 0.001, ****p < 0.0001. ns, not significant. Statistical significance in (E) was determined by unpaired t‐test and denoted as follows: *p < 0.05, **p < 0.01, ***p < 0.001, ****p < 0.0001. ns, not significant.
Figure 2
Figure 2
Microbial diversity analysis of gut microbiota between four groups. A) The number of OTUs in four groups. B,C) Alpha diversity of gut microbiota responses to NMN treatment in SD mice, including B) Chao 1 richness and C) Simpson diversity. Decreased Chao 1 abundance and Simpson diversity index in SD‐treated mice indicated the perturbations in gut microbiota diversity at the OTU level. D) Microbial population distribution in fecal samples at the phylum level. The horizontal axis represents the relative abundance of microbial population and the vertical axis represents samples’ information. E) The abundance of Firmicutes and Bacteroidetes in four groups. It shows a markedly lower ratio of Firmicutes to Bacteroidetes in SD‐treated mice, for the relative abundance of the Firmicutes in SD‐treated mice was lower by 50%, whereas the Bacteroidetes were higher by a corresponding degree. F) Volcano plots of differential bacteria associated with SD + NMN group versus SD group. Significantly up‐ or down‐regulated microbiota flora were colored according to their taxonomy at the phylum level. G) Taxonomic list of gut microbiota in our study that involved in bile acids metabolism, including primary bile acids metabolism and secondary bile acids metabolism. H) The relative abundance of Clostridium_sp._Culture‐27, Clostridium_UCG‐014, Bacteroides vulgatus, and Bacteroids among four groups. Data were presented as mean ± SEM. Statistical significance was determined by unpaired t‐test and denoted as follows: *p < 0.05; **p < 0.01; ***p < 0.001; ns, not significant.
Figure 3
Figure 3
Alteration of mice fecal metabolite profiles among four groups. A) PCA analysis of identified metabolites in the feces from CON, SD, SD + NMN, NMN mice along with principal component (PC) 1 and 2, which explained 32.90%, 14.10% of the total variance, respectively. B) Venn diagrams showing the relationship of metabolites among four groups. C) Volcano map of differentially enriched metabolites in feces of SD + NMN mice compared with that in SD‐treated mice. Differentially enriched metabolites were identified by LC‐MS analysis with p values of ≤ 0.05 and FC values ≥ 2, and distinguished using one vertical and one horizontal dashed black line. Significantly up‐ and down‐regulated metabolites were shown in red and blue, respectively. Metabolites with no significant changes (nosing) in the gut were shown in gray. D) Heat‐map analyses of the top 50 metabolites in fecal samples from CON, SD, SD + NMN, NMN mice (n =  6 biologically independent animals per group). The color indicates the relative abundance of the metabolite in the group of samples, and the corresponding relationship between the color gradient and the values was shown in the gradient color block. DCA was labeled red. E) KEGG pathway enrichment analyses based on the significantly altered metabolites. The secondary classification category of KEGG compounds was shown on the left, and the number of metabolites annotated into this classification was shown on the right. The pathways for DCA involvement were marked in red. F) HMDB classifications of compounds with differential metabolites. Each color in the pie chart represented the different HMBD classifications, and its area represented the relative proportion of metabolites in the classification. The total numbers of significantly altered metabolites in this class were indicated and the corresponding proportions were shown in parentheses. G) The interconnection of the five main types of transformation of primary bile acids. H) Spearman correlation analyses between five bile acids metabolites and microbiota abundance that were related to bile acid metabolism. I,J) The relative abundance of I) conjugated bile acids (TCA and TCDCA) and J) free bile acids (CA) and secondary bile acids (DCA and LCA) in four groups. Fecal bile acids abundance was determined by gas chromatography. Data were presented as mean ± SEM. Statistical significance was assessed by unpaired t‐test and denoted as follows: *p < 0.05; **p < 0.01; ***p < 0.001; ns, not significant.
Figure 4
Figure 4
Antibacterial activity of DCA as well as its synergistic effect with existing antibiotics against bacterial infections. A) DCA sensitivity analysis in response to individual microbiota strains, including a panel of clinically drug‐resistant strains. Data represent the mean OD600 nm of three biological replicates. Dark green regions indicate higher cell density. B,C) Percent survival of B) E. coli B2 or C) E. coli MG1655 after exposure to increasing concentrations of DCA ranged from 0 × 10−3 to 80 × 10−3 m. D,E) DCA supplementation remarkably potentiates the bactericidal activity of CIP against D) multidrug‐resistant E. coli B2 and E) drug‐sensitive E. coli MG1655. F) Experimental protocols of DCA‐supplied intestinal infection model. The mice were randomly divided into three groups (n = 6 independent animals per group), including CON, SD, and SD + DCA groups. DCA administration, 100 mg kg−1 per day (i.p.). G,H) Bacterial loads in the feces of mice at 12, 24, and 48 h post‐infection by G) E. coli B2 or H) MRSA T144. I) Protocols of DCA‐pretreated administration in mice (n = 6 biologically independent animals per group). In the pretreated group, mice were supplied with a single intraperitoneal (i.p.) administration of DCA (100 mg kg−1) for 3 consecutive days. J,K) Fecal colonization of invading pathogens in DCA‐pretreated mice infected by J) E. coli B2 or K) MRSA T144 (107 CFUs per mouse, i.g.). L) Protocol of the therapeutic potential assessment of combined use of DCA and CIP in vivo (n = 20 biologically independent larvae per group). M,N) Survival rate of Galleria mellonella larvae after 5 days postinfection by E. coli B2 or MRSA T144 (108 CFUs per larvae) and treated by CIP (10 × 10−6 m kg−1) alone or in combination with DCA (20 × 10−6 m kg−1). Data in (B)–(N) were displayed as mean ± SEM, and statistical significance was determined by unpaired t‐test (*p < 0.05; **p < 0.01; ***p < 0.001; ns, not significant). Experiments were performed with three biological replicates. Statistical significance in (J) and (K) was assessed by two‐way ANOVA with Sidak's multiple comparison test.
Figure 5
Figure 5
Antibacterial mechanisms of DCA against E. coli. A) Percent survival of E. coli MG1655 and related knockout strains (△mdh, △cydB, △aceA, △katE, and △torA) after 4 h co‐treatment of DCA (50 × 10−3 m) and CIP (20‐fold MIC). B) Effect of DCA (50 × 10−3 m) on the mRNA expression of enzymes involved in TCA cycles. C,D) Intracellular C) NAD+ and NADH levels, and D) the ratio of NAD+/NADH in E. coli MG1655 in the absence or presence of DCA (50 × 10−3 m). E) The mRNA expression levels of electron transport chain (ETC)‐related genes in E. coli MG1655 after exposure to DCA (50 × 10−3 m). F) ROS levels of E. coli MG1655 in response to the increasing concentration of DCA, and NaHS (30 × 10−3 m) was served as the direct H2S donor, which functions as the defense gas protecting bacteria from oxidative damage. G) Growth curves of E. coli MG1655 within 10 h in the presence of DCA with or without NAC (10 × 10−3 m), a ROS scavenger. H) Membrane permeability of E. coli MG1655 under the stimulation of varying concentrations of DCA for 1 h, probed by propidium iodide (10 × 10−9 m). I) Intracellular ATP levels of E. coli MG1655 in response to the increasing concentration of DCA ranged from 0 × 10−3 to 80 × 10−3 m. Data were displayed as mean ± SEM, and statistical significance was determined by unpaired t‐test (*p < 0.05; **p < 0.01; ***p < 0.001; ns, not significant). Experiments were performed with three biological replicates.
Figure 6
Figure 6
Potentiation mechanisms of DCA to antibiotics against E. coli. A,B) The mRNA expression of A) TCA cycle‐related enzymes and B) ETC‐related enzymes in E. coli MG1655 under the treatment of CIP (8 µg mL−1) with or without DCA (50 × 10−3 m). C) PMF changes in E. coli MG1655 treated by DCA, CIP, CCCP or their combination, determined by DiOC2(3) dye (3 × 10−3 m). This dye penetrates and accumulates in the cytosol of bacterial cells when the membrane potential is high. D) Effect of CIP, DCA alone, or their combination on the mRNA expression of efflux pump‐related enzymes in E. coli MG1655. E) Intracellular ATP level in E. coli MG1655 in the presence of CIP (8 µg mL−1) with or without DCA (50 × 10−3 m). F) The function of efflux pumps in E. coli MG1655 after treatment with CIP (8 µg mL−1), DCA (50 × 10−3 m) alone, or their combination. CCCP was used as a positive control. G) Effect of CIP with or without DCA (50 × 10−3 m) on the mRNA expression of H2S synthesis‐related enzymes in E. coli MG1655. H) Semiquantitative analysis of H2S produced by E. coli MG1655 under different treatments after 15 h co‐culture. Representative Pb‐soaked paper strips reflect a brown stain of PbS as a result of the reaction between H2S released by bacterial cultures and Pb(Ac)2 in the paper strips. I) ROS levels of E. coli MG1655 in the presence of increasing concentrations of CIP with or without DCA (50 × 10−3 m). All data were determined by unpaired t‐test and expressed as mean ± SEM. *p < 0.05, **p < 0.01, ***p < 0.001, ****p < 0.0001. Experiments were performed with biological replicates.
Figure 7
Figure 7
Schematic illustration of the proposed mechanisms for enhanced CR after NMN supplementation in SD mice and the antibacterial actions of DCA. A) The roles of NMN supplementation, gut microbiota, and bile acids metabolism in the maintenance of intestinal CR. In SD mice, decreased Lactobacillus reduces deconjugation of primary bile acids, while increased Ruminococcus and C._sensu_stricto_7 accelerate the epimerization of CDCA and the 7‐dehydroxylation of UDCA, thereby promoting the accumulation of LCA (the top right part of the middle layer). In SD + NMN mice, increased Lactobacillus and Clostridium_UCG‐014 promote the transformation of primary bile acids to CA and CA to DCA by deconjugation and 7‐dehydroxylation stepwisely, resulting in the increased DCA level (the lower left part of the middle layer). In terms of 7‐dehydroxylation activity in Clostridium spp., NMN could positively activate this process by generating NAD+. B) Exogenous DCA firstly activates TCA flux and triggers the ETC activity in a NADH‐dependent way, yielding large amounts of superoxide O2 •− and increasing PMF build‐up by enhanced proton flux. Then, increased PMF promotes drug uptake and impaired efflux pump reduces drug outflow, which aggravates oxidant stress to bacteria cells, and thus inhibits DNA synthesis and replication. Meanwhile, a key enzyme of H2S production, 3MST, was inhibited by DCA and CIP, resulting in the compromised ROS elimination efficiency mediated by H2S. Overall, exogenous DCA promotes antibiotic accumulation and disrupts the balance between oxidative stress and antioxidant defense system, thereby potentiating antibiotic bactericidal efficacy and facilitating bacterial death. CA, cholic acid; DCA, deoxycholic acid; LCA, lithocholic acid; TCA, taurocholic acid; GCA, glycocholic acid; TCDCA, taurochenodeoxycholic acid; GCDCA, glycochenodeoxycholic acid; CDCA, chenodeoxycholic acid; UDCA, ursodeoxycholic acid; LCA, lithocholic acid; CYP7A1, cytochrome P450 family 7 subfamily A member 1; BSHs, bile acid hydrolases.

Similar articles

Cited by

References

    1. a) Rechtschaffen A., Gilliland M. A., Bergmann B. M., Winter J. B., Science 1983, 221, 182; - PubMed
    2. b) Bergmann B. M., Everson C. A., Kushida C. A., Fang V. S., Leitch C. A., Schoeller D. A., Refetoff S., Rechtschaffen A., Sleep 1989, 12, 31. - PubMed
    1. a) Sonnenberg A., Gut 1990, 31, 1037; - PMC - PubMed
    2. b) Necefli A., Tulumoğlu B., Giriş M., Barbaros U., Gündüz M., Olgaç V., Güloğlu R., Toker G., Dig. Dis. Sci. 2006, 51, 1538; - PubMed
    3. c) Ordás I., Eckmann L., Talamini M., Baumgart D. C., Sandborn W. J., Lancet 2012, 380, 1606. - PubMed
    1. Kaplan G. G., Nat. Rev. Gastroenterol. Hepatol. 2015, 12, 720. - PubMed
    1. a) Jia Y., Yang B., Shi J., Fang D., Wang Z., Liu Y., Pharmacol. Res. 2022, 175, 105978; - PubMed
    2. b) Löfmark S., Jernberg C., Jansson J. K., Edlund C., J. Antimicrob. Chemother. 2006, 58, 1160. - PubMed
    1. Smith D. L., Harris A. D., Johnson J. A., Silbergeld E. K., Morris J. G. Jr., Proc. Natl. Acad. Sci. USA 2002, 99, 6434. - PMC - PubMed

Publication types

MeSH terms

Substances

LinkOut - more resources