Assessment of distance to primary percutaneous coronary intervention centres in ST-segment elevation myocardial infarction: Overcoming inequalities with process mining tools
- PMID: 36698425
- PMCID: PMC9869225
- DOI: 10.1177/20552076221144210
Assessment of distance to primary percutaneous coronary intervention centres in ST-segment elevation myocardial infarction: Overcoming inequalities with process mining tools
Abstract
Objectives: In ST-segment elevation myocardial infarction (STEMI), time delay between symptom onset and treatment is critical to improve outcome. The expected transport delay between patient location and percutaneous coronary intervention (PCI) centre is paramount for choosing the adequate reperfusion therapy. The "Centro" region of Portugal has heterogeneity in PCI assess due to geographical reasons. We aimed to explore time delays between regions using process mining tools.
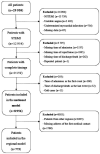
Methods: Retrospective observational analysis of patients with STEMI from the Portuguese Registry of Acute Coronary Syndromes. We collected information on geographical area of symptom onset, reperfusion option, and in-hospital mortality. We built a national and a regional patient's flow models by using a process mining methodology based on parallel activity-based log inference algorithm.
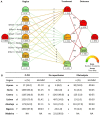
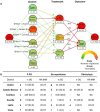
Results: Totally, 8956 patients (75% male, 48% from 51 to 70 years) were included in the national model. Most patients (73%) had primary PCI, with the median time between admission and treatment <120 minutes in every region; "Centro" had the longest delay. In the regional model corresponding to the "Centro" region of Portugal divided by districts, only 61% had primary PCI, with "Guarda" (05:04) and "Castelo Branco" (06:50) showing longer delays between diagnosis and reperfusion than "Coimbra" (01:19). For both models, in-hospital mortality was higher for those without reperfusion therapy compared to PCI and fibrinolysis.
Conclusion: Process mining tools help to understand referencing networks visually, easily highlighting its inefficiencies and potential needs for improvement. A new PCI centre in the "Centro" region is critical to offer timely first-line treatment to their population.
Keywords: Big data analytics; ST-segment elevation myocardial infarction; clinical pathways; percutaneous coronary intervention; process mining tools.
© The Author(s) 2023.
Conflict of interest statement
The authors declared no potential conflicts of interest with respect to the research, authorship, and/or publication of this article.
Figures


Similar articles
-
Efficacy and Safety of a Pharmaco-Invasive Strategy With Half-Dose Alteplase Versus Primary Angioplasty in ST-Segment-Elevation Myocardial Infarction: EARLY-MYO Trial (Early Routine Catheterization After Alteplase Fibrinolysis Versus Primary PCI in Acute ST-Segment-Elevation Myocardial Infarction).Circulation. 2017 Oct 17;136(16):1462-1473. doi: 10.1161/CIRCULATIONAHA.117.030582. Epub 2017 Aug 27. Circulation. 2017. PMID: 28844990 Clinical Trial.
-
Acute reperfusion for ST-elevation myocardial infarction in New Zealand (2015-2017): patient and system delay (ANZACS-QI 29).N Z Med J. 2019 Jul 12;132(1498):41-59. N Z Med J. 2019. PMID: 31295237
-
Nationwide Analysis of Patients With ST-Segment-Elevation Myocardial Infarction Transferred for Primary Percutaneous Intervention: Findings From the American Heart Association Mission: Lifeline Program.Circ Cardiovasc Interv. 2015 May;8(5):e002450. doi: 10.1161/CIRCINTERVENTIONS.114.002450. Circ Cardiovasc Interv. 2015. PMID: 25901044
-
Reperfusion Options for ST Elevation Myocardial Infarction Patients with Expected Delays to Percutaneous Coronary Intervention.Interv Cardiol Clin. 2016 Oct;5(4):439-450. doi: 10.1016/j.iccl.2016.06.004. Epub 2016 Sep 8. Interv Cardiol Clin. 2016. PMID: 28581994 Review.
-
Percutaneous coronary intervention-related time delay, patient's risk profile, and survival benefits of primary angioplasty vs lytic therapy in ST-segment elevation myocardial infarction.Am J Emerg Med. 2009 Jul;27(6):712-9. doi: 10.1016/j.ajem.2008.04.026. Am J Emerg Med. 2009. PMID: 19751630 Review.
References
-
- Townsend N, Wilson L, Bhatnagar Pet al. et al. Cardiovascular disease in Europe: epidemiological update 2016. Eur Heart J 2016; 37: 3232–3245. - PubMed
-
- Instituto Nacional de Estatística - Causas de Morte: 2017. Lisboa: INE. ISSN 2183-5489. ISBN 978-989-25-0481-0, https://www.ine.pt/xurl/pub/358633033 (2019).
-
- Every NR, Hochman J, Becker Ret al. et al. Critical pathways: a review. Committee on Acute Cardiac Care, Council on Clinical Cardiology, American Heart Association. Circulation 2000; 101: 461–465. - PubMed
-
- Fernandez-Llatas C, Valdivieso B, Traver Vet al. et al. Using process mining for automatic support of clinical pathways design. Methods Mol Biol 2015; 1246: 79–88. - PubMed
-
- Van der Aalst W. Process mining: data science in action. 2nd ed. New York: Springer Berlin Heidelberg, 2016.
LinkOut - more resources
Full Text Sources
Miscellaneous

