
Microbiological safety of aged meat

EFSA Panel on Biological Hazards (BIOHAZ) et al. EFSA J. .

Abstract

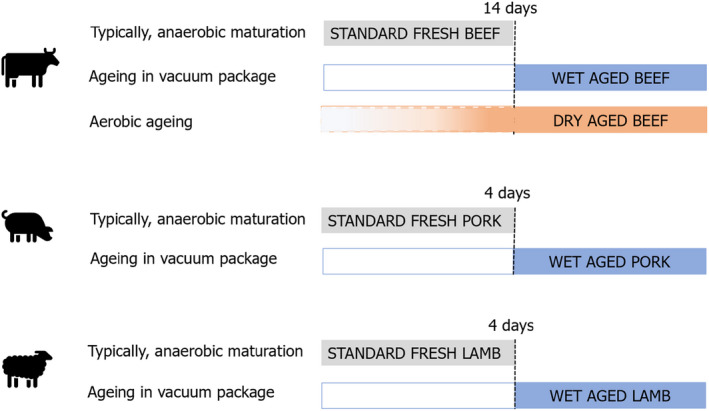
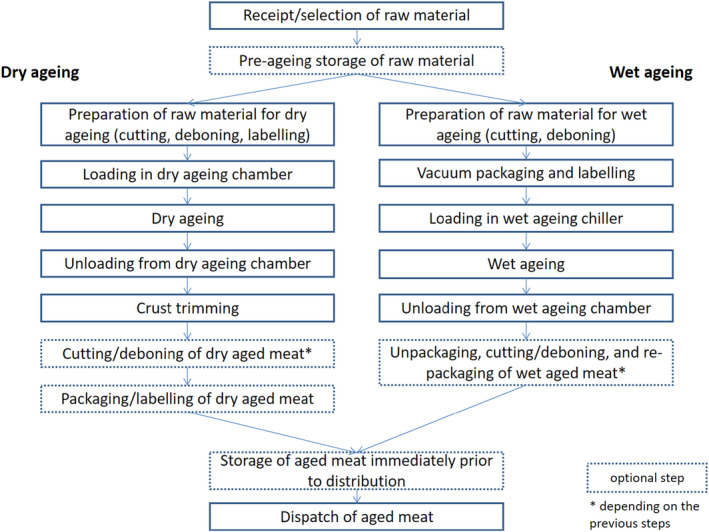
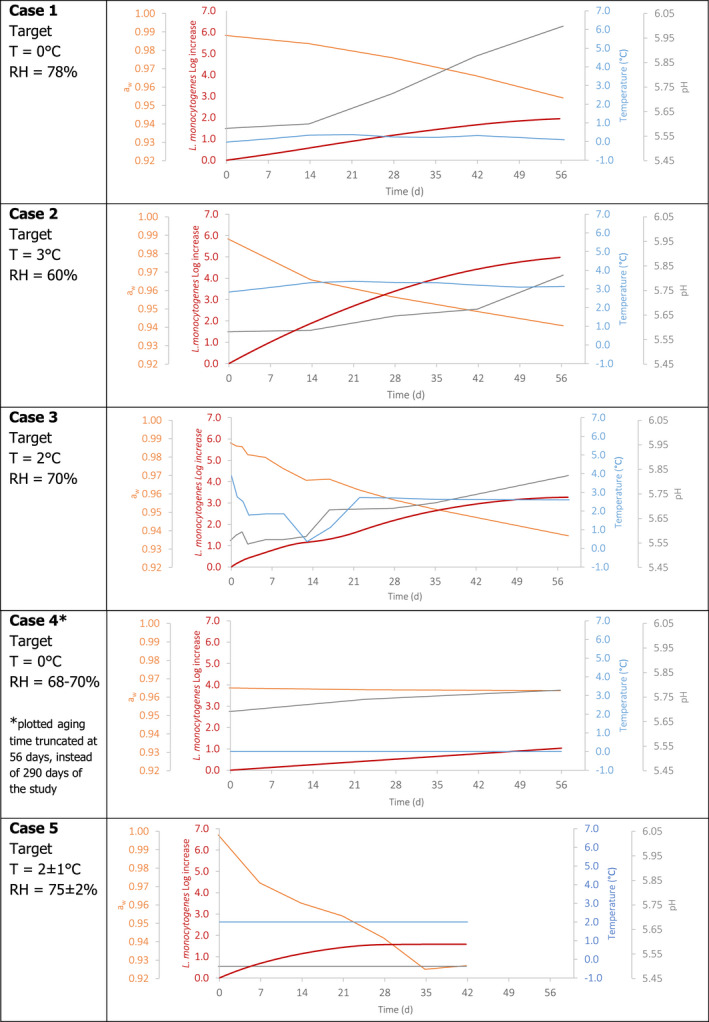
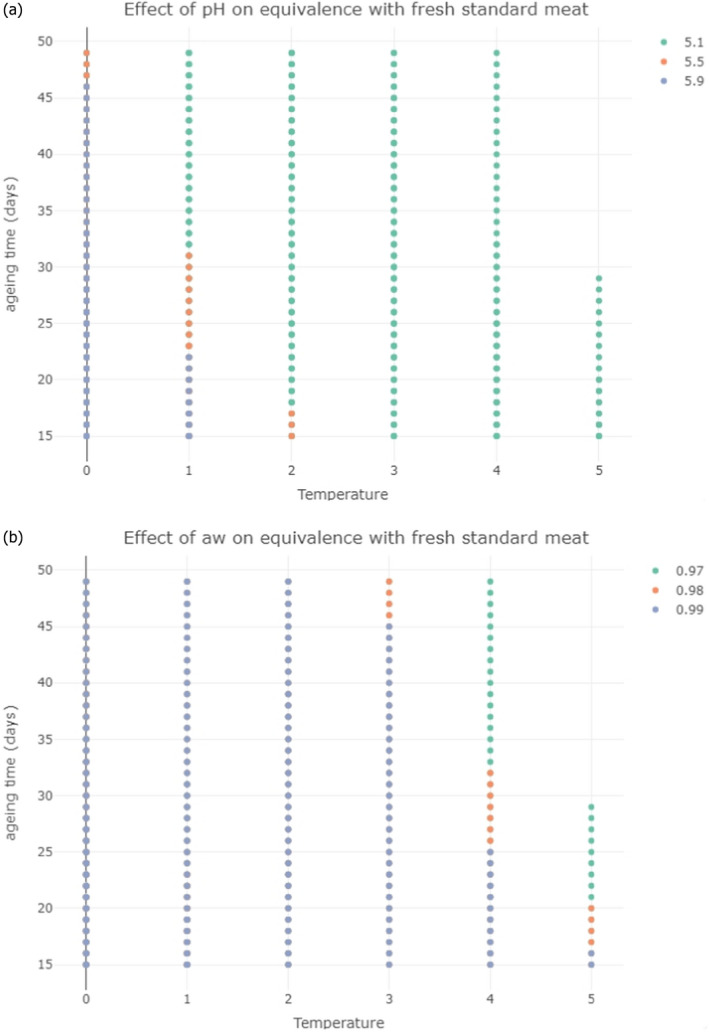
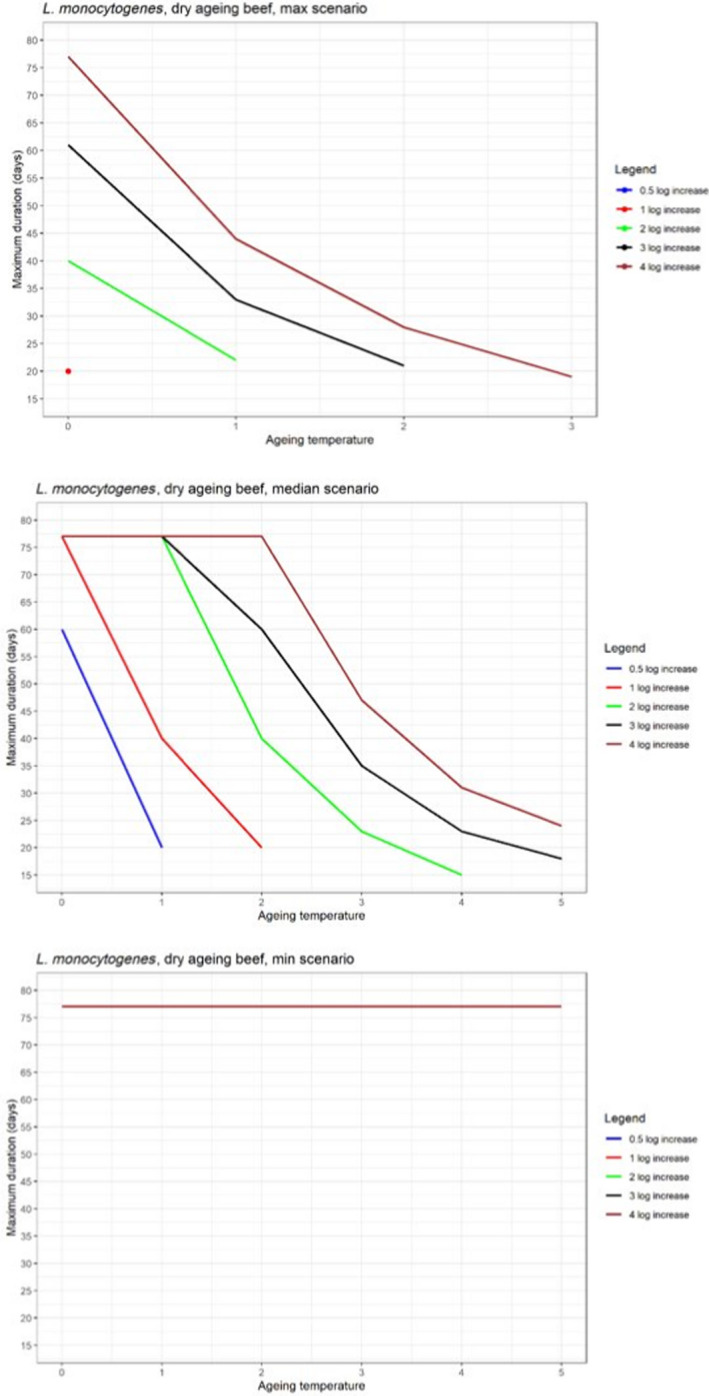
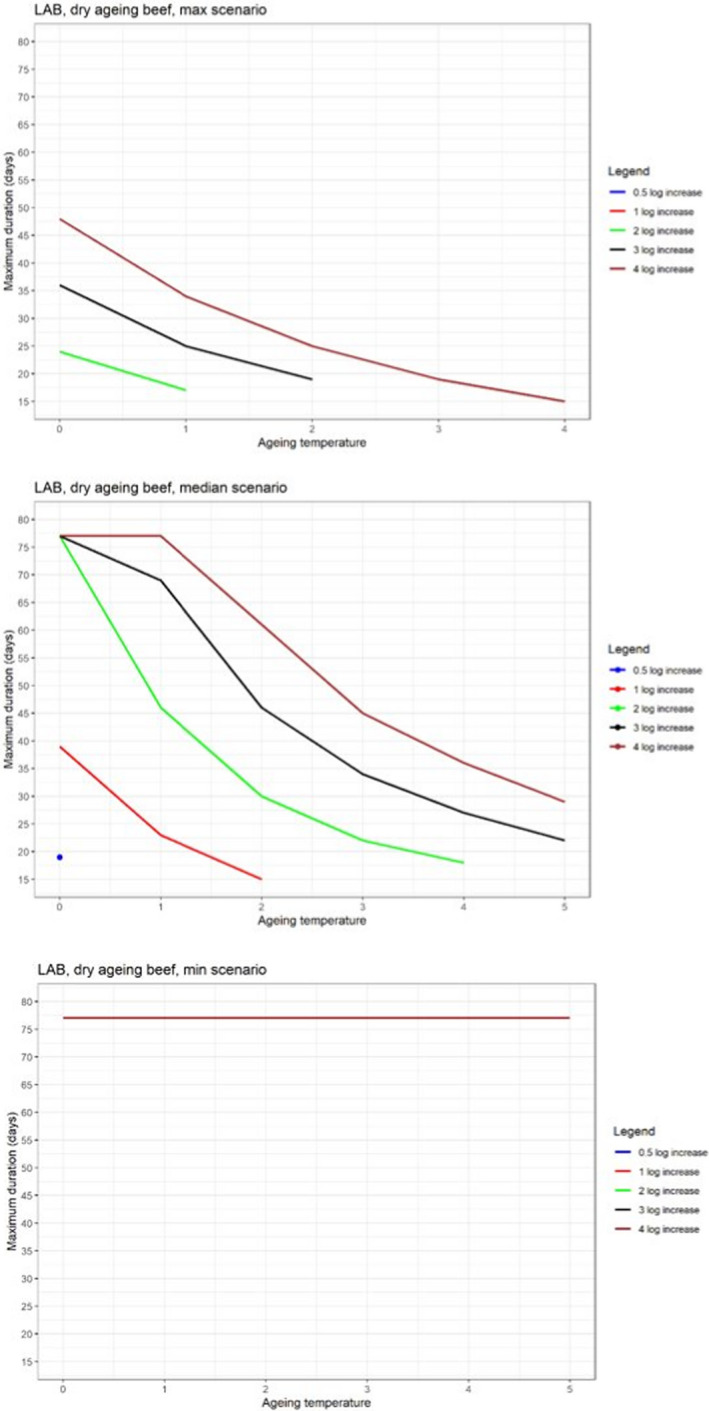
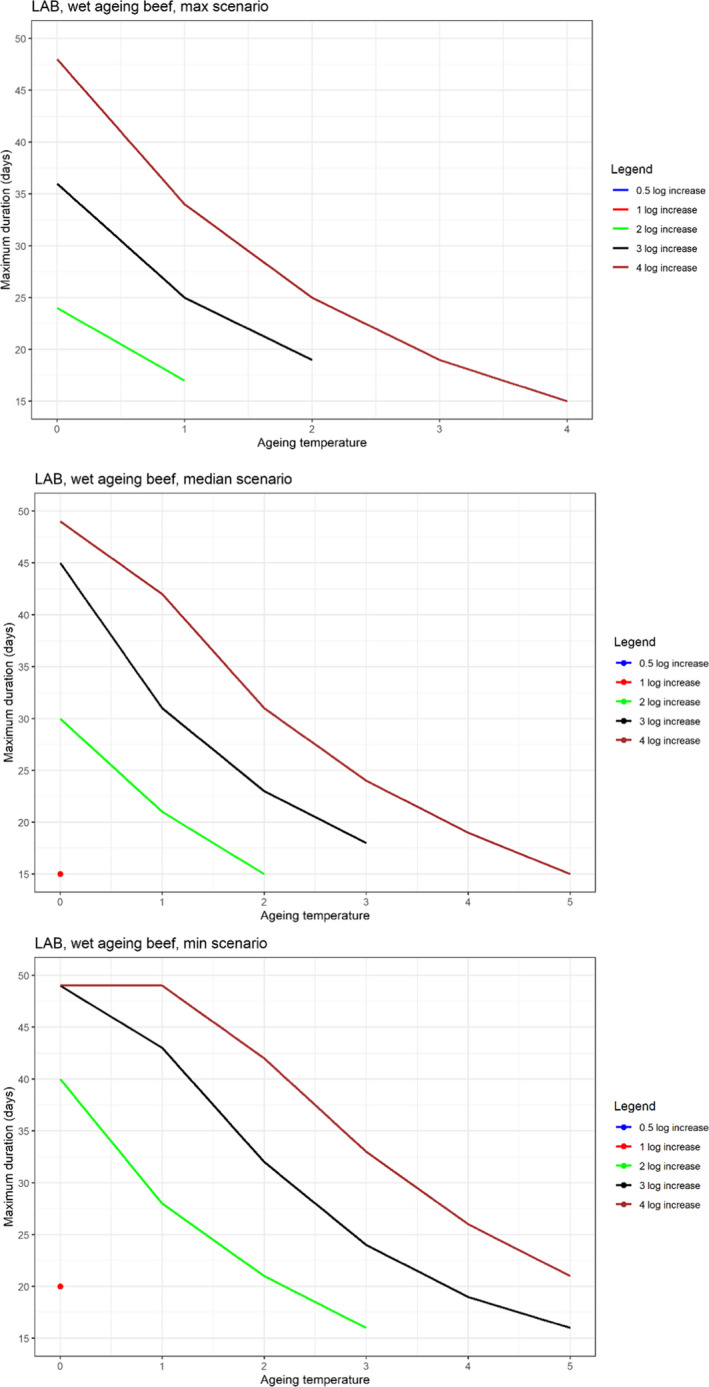
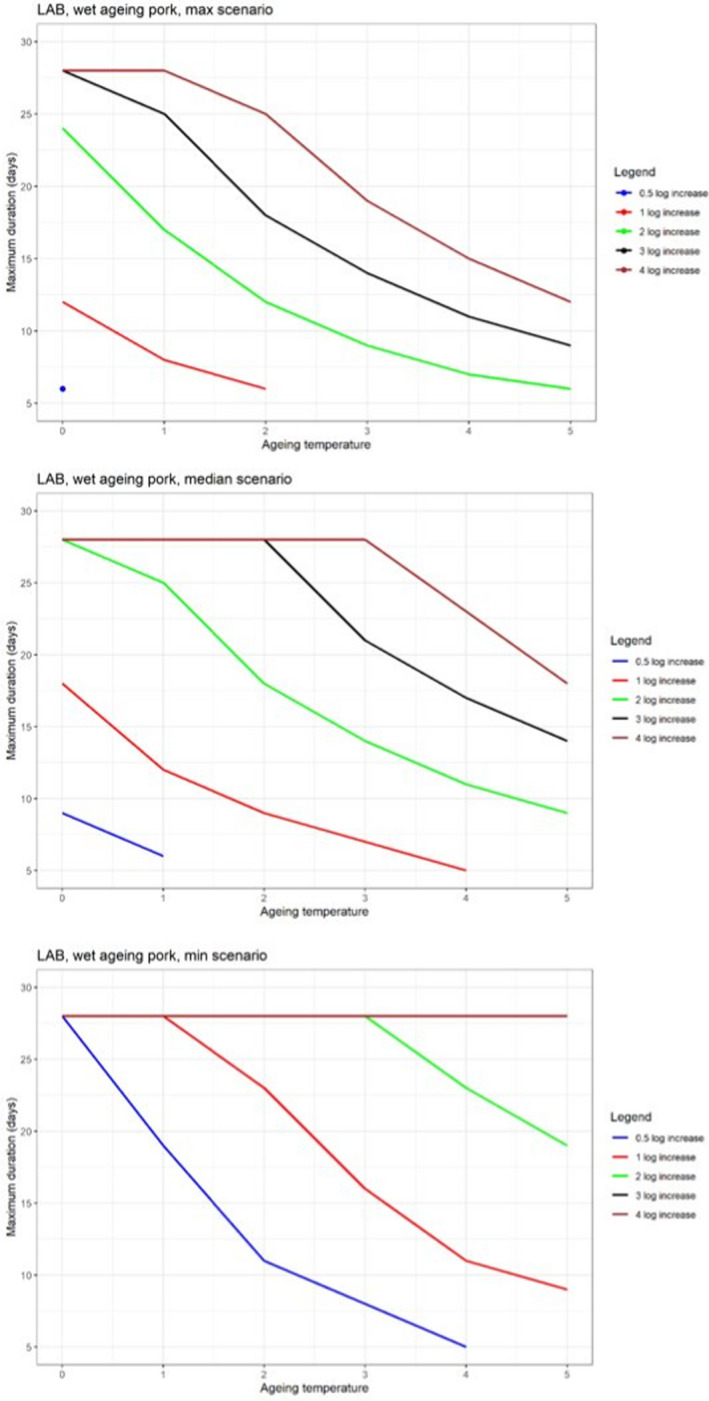
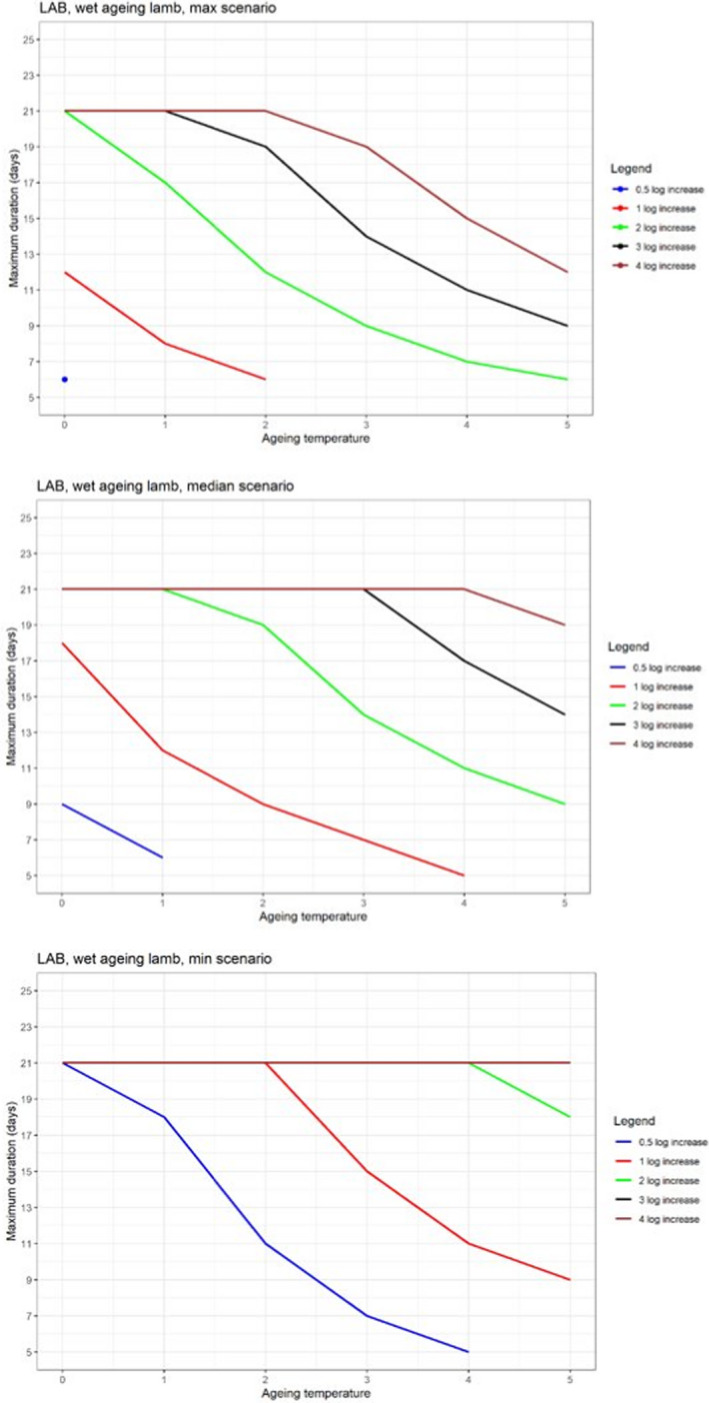
The impact of dry-ageing of beef and wet-ageing of beef, pork and lamb on microbiological hazards and spoilage bacteria was examined and current practices are described. As 'standard fresh' and wet-aged meat use similar processes these were differentiated based on duration. In addition to a description of the different stages, data were collated on key parameters (time, temperature, pH and aw) using a literature survey and questionnaires. The microbiological hazards that may be present in all aged meats included Shiga toxin-producing Escherichia coli (STEC), Salmonella spp., Staphylococcus aureus, Listeria monocytogenes, enterotoxigenic Yersinia spp., Campylobacter spp. and Clostridium spp. Moulds, such as Aspergillus spp. and Penicillium spp., may produce mycotoxins when conditions are favourable but may be prevented by ensuring a meat surface temperature of -0.5 to 3.0°C, with a relative humidity (RH) of 75-85% and an airflow of 0.2-0.5 m/s for up to 35 days. The main meat spoilage bacteria include Pseudomonas spp., Lactobacillus spp. Enterococcus spp., Weissella spp., Brochothrix spp., Leuconostoc spp., Lactobacillus spp., Shewanella spp. and Clostridium spp. Under current practices, the ageing of meat may have an impact on the load of microbiological hazards and spoilage bacteria as compared to standard fresh meat preparation. Ageing under defined and controlled conditions can achieve the same or lower loads of microbiological hazards and spoilage bacteria than the variable log10 increases predicted during standard fresh meat preparation. An approach was used to establish the conditions of time and temperature that would achieve similar or lower levels of L. monocytogenes and Yersinia enterocolitica (pork only) and lactic acid bacteria (representing spoilage bacteria) as compared to standard fresh meat. Finally, additional control activities were identified that would further assure the microbial safety of dry-aged beef, based on recommended best practice and the outputs of the equivalence assessment.

Keywords: Meat; bacterial growth; dry‐ageing; maturation; safety; wet‐ageing.


Figures

Figure 1
Figure 1
Schematic overview of the processes (conditions/types of meat) considered in this opinion
Figure 2
Figure 2
Generic process flow of dry and wet beef ageing
Figure 3
Figure 3
Dry‐ageing of beef. © Ana Allende
Figure 4
Figure 4
Growth rate (as square root of μ max ) at 4°C as a function of aw of relevant pathogenic and spoilage bacteria according to predictive models (input value for pH = 6), CB: ComBase; FSSP: Food Spoilage and Safety Predictor. Dotted line represents the square root of the inactivation rate (k max multiplied by 10 to present on the same scale) according to the non‐thermal survival model of ComBase
Figure 5
Figure 5
Measured, pH and aw values during dry‐ageing of beef for different process conditions (target temperature and RH) reported in the literature used as realistic examples. For case 4 and 5 temperature represent the target value (represented as dotted lines)
Figure 6
Figure 6
Predicted growth (log10 increase) of selected pathogens and spoilage bacteria during wet‐ageing of beef. The solid lines are the minimum (blue), median (black), and maximum (red) log10 increases during ageing based on constant mean growth rates. These growth rates were estimated from the variable growth rates during the standard fresh meat preparation (dotted vertical line). Light grey area indicates the min and max variable range of log10 increases and dark grey area the 5 and 95 percentile variable range
Figure 7
Figure 7
Predicted log10 increases of selected pathogens and spoilage bacteria during dry‐ageing of beef. The solid lines are the minimum (blue), median (black) and maximum (red) log10 increases during ageing based on constant mean growth rates. These growth rates were estimated from the variable growth rates during the first 14 days (standard fresh meat preparation time). The comparison for standard meat is the grey shaded areas in the corresponding graphs in Figure 6
Figure 8
Figure 8
Predicted log10 increases of selected pathogens and spoilage bacteria during wet‐ageing of pork. The solid lines are the minimum (blue), median (black) and maximum (red) log10 increases during prolonged ageing based on constant mean growth rates. These growth rates were estimated from the variable log10 increases during the standard fresh meat preparation time (dotted vertical line). Light grey indicates the min and max variable range of log10 increases and dark grey the 5 and 95 variable percentile range
Figure 9
Figure 9
Predicted log10 increases of selected pathogens and spoilage bacteria during wet‐ageing of lamb. The solid lines are the minimum (blue), median (black) and maximum (red) log10 increases during prolonged ageing based on constant mean growth rates. These growth rates were estimated from the variable log10 increases during the standard fresh meat preparation time (dotted vertical line). Light grey indicates the min and max variable range of log10 increases and dark grey the 5 and 95 variable percentile range
Figure 10
Figure 10
Predicted growth of L. monocytogenes (red) for different realistic cases of dynamic profiles of aw (orange), pH (grey) and temperature (blue) during dry‐ageing of beef under specific target temperature and relative humidity (RH) conditions found in the scientific literature (Bover Cid et al., 2022 for case 1 and 2; Panella‐Riera et al., 2021 for case 3; Smaldone et al.,  for case 4; da Silva et al., 2018 for case 5)
Figure 11
Figure 11
The impact of the range of aw‐values at fixed pH‐values (a) and the range of pH‐values at fixed aw‐values (b) on the equivalent temperature and ageing time conditions. These temperatures and times correspond to predicted log10 increases of L. monocytogenes in wet beef being equal or lower than the mean log10 increase during standard fresh meat preparation
Figure 12
Figure 12
Relationship between ageing temperature and maximum time for dry‐ageing of beef corresponding to different log10 increases of L. monocytogenes considered equivalent to standard beef ageing under the assumption of three scenarios of pH and aw, i.e. maximum (pH = 6.2; aw = 0.99), median (pH = 5.85; aw = 0.955) or minimum scenarios (pH = 5.5; aw = 0.92), and a maximum ageing time of 77 days
Figure 13
Figure 13
Relationship between ageing temperature and maximum time for dry‐ageing of beef corresponding to different log10 increases of LAB considered equivalent to standard beef ageing under the assumption of three scenarios of pH and aw, i.e. maximum (pH = 6.2; aw = 0.99), median (pH = 5.85; aw = 0.955) or minimum scenarios (pH = 5.5; aw = 0.92), and a maximum ageing time of 77 days
Figure 14
Figure 14
Relationship between ageing temperature and maximum time for wet‐ageing of beef corresponding to different log10 increases of L. monocytogenes considered equivalent to standard beef ageing under the assumption of three scenarios of pH and aw, i.e. maximum (pH = 5.9; aw = 0.99), median (pH = 5.5; aw = 0.98) or minimum scenarios (pH = 5.1; aw = 0.97), and a maximum ageing time of 49 days
Figure 15
Figure 15
Relationship between ageing temperature and maximum time for wet‐ageing of beef corresponding to different log10 increases of LAB considered equivalent to standard beef ageing under the assumption of three scenarios of pH and aw, i.e. maximum (pH = 5.9; aw = 0.99), median (pH = 5.5; aw = 0.98) or minimum scenarios (pH = 5.1; aw = 0.97), and a maximum ageing time of 49 days
Figure 16
Figure 16
Relationship between ageing temperature and maximum time for wet‐ageing of pork corresponding to different log10 increases of L. monocytogenes considered equivalent to standard pork ageing under the assumption of three scenarios of pH and aw, i.e. maximum (pH = 6.3; aw = 0.99), median (pH = 5.85; aw = 0.97) or minimum scenarios (pH = 5.4; aw = 0.95), and a maximum ageing time of 28 days
Figure 17
Figure 17
Relationship between ageing temperature and maximum time for wet‐ageing of pork corresponding to different log10 increases of LAB considered equivalent to standard pork ageing under the assumption of three scenarios of pH and aw, i.e. maximum (pH = 6.3; aw = 0.99), median (pH = 5.85; aw = 0.97) or minimum scenarios (pH = 5.4; aw = 0.95), and a maximum ageing time of 28 days
Figure 18
Figure 18
Relationship between ageing temperature and maximum time for wet‐ageing of lamb corresponding to different log10 increases of L. monocytogenes considered equivalent to standard pork ageing under the assumption of three scenarios of pH and aw, i.e. maximum (pH = 5.9; aw = 0.99), median (pH = 5.7; aw = 0.97) or minimum scenarios (pH = 5.5; aw = 0.95), and a maximum ageing time of 21 days
Figure 19
Figure 19
Relationship between ageing temperature and maximum time for wet‐ageing of lamb corresponding to different log10 increases of LAB considered equivalent to standard pork ageing under the assumption of three scenarios of pH and aw, i.e. maximum (pH = 5.9; aw = 0.99), median (pH = 5.7; aw = 0.97) or minimum scenarios (pH = 5.5; aw = 0.95), and a maximum ageing time of 21 days
Figure 20
Figure 20
The predicted log10 increase of L. monocytogenes during dry‐ageing of beef depending on the change of aw over time. Temperature was assumed to be 2.5°C and pH 5.5. The black line is case study 2 and the red line case study 5
Figure C.1
Figure C.1
Comparison between the Ln transformed values of μmax observed in raw meat under aerobic conditions (top left) and vacuum packaging conditions (top right) and the predictions provided by the model of Mejlholm and Dalgaard (Mejlholm and Dalgaard, 2009). Red line represents the equivalence (i.e. predictions equal to observations). For aerobic conditions, grey dots represent the uncorrected predictions, while green points represent the corrected values after applying the calibration factor. Plots on the bottom show the observed μmax (grey) versus the predicted μmax (blue) as a function of the temperature of the experiment. The predictions for two different extreme pH values are also represented with the lines for an illustrative purpose
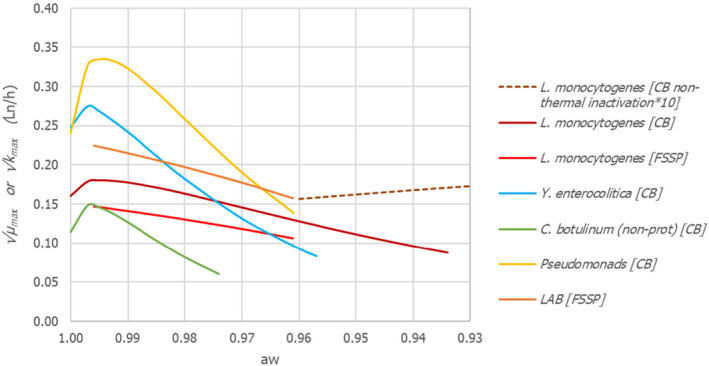
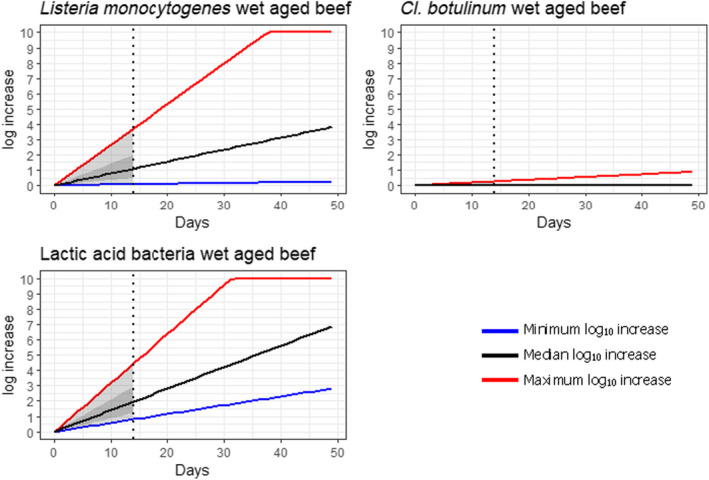
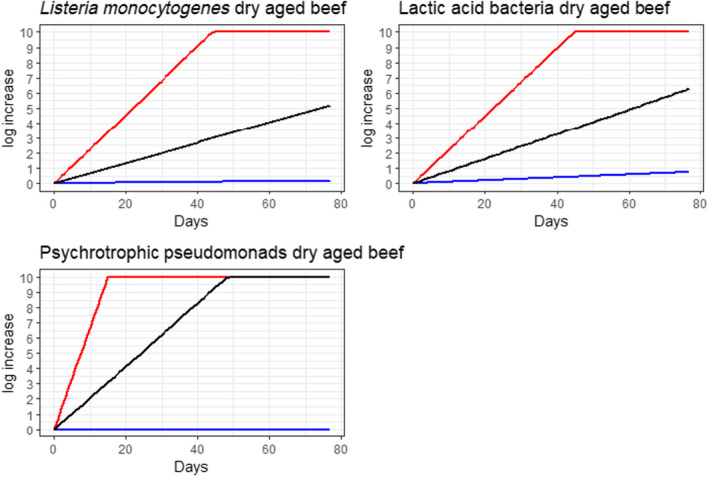
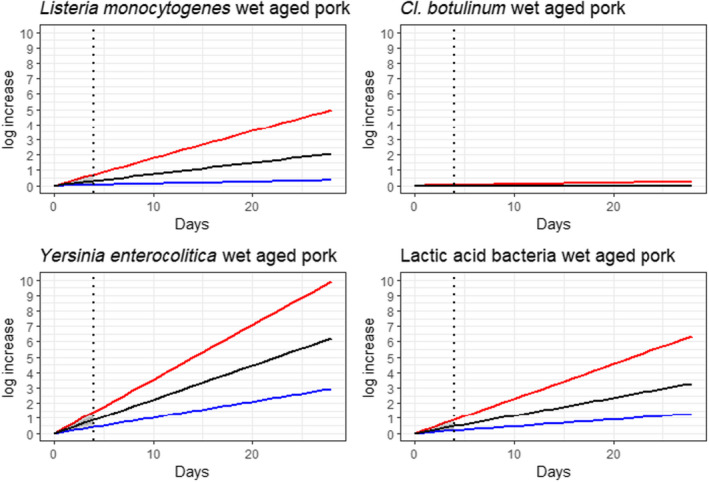
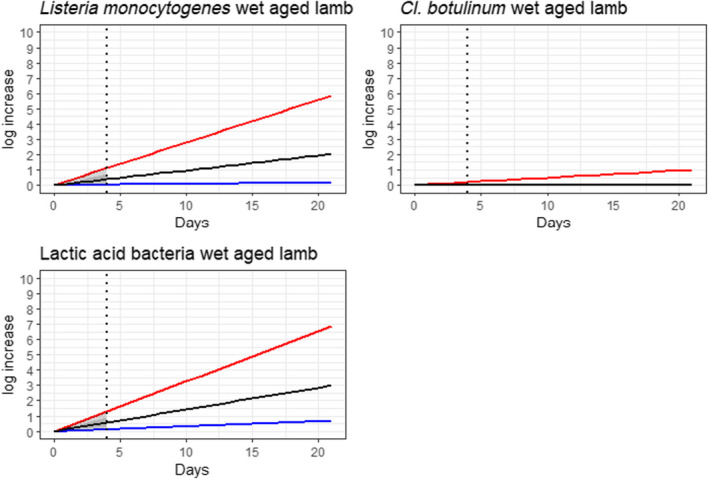
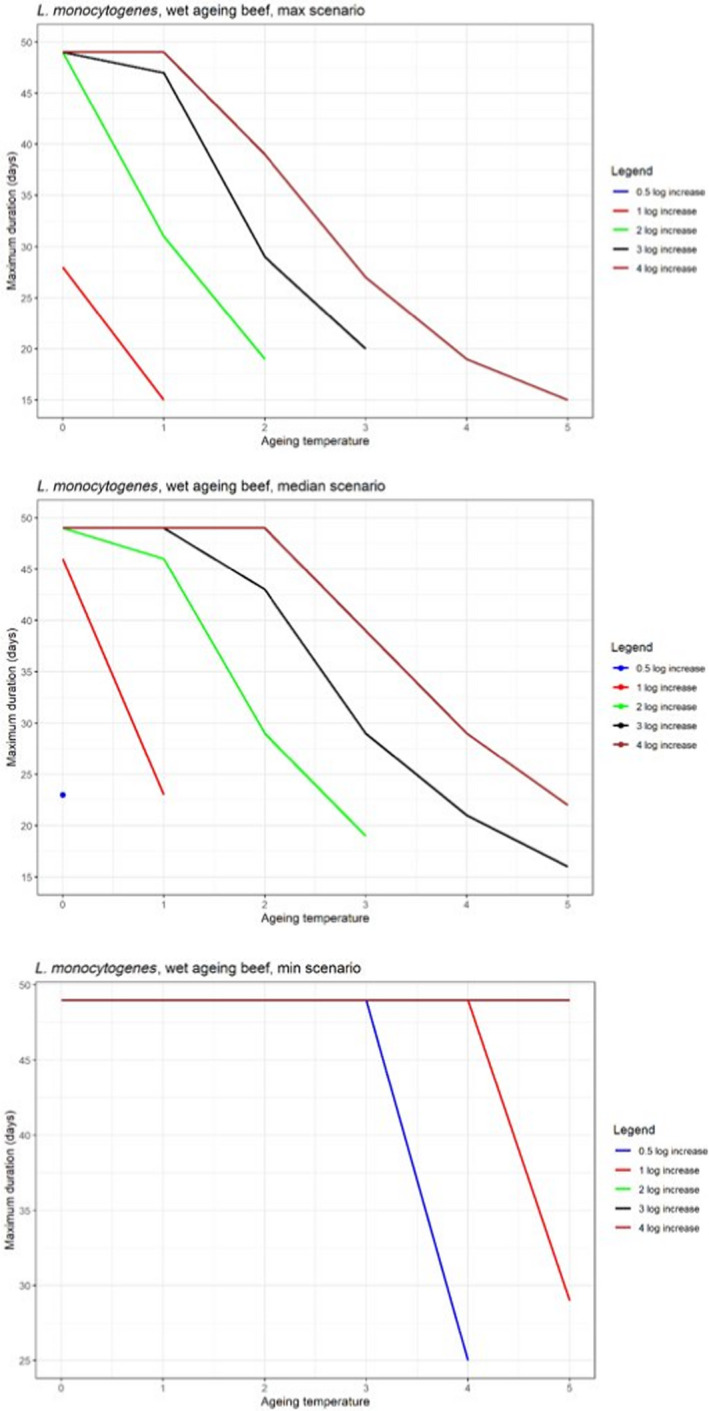
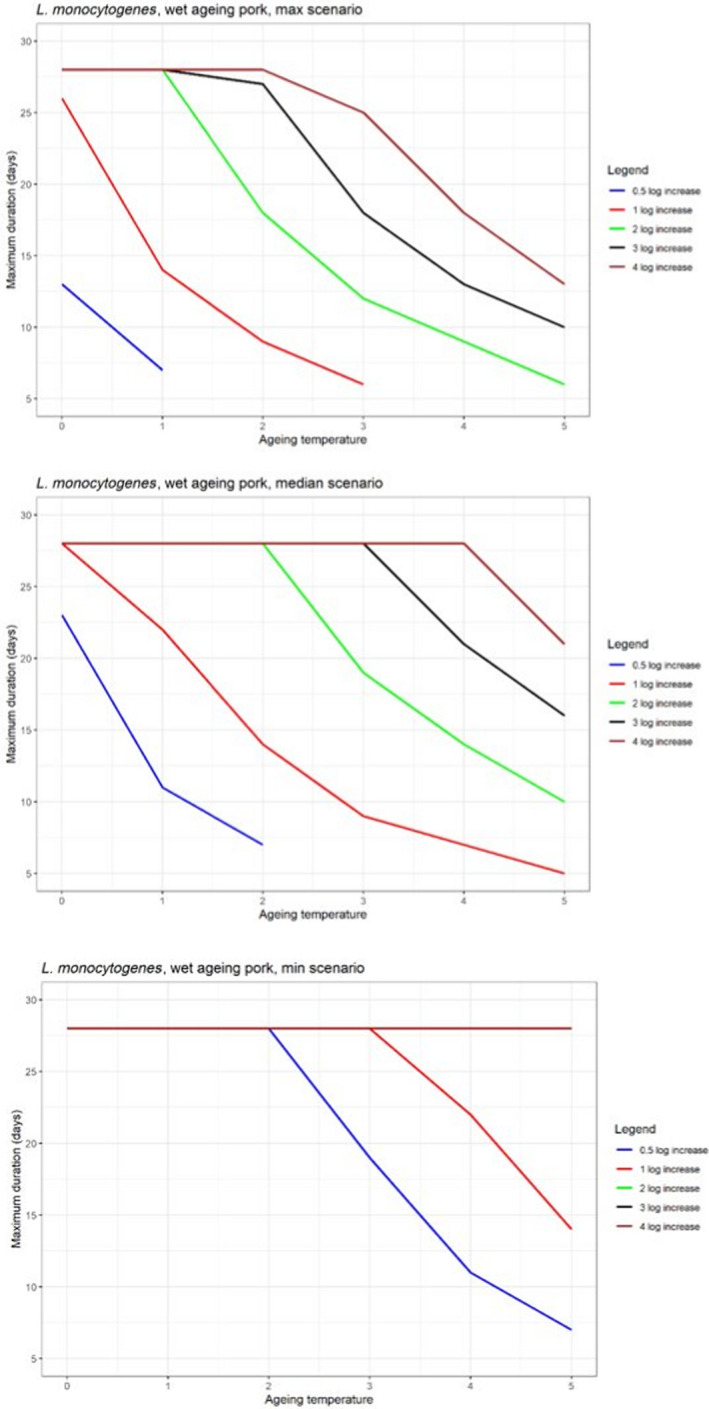
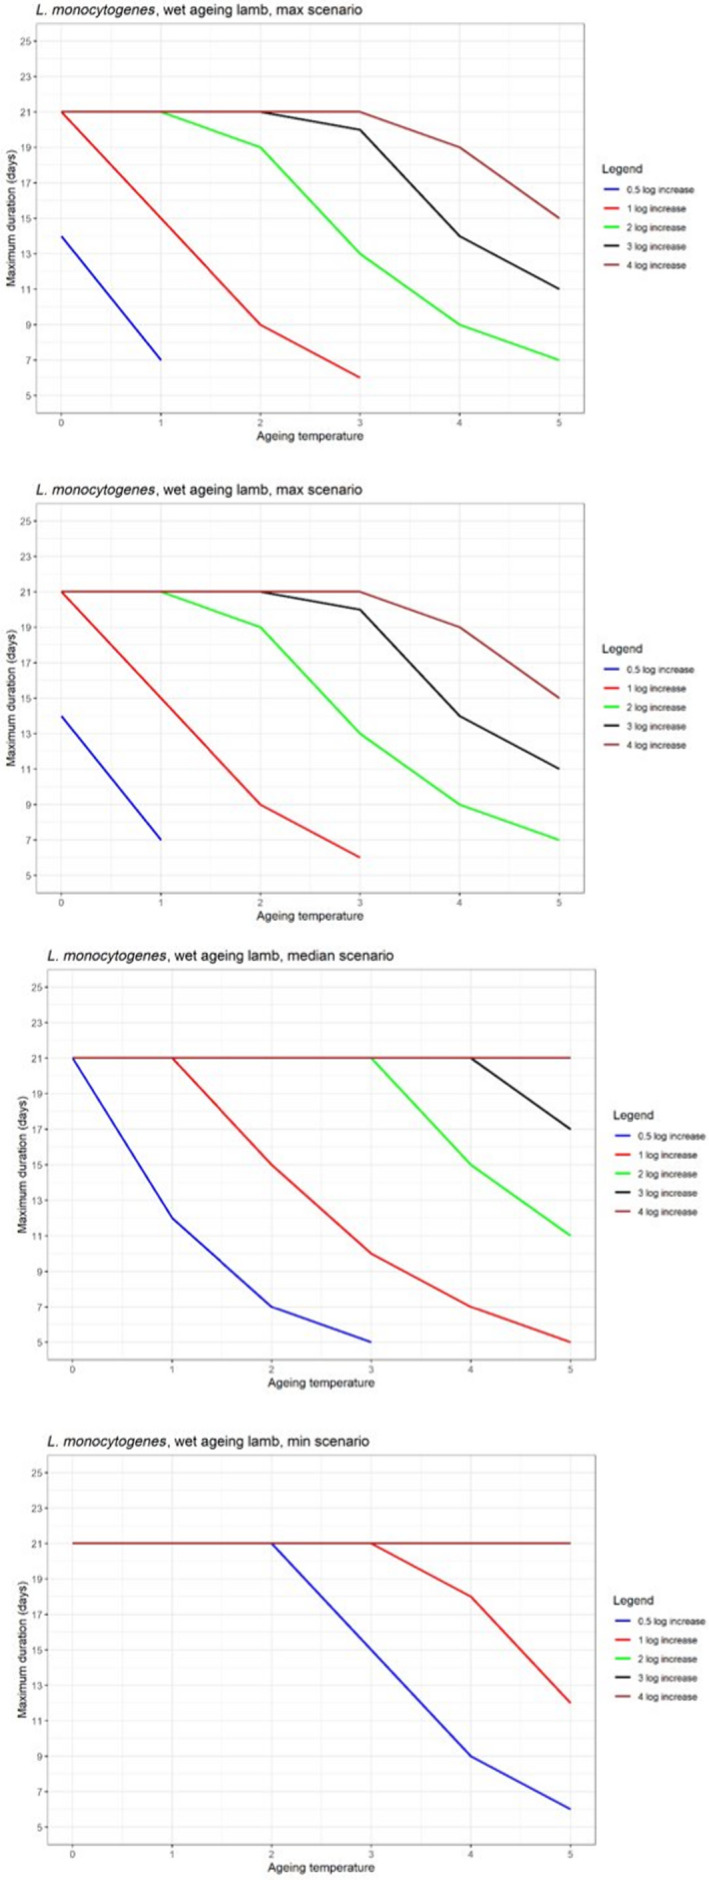
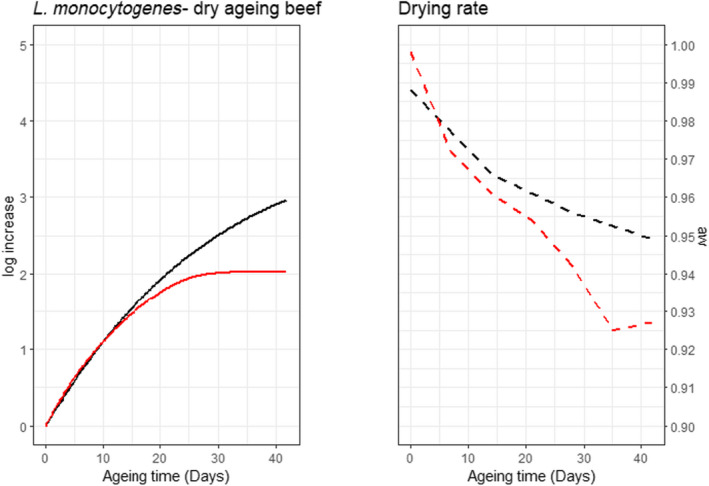
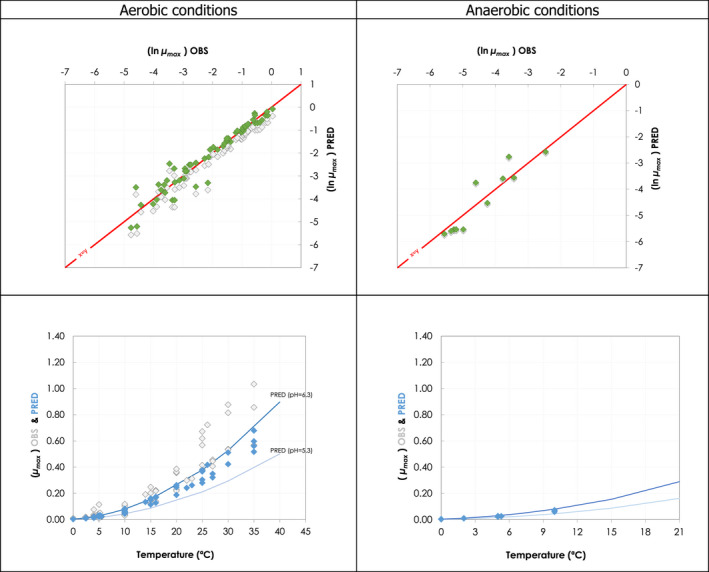
  1. Data from: (Lee et al., 2014); (Wang et al., 2015); (Solomakos et al., 2008); (Giménez et al., 2021) ComBase records ID: M371_LM; M372_LM; M373_LM; M374_LM; M781_LM; M801_LM; M754_LM; M782_LM; M755_LM; M905_LM; M783_LM; M803_LM; M53_LM; M798_LM; M756_LM; M804_LM; M369_LM; M370_LM; M757_LM; M52_LM; M758_LM; M759_LM; M760_LM; M761_LM; M784_LM; M805_LM; M785_LM; M762_LM; M763_LM; M779_LM; M786_LM; M807_LM; M764_LM; M787_LM; M799_LM; M765_LM; M766_LM; M788_LM; M789_LM; M808_LM; M767_LM; M768_LM; M769_LM; M770_LM; M771_LM; M790_LM; M791_LM; M800_LM; M809_LM; M772_LM; M773_LM; M774_LM; M775_LM; M776_LM; M792_LM; M793_LM; M777_LM; M778_LM; M780_LM; M794_LM; M795_LM; Pawr_1.

Figure C.2
Figure C.2
Comparison between the Ln transformed values of μmax observed for lactic acid bacteria in vacuum packaged raw meat and the predictions provided by the model of Mejlholm & Dalgaard (Mejlholm and Dalgaard, 2007, 2013). In the plot on the left, red line represents the equivalence (i.e., predictions equal to observations). Grey dots represent the uncorrected predictions, while green points represent the corrected values after applying the calibration factor. Plot on the right show the observed μmax (grey) versus the predicted μmax (blue) as a function of the temperature of the experiment. The predictions for two different extreme pH values are also represented with the lines for an illustrative purpose
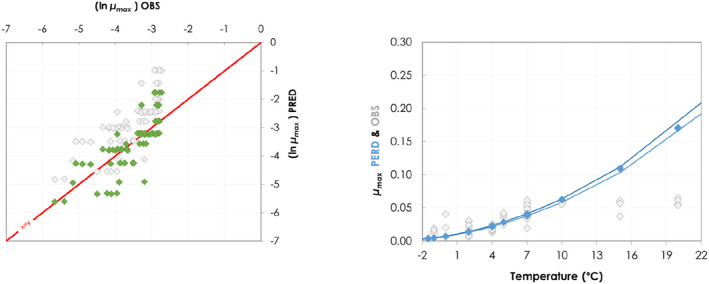
  1. Data from: (Barrera et al., 2007) Barrera et al. (2007); IRTA unpublished data; ComBase records ID: L‐1MRSA1; L‐1MRSA2; L‐1MRSAn1; L‐1MRSAn2; L2MRSA1; L2MRSA2; L2MRSAn1; L2MRSAn2; L7MRSA1; L7MRSA2; L7MRSAn1; L7MRSAn2; L_LAB0_1; L_LAB0_2; L_LAB‐1.5_1; L_LAB2_1; L_LAB2_2; L_LAB4_1; L_LAB4_2; L_LAB7_1; S_LAB0_1; S_LAB‐1.5_1; S_LAB2_1; S_LAB2_2; S_LAB4_1; S_LAB7_1; S_LAB7_2; CB01k_1_12; CB02k_1_12; CB03k_1_12; CB04k_1_12; CB05k_1_12; CB05k_2_12; CB05k_3_12; CB06k_1_12; CB06k_2_12; CB06k_3_12; CB07k_1_12; CB07k_2_12; CB07k_3_12; CB08k_1_12; CB08k_2_12; CB08k_3_12.

Figure C.3
Figure C.3
Comparison between the Ln transformed values of μmax observed for pseudomonads on aerobically stored meat and the predictions provided by the model of Neumeyer et al. (1997). In the plot on the left, the red line represents the equivalence (i.e., predictions equal to observations). Grey dots represent the uncorrected predictions, while green points represent the corrected values after applying the calibration factor. Plot on the right show the observed μmax (grey) versus the predicted μmax (blue) as a function of the temperature of the experiment
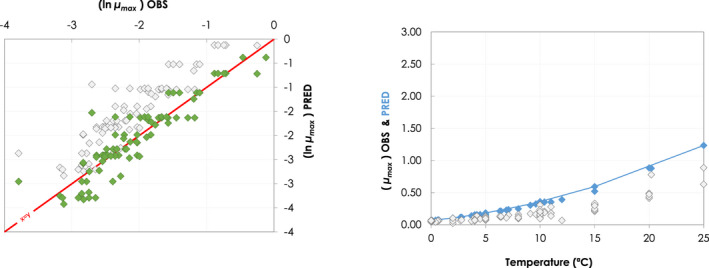
  1. Data from Skandamis and Nychas (2002a,b); Koutsoumanis et al. (2006); Tsigarida and Nychas (2001); Delaquis and McCurdy (1990); Lasta et al. (1995); Skandamis and Nychas (2002a,b) and ComBase records ID: allP_78; allP_79; allP_80; NP_101; NP_93; NP_97; NP_102; NP_94; NP_98; NP_103; NP_95; NP_99; NP_100; NP_104; NP_96; KTM_13; KTC_17; KTC_21; KTC_25; KTC_29; KMS_11; KML_11; Tas3484; Tas3485; Tas3486; Tas3487; Tas3499; Tas3500; Barrera_Ps1; PA_16; PA_15; PA_14; PA_13; BA_28; BA_27; BA_26; BA_25; PA_40; PA_39; PA_38; PA_37; BA_44; BA_43; BA_42; BA_41; PA_52; PA_51; PA_50.

Figure C.4
Figure C.4
Comparison between the Ln transformed values of μmax observed for Y. enterocolitica on aerobically stored meat and the predictions provided by the model obtained fitting the experimental data of Gill and Reichel (1989). In the plot of the left, the red line represents the equivalence (i.e. predictions equal to observations). Grey dots represent the uncorrected predictions, while green points represent the corrected values after applying the calibration factor. Plot on the right show the observed μmax (grey) versus the predicted μmax (blue) as a function of the temperature of the experiment
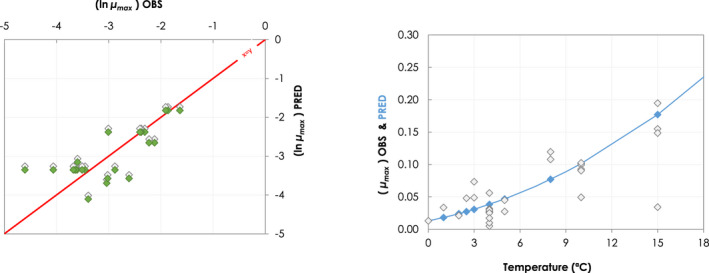
  1. Data from Gill and Reichel (1989); Bodnaruk and Draughon (1998); Özbaş et al. (1996) and ComBase records ID: Ye03_low_4; Ye03_high_4; Ye09_low_4; Ye09_high_4; Ye03_low_10; Ye03_high_10; Ye09_low_10; Ye09_high_10; Ye03_low_15; Ye03_high_15; Ye09_low_15; Ye09_high_15; M53_Ye; M54_Ye; M52_Ye; YE1_AIR_4; YE2_AIR_4; YE1_VP_4; YE2_VP_4.

Similar articles

Cited by

References

    1. ACMSF , 2020. The safety and shelf‐life of vacuum and modified atmosphere packed chilled foods with respect to non‐proteolytic Clostridium botulinum . Acta Biologica Szegediensis. Available online: http://www2.sci.u-szeged.hu/ABS
    1. Adam KH, Flint SH and Brightwell G, 2010. Psychrophilic and psychrotrophic clostridia: sporulation and germination processes and their role in the spoilage of chilled, vacuum‐packaged beef, lamb and venison. International Journal of Food Science and Technology, 45, 1539–1544. 10.1111/j.1365-2621.2010.02320.x - DOI
    1. Adams MR, Little CL and Easter MC, 1991. Modelling the effect of pH, acidulant and temperature on the growth rate of Yersinia enterocolitica . Journal of Applied Bacteriology, 71, 65–71. 10.1111/j.1365-2672.1991.tb04664.x - DOI - PubMed
    1. Ahnstrom ML, Seyfert M, Hunt MC and Johnson DE, 2006. Dry aging of beef in a bag highly permeable to water vapour. Meat Science, 73, 674–679. 10.1016/j.meatsci.2006.03.006 - DOI - PubMed
    1. Anon , 2006. Technology plays a key role. Fleischwirtschaft, 86:43‐44Baranyi J, Pin C and Ross T, 1999. Validating and comparing predictive models. International Journal of Food Microbiology, 48, 159–166. 10.1016/S0168-1605(99)00035-5 - DOI - PubMed

LinkOut - more resources