

Super-resolution and segmentation deep learning for breast cancer histopathology image analysis
- PMID: 36698665
- PMCID: PMC9841988
- DOI: 10.1364/BOE.463839
Super-resolution and segmentation deep learning for breast cancer histopathology image analysis
Abstract
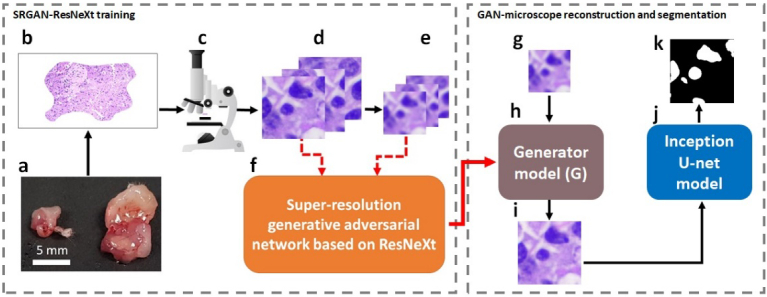
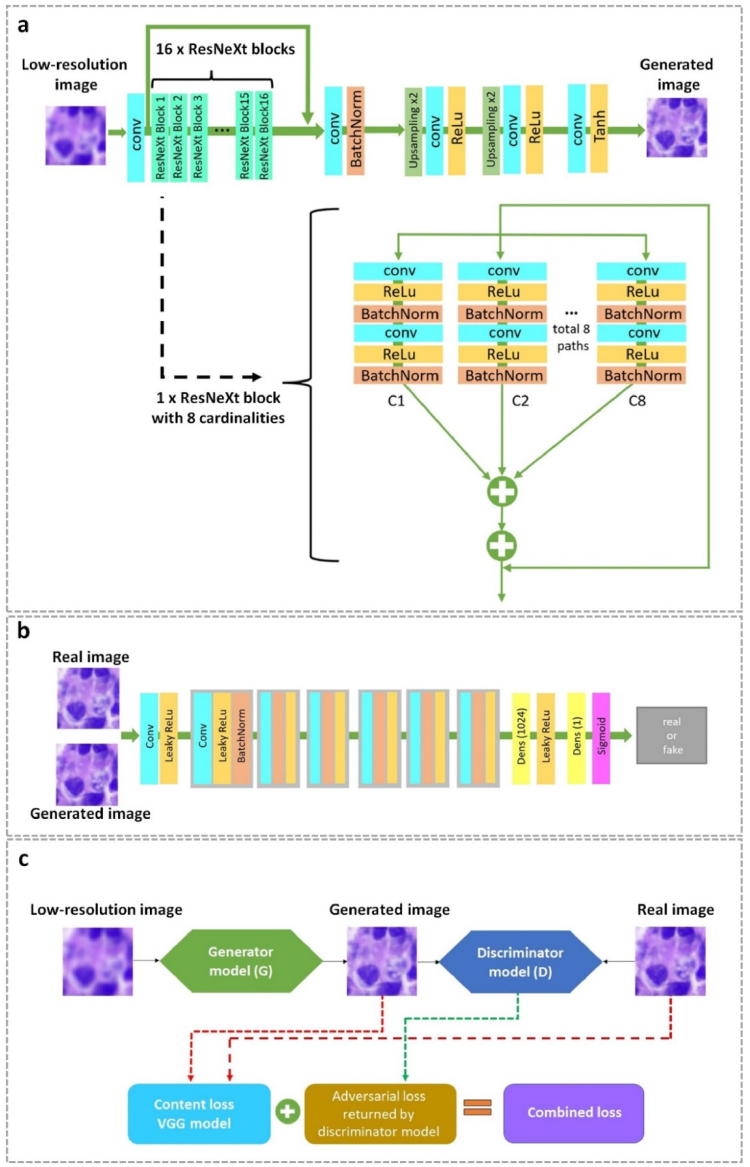
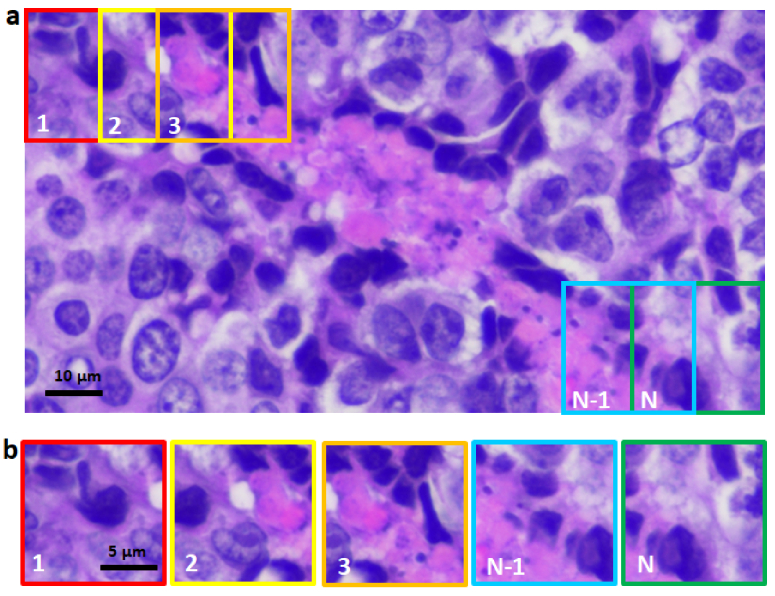
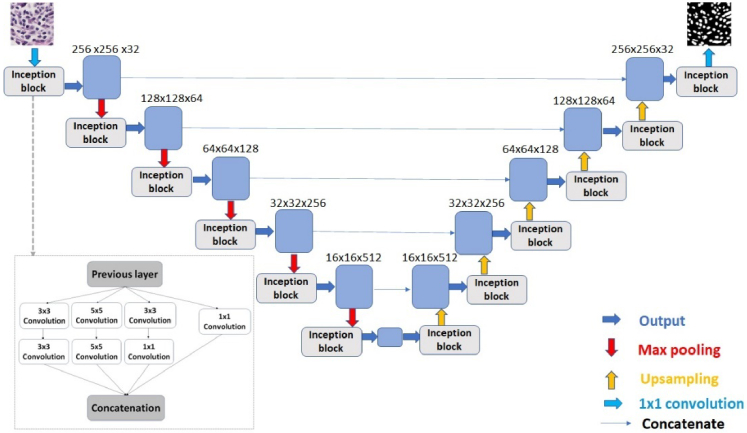
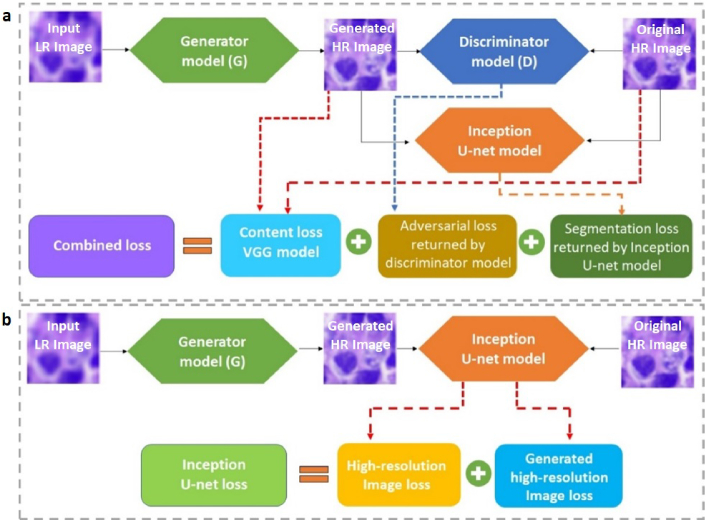
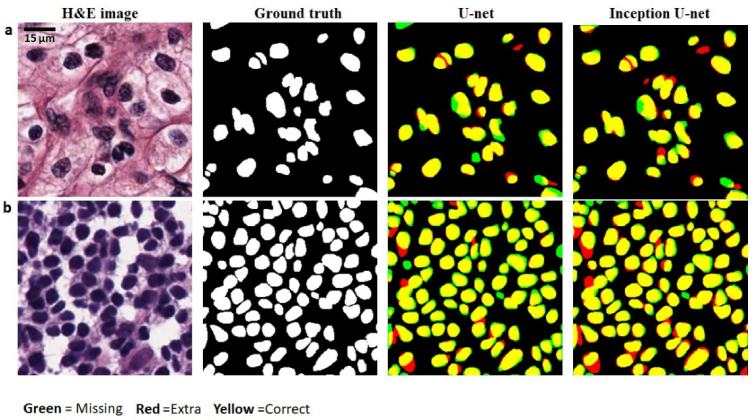
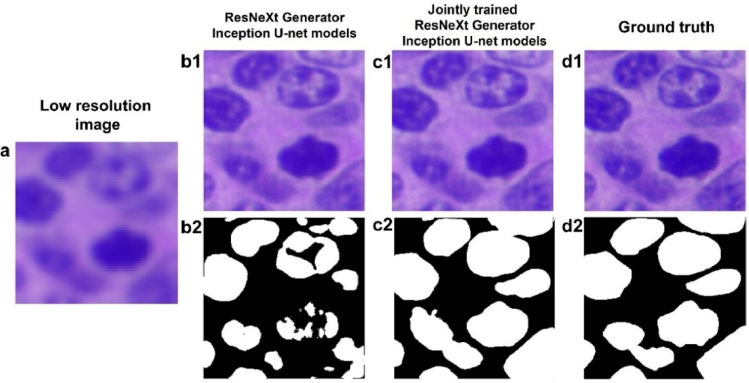
Traditionally, a high-performance microscope with a large numerical aperture is required to acquire high-resolution images. However, the images' size is typically tremendous. Therefore, they are not conveniently managed and transferred across a computer network or stored in a limited computer storage system. As a result, image compression is commonly used to reduce image size resulting in poor image resolution. Here, we demonstrate custom convolution neural networks (CNNs) for both super-resolution image enhancement from low-resolution images and characterization of both cells and nuclei from hematoxylin and eosin (H&E) stained breast cancer histopathological images by using a combination of generator and discriminator networks so-called super-resolution generative adversarial network-based on aggregated residual transformation (SRGAN-ResNeXt) to facilitate cancer diagnosis in low resource settings. The results provide high enhancement in image quality where the peak signal-to-noise ratio and structural similarity of our network results are over 30 dB and 0.93, respectively. The derived performance is superior to the results obtained from both the bicubic interpolation and the well-known SRGAN deep-learning methods. In addition, another custom CNN is used to perform image segmentation from the generated high-resolution breast cancer images derived with our model with an average Intersection over Union of 0.869 and an average dice similarity coefficient of 0.893 for the H&E image segmentation results. Finally, we propose the jointly trained SRGAN-ResNeXt and Inception U-net Models, which applied the weights from the individually trained SRGAN-ResNeXt and inception U-net models as the pre-trained weights for transfer learning. The jointly trained model's results are progressively improved and promising. We anticipate these custom CNNs can help resolve the inaccessibility of advanced microscopes or whole slide imaging (WSI) systems to acquire high-resolution images from low-performance microscopes located in remote-constraint settings.
© 2022 Optica Publishing Group under the terms of the Optica Open Access Publishing Agreement.
Conflict of interest statement
The authors declare no conflicts of interest related to this article.
Figures
Similar articles
-
Impact of color augmentation and tissue type in deep learning for hematoxylin and eosin image super resolution.J Pathol Inform. 2022 Oct 1;13:100148. doi: 10.1016/j.jpi.2022.100148. eCollection 2022. J Pathol Inform. 2022. PMID: 36268062 Free PMC article.
-
Using super-resolution generative adversarial network models and transfer learning to obtain high resolution digital periapical radiographs.Comput Biol Med. 2021 Feb;129:104139. doi: 10.1016/j.compbiomed.2020.104139. Epub 2020 Nov 26. Comput Biol Med. 2021. PMID: 33271400
-
A Generative Adversarial Network technique for high-quality super-resolution reconstruction of cardiac magnetic resonance images.Magn Reson Imaging. 2022 Jan;85:153-160. doi: 10.1016/j.mri.2021.10.033. Epub 2021 Oct 24. Magn Reson Imaging. 2022. PMID: 34699953
-
Generative adversarial network-based super-resolution of diffusion-weighted imaging: Application to tumour radiomics in breast cancer.NMR Biomed. 2020 Aug;33(8):e4345. doi: 10.1002/nbm.4345. Epub 2020 Jun 10. NMR Biomed. 2020. PMID: 32521567
-
Deep-learning-based image compression for microscopy images: An empirical study.Biol Imaging. 2024 Dec 20;4:e16. doi: 10.1017/S2633903X24000151. eCollection 2024. Biol Imaging. 2024. PMID: 39776609 Free PMC article. Review.
Cited by
-
Improving radiomic modeling for the identification of symptomatic carotid atherosclerotic plaques using deep learning-based 3D super-resolution CT angiography.Heliyon. 2024 Apr 9;10(8):e29331. doi: 10.1016/j.heliyon.2024.e29331. eCollection 2024 Apr 30. Heliyon. 2024. PMID: 38644848 Free PMC article.
-
Estimation of Left and Right Ventricular Ejection Fractions from cine-MRI Using 3D-CNN.Sensors (Basel). 2023 Jul 21;23(14):6580. doi: 10.3390/s23146580. Sensors (Basel). 2023. PMID: 37514888 Free PMC article.
-
Super-resolution techniques for biomedical applications and challenges.Biomed Eng Lett. 2024 Mar 19;14(3):465-496. doi: 10.1007/s13534-024-00365-4. eCollection 2024 May. Biomed Eng Lett. 2024. PMID: 38645589 Free PMC article. Review.
-
Three-dimensional C-scan-based generation adversarial network with synthetic input to improve optical coherence tomography angiography.J Biomed Opt. 2025 May;30(5):056006. doi: 10.1117/1.JBO.30.5.056006. Epub 2025 May 9. J Biomed Opt. 2025. PMID: 40352109 Free PMC article.
-
Multiscale transformers and multi-attention mechanism networks for pathological nuclei segmentation.Sci Rep. 2025 Apr 12;15(1):12549. doi: 10.1038/s41598-025-90397-2. Sci Rep. 2025. PMID: 40221423 Free PMC article.
References
-
- Litjens G., Sánchez C. I., Timofeeva N., Hermsen M., Nagtegaal I., Kovacs I., Hulsbergen-Van De Kaa C., Bult P., Van Ginneken B., Van Der Laak J., “Deep learning as a tool for increased accuracy and efficiency of histopathological diagnosis,” Sci. Rep. 6(1), 26286–11 (2016).10.1038/srep26286 - DOI - PMC - PubMed
-
- Bogoch I. I., Koydemir H. C., Tseng D., Ephraim R. K., Duah E., Tee J., Andrews J. R., Ozcan A., “Evaluation of a mobile phone-based microscope for screening of Schistosoma haematobium infection in rural Ghana,” Riv. Nuovo Cimento Soc. Ital. Fis. 96(6), 1468–1471 (2017).10.4269/ajtmh.16-0912 - DOI - PMC - PubMed
LinkOut - more resources
Full Text Sources
Research Materials
Miscellaneous