Review
. 2022 Dec 16;14(1):208-248.
doi: 10.1364/BOE.468932. eCollection 2023 Jan 1.

Recent advances in optical elastography and emerging opportunities in the basic sciences and translational medicine [Invited]

Affiliations
Review

Recent advances in optical elastography and emerging opportunities in the basic sciences and translational medicine [Invited]

Nichaluk Leartprapun et al. Biomed Opt Express. .

Abstract

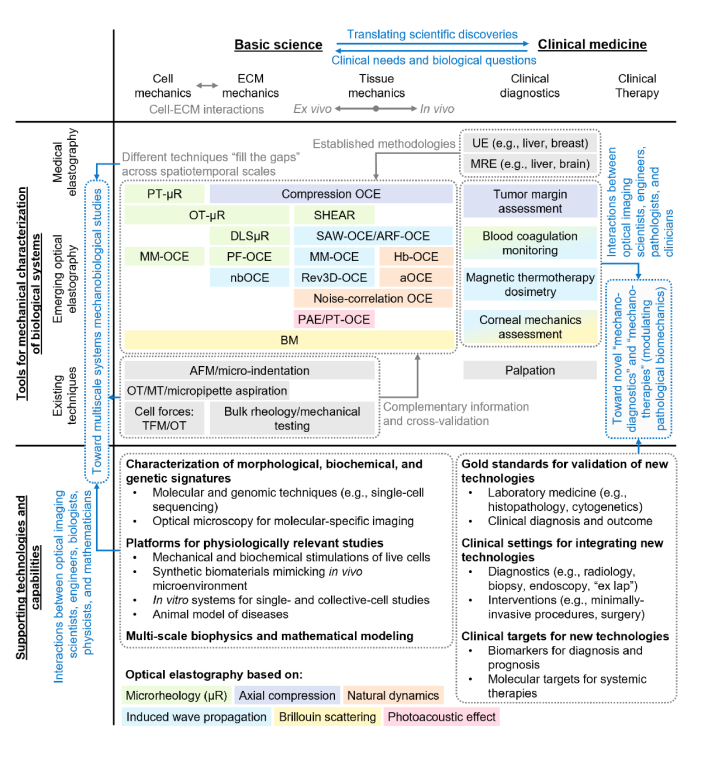
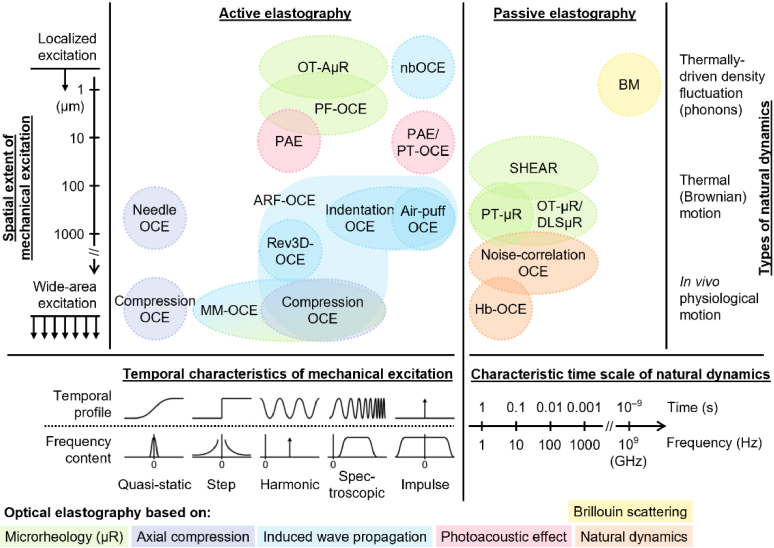
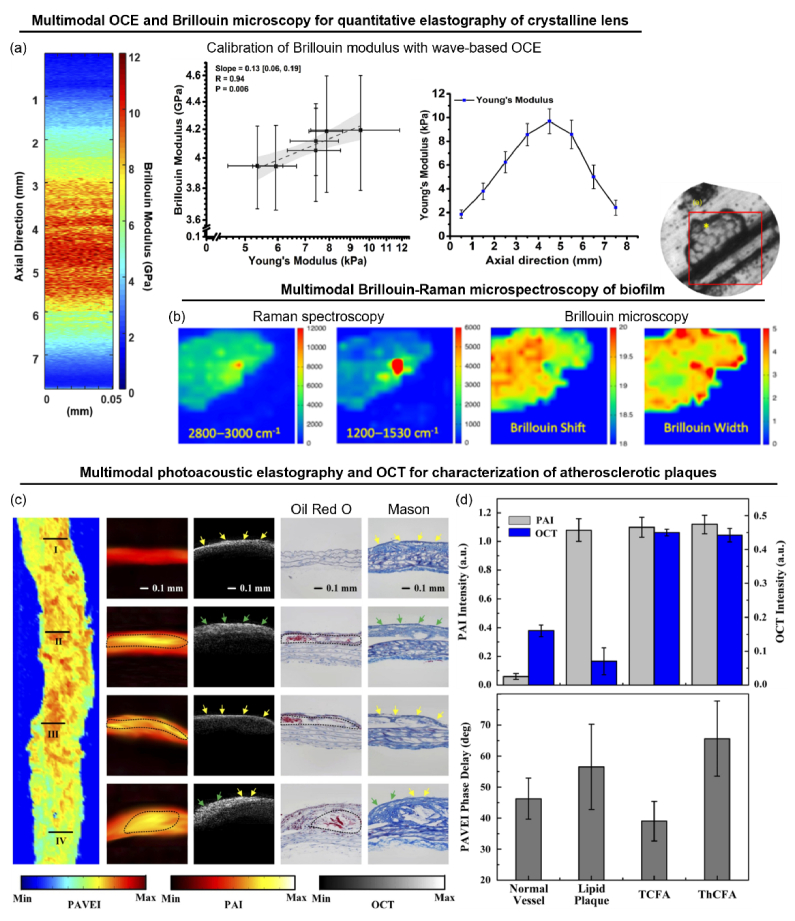
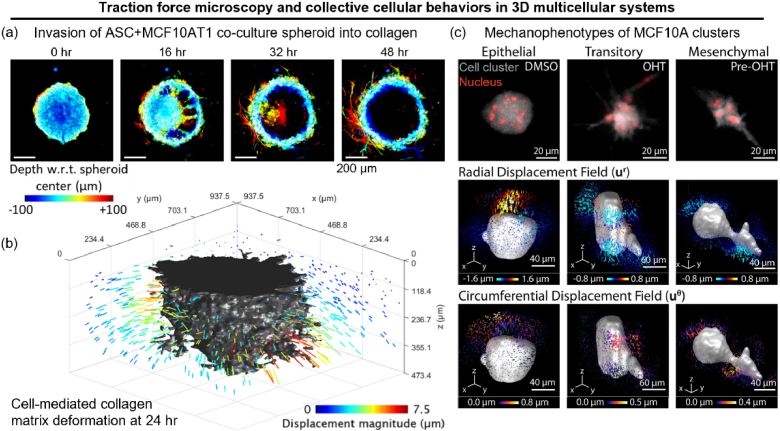
Optical elastography offers a rich body of imaging capabilities that can serve as a bridge between organ-level medical elastography and single-molecule biophysics. We review the methodologies and recent developments in optical coherence elastography, Brillouin microscopy, optical microrheology, and photoacoustic elastography. With an outlook toward maximizing the basic science and translational clinical impact of optical elastography technologies, we discuss potential ways that these techniques can integrate not only with each other, but also with supporting technologies and capabilities in other biomedical fields. By embracing cross-modality and cross-disciplinary interactions with these parallel fields, optical elastography can greatly increase its potential to drive new discoveries in the biomedical sciences as well as the development of novel biomechanics-based clinical diagnostics and therapeutics.


Conflict of interest statement

The authors declare that there are no conflicts of interest related to this article.

Figures

Fig. 1.
Fig. 1.
Optical elastography in the basic sciences and clinical medicine. Box colors categorize recent developments in optical elastography by their underlying principle (see bottom of the figure). Gray boxes denote other supporting techniques outside of optical elastography. Gray text and arrows describe the roles of different techniques and how their complementary capabilities can be leveraged in the broad landscape of biomedical sciences and clinical medicine. Blue text and arrows highlight opportunities for interactions between developers and stakeholders across different modalities and disciplines toward achieving impact in the basic sciences and clinical medicine. OCE: optical coherence elastography, MM-OCE: magnetomotive OCE, PF-OCE: photonic force OCE, nbOCE: nanbomb OCE, SAW-OCE: surface acoustic wave OCE, ARF-OCE: acoustic radiation force OCE, Rev3D-OCE: reverberant 3D OCE, Hb-OCE: heartbeat OCE, aOCE: anatomical OCE, PT-OCE: photothermal OCE, µR: microrheology, PT-µR: particle-tracking µR, OT-µR: optical tweezer µR, DLSµR: dynamic light scattering µR, SHEAR: laser Speckle rHEologicAl micRoscopy, BM: Brillouin microscopy, PAE: photoacoustic elastography, UE: ultrasound elastography, MRE: magnetic resonance elastography, AFM: atomic force microscopy, OT: optical tweezer, MT: magnetic tweezer, TFM: traction force microscopy, ECM: extracellular matrix.
Fig. 2.
Fig. 2.
Classification of methodologies in optical elastography. Active approaches are characterized by the spatiotemporal characteristics of applied mechanical excitation. Passive approaches are characterized by the type and characteristic time scale of naturally occurring mechanical ‘excitation’. For further details on key methodologies utilized by different techniques, see the following sections for optical elastography based on: Section 2.3 bulk compression, Section 2.4 induced wave propagation, Section 2.5 microrheology, Section 2.6 Brillouin scattering, and Section 2.7 photoacoustic effects. For techniques based on natural dynamics, the methodologies for noise-correlation OCE and Hb-OCE are similar to those of wave-based approaches and compression OCE, respectively; both techniques are further discussed in Section 3.3.
Fig. 3.
Fig. 3.
New modes of wave propagation in wave-based OCE. Simulated wave field of (a) longitudinal shear waves (LSW) propagating along depth from a vibrating plate (adapted with permission from [55] © Optica), (b) super-shear evanescent waves (SEW) propagating ahead of the surface acoustic waves (SAW) (reprinted from [75], with the permission of AIP Publishing), and (c) reverberant field produced by waves from multiple sources propagating in random directions. (d) Real-part of 2D autocorrelation map extracted from the xy-plane of reverberant field in (c). The profile cuts along x (red) and y (blue) are fit to analytical solutions (black curves) to extract the local wave number k. (e) and (f) Reverberant 3D (Rev3D)-OCE utilizes the 2D lateral autocorrelation of the reverberant wave field at each depth to reveal remarkable depth-resolved wave speed contrast in ex vivo porcine cornea. (c)–(f) Adapted by permission from Springer Nature: [15].
Fig. 4.
Fig. 4.
Passive optical elastography approaches. (a) Noise-correlation OCE utilizes natural motion in the sample to reconstruct the shear wavelength in the medium via time-reversal principle. (b) Passive noise-correlation OCE in the eye of an anesthetized rat produces elastogram consistent with traditional active wave-based OCE. (c) Heartbeat (Hb)-OCE measures axial strain in the cornea during cyclic compression (top) and relaxation (bottom) induced by “ocular pulses”. (d) Time-course of reconstructed corneal strain resembles the arterial pressure waveform (left), where the strain amplitude is larger in the untreated (UT) compared to the cross-linked (CXL) cornea (right). (e) Laser Speckle rHEologicAl micRoscopy (SHEAR) utilizes the fluctuation dynamics of laser speckle pattern to measure the MSD of endogenous tissue particles undergoing Brownian motion. Spatially-resolved map of shear modulus is reconstructed from the measured MSD via the GSER. (f) Maps of shear modulus magnitude, |G*|, and spatial gradient, ∇|G*|, in invasive ductal carcinoma (IDC), invasive papillary carcinoma (IPC), and invasive micropapillary carcinoma (IMPC), with corresponding H&E and picrosirius red (PSR) sections. Scale bar: 1 mm. Adapted with permission from: (a) and (b) [159], (c) and (d) [162], (e) [84] © SPIE, and (f) [20].
Fig. 5.
Fig. 5.
Integration of optical elastography technologies into handheld and minimally-invasive probes. (a) Handheld compression OCE device for quantitative micro-elastography of ex vivo tissue specimens. PA: PZT actuator, SB: silicone bilayer. (b) Anatomical OCE (aOCE) catheter endoscopically measure airway compliance by simultaneously capturing structural OCT image and intraluminal pressure. (c) Omni-directional viewing catheter with 4-faceted mirror for intracoronary SHEAR. OBF: optical fiber bundle, SMF: single mode fiber, GRIN: gradient index lens, MFPM: multi-faceted pyramidal mirror, DS: drive shaft, CP: circular polarizer, polycarbonate tube. Adapted with permission from: (a) [165], (b) [169], (c) [83] © Optica.
Fig. 6.
Fig. 6.
Demonstration of optical elastography in clinical settings. (a) and (b) Intraoperative tumor margin assessment with compression-OCE-based quantitative micro-elastography. T: invasive tumor, S: uninvolved stroma, A: adipose, NC: non-contact. (c) Stiffness spectra of various tissue types and (d) characteristic stiffness distribution of various breast cancer subtypes obtained from correlative compression OCE elastogram and histology section. (e) First-in-human implementation of dynamic indentation-based Rayleigh-wave OCE (left), showing examples of wave displacement fields in cornea at different frequencies (right). (f) Brillouin ocular scanner (left) assessment of biomechanical heterogeneity in mild to advance keratoconus (KC) (right). Adapted with permission from: (a) and (b) [49], (c) and (d) [18] © Optica. Adapted by permission from Springer Nature: (e) [57], (f) [110].
Fig. 7.
Fig. 7.
Probing micromechanical heterogeneity of the ECM with optical µR. (a) OT-AµR reveals local ECM stiffening during capillary sprouting. Scale bar: 20 µm. Reprinted from [23], with permission from Elsevier. (b) Simulated stiffness (left) and inferred stress (right) in a nonlinear fiber network around a contracting cell by NSIM. (c) Cell-generated stress inferred from OT-AµR and NSIM (top). Measured stiffness and inferred stress reveal stress-stiffening behavior of the ECM (bottom). (b) and (c) Adapted with permission from [21]. (d) DLSµR measures particle MSD and ECM G* before (green) and after (purple) latrunculin A (LatA) depolymerizes F-actin cytoskeleton (confocal images). Scale bar: 50 µm. (e) Force spectra obtained from G* on day 6. Adapted with permission from [24]. (f) Spectroscopic PF-OCE reveals characteristic frequency-dependent viscoelastic responses of polyacrylamide gel. fT: transition frequency, GN°: plateau modulus, ωx: power scaling law. Adapted with permission from [22] © Optica. (g) Light-sheet PF-OCE reveals microscale viscoelasticity of collagen gels [25]. Scale bar: 20 μm. (h) 3D light-sheet PF-OCE reveals fibroblast-mediated ECM remodeling. Scale bar: 50 μm. (g) and (h) Adapted with permission from Springer Nature: [25].
Fig. 8.
Fig. 8.
Imaging subcellular high-frequency biomechanics with BM. (a) BM of zebrafish larvae captures mechanical changes before (3 dpf), after spinal cord injury (3+ dpf), and post-repair (4-5 dpf). Scale bar: 150 µm. dpf: days post fertilization, Sc: spinal cord, nc: notochord. Reprinted from [17], with permission from Elsevier. (b) High-resolution BM of zebrafish notochord combined with double-peak spectral fitting resolves (c) sub-micron notochord ECM thickness. Scale bar: (b) 20 µm and (c) 1 µm. d: dorsal, v: ventral, m: muscle, sh: sheath cell, vac: vacuole. (b) and (c) Adapted with permission from [14] © Optica. (d) Phase contrast (top) and BM maps (bottom) of elasticity (frequency shift, left) and viscosity (linewidth, right) in live tumor spheroid, revealing stiffer elastic center (red bars) and softer viscous outer rim (blue bars). (e) Mechanical changes in the spheroid over 2 days of chemotherapy; phase contrast (top) shows disaggregation at the outer rim by Day 2. (d) and (e) Reprinted from [111] with permission. Copyright 2019 by the American Physical Society. (f) Mechanical changes (frequency shift, ΩB) in a developing nematode (larvae stages L2, L3, L4, young adult YA, and adult A) at the organ level. High-resolution BM of an adult gonad at the subcellular level (inset) reveals nuclei and nucleoli (white and black arrowheads), cytoplasm (asterisk), uterus edge (white arrow), oocyte pushed from the spermatheca into the uterus (black arrow), and a four-cell embryo in the uterus (black diamond arrow). Adapted by permission from Springer Nature: [16].
Fig. 9.
Fig. 9.
Multimodal optical elastography platforms. (a) 3D BM (left) and Brillouin-to-Young’s modulus calibration with wave-based OCE (middle) enables 3D elasticity imaging of crystalline lens (right). (b) BM and Raman spectroscopy enables simultaneous imaging of viscoelasticity and biochemical signatures in microbial biofilms. Regions of high Raman intensity may represent overlapping of cells and increased retention of water, which correspond to regions of low Brillouin shift (elasticity) and high Brillouin peak width (viscosity). (c) Photoacoustic viscoelasticity imaging (PAVEI), PA imaging (PAI), and OCT enables simultaneous characterization of atherosclerotic plaque relative viscosity, lipid core area (black dotted region, corroborated by Oil Red O staining), and fibrous cap thickness (yellow and green arrows for thin and thick caps, respectively, corroborated by Mason staining). (d) PAI intensity, OCT intensity, and PAVEI phase delay (relative viscosity) can distinguish different types of plaques during the progression from early-stage lipid plaque to middle-stage thin-cap fibroatheroma (TCFA) to late-stage thick-cap fibroatheroma (ThCFA) at the risk of rupture. Adapted with permission from: (a) [120], (c) and (d) [129] © Optica, (b) [177] © APS.
Fig. 10.
Fig. 10.
Recent developments in parallel biomedical research fields that can help maximize the basic science impact of optical elastography technologies. Increasing attention has been given to the study of collective ‘emergent’ behaviors in 3D multicellular systems. 4D time-lapsed imaging of (a) invasion dynamics and (b) cell-mediated matrix deformation of co-culture adipose stromal cell (ASC) and MCF10AT1 cancer spheroid. (c) Traction force microscopy of cell-mediated matrix deformation by cellular clusters exhibiting different epithelial-to-mesenchymal mechanophenotypes. Adapted with permission from: (a) and (b) [202], (c) [203].

Similar articles

Cited by

References

    1. Discher D. E., Janmey P., Wang Y. L., “Tissue cells feel and respond to the stiffness of their substrate,” Science 310(5751), 1139–1143 (2005).10.1126/science.1116995 - DOI - PubMed
    1. Paszek M. J., Zahir N., Johnson K. R., Lakins J. N., Rozenberg G. I., Gefen A., Reinhart-King C. A., Margulies S. S., Dembo M., Boettiger D., Hammer D. A., Weaver V. M., “Tensional homeostasis and the malignant phenotype,” Cancer Cell 8(3), 241–254 (2005).10.1016/j.ccr.2005.08.010 - DOI - PubMed
    1. Engler A. J., Sen S., Sweeney H. L., Discher D. E., “Matrix elasticity directs stem cell lineage specification,” Cell 126(4), 677–689 (2006).10.1016/j.cell.2006.06.044 - DOI - PubMed
    1. Eyckmans J., Boudou T., Yu X., Chen C. S., “A hitchhiker's guide to mechanobiology,” Dev. Cell 21(1), 35–47 (2011).10.1016/j.devcel.2011.06.015 - DOI - PMC - PubMed
    1. Wirtz D., Konstantopoulos K., Searson P. C., “The physics of cancer: the role of physical interactions and mechanical forces in metastasis,” Nat. Rev. Cancer 11(7), 512–522 (2011).10.1038/nrc3080 - DOI - PMC - PubMed

LinkOut - more resources