

Using metabolic potential within the airway microbiome as predictors of clinical state in persons with cystic fibrosis
- PMID: 36698799
- PMCID: PMC9868313
- DOI: 10.3389/fmed.2022.1082125
Using metabolic potential within the airway microbiome as predictors of clinical state in persons with cystic fibrosis
Abstract
Introduction: Pulmonary exacerbations (PEx) in persons with cystic fibrosis (CF) are primarily related to acute or chronic inflammation associated with bacterial lung infections, which may be caused by several bacteria that activate similar bacterial genes and produce similar by-products. The goal of our study was to perform a stratified functional analysis of bacterial genes at three distinct time points in the treatment of a PEx in order to determine the role that specific airway microbiome community members may play within each clinical state (i.e., PEx, end of antibiotic treatment, and follow-up). Our secondary goal was to compare the change between clinical states with the metabolic activity of specific airway microbiome community members.
Methods: This was a prospective observational study of persons with CF treated with intravenous antibiotics for PEx between 2016 and 2020 at Children's National Hospital. Demographic and clinical information as well as respiratory samples were collected at hospital admission for PEx, end of antibiotic treatment, and follow-up. Metagenomic sequencing was performed; MetaPhlAn3 and HUMANn3 were used to assign sequences to bacterial species and bacterial metabolic genes, respectively.
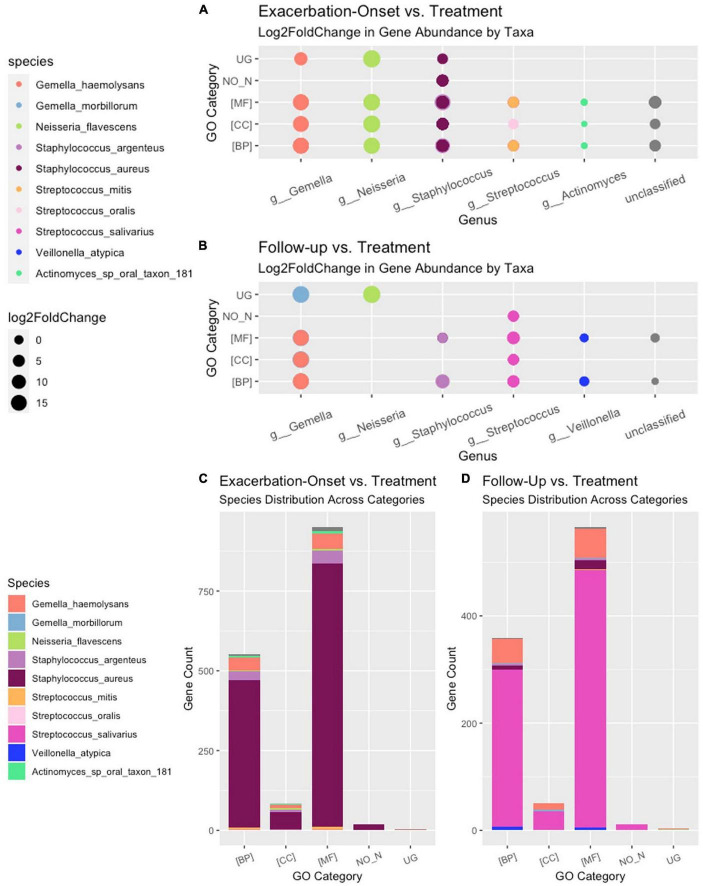
Results: Twenty-two persons with CF, with a mean age of 14.5 (range 7-23) years, experienced 45 PEx during the study period. Two-hundred twenty-one bacterial species were identified in the respiratory samples from the study cohort. Ten bacterial species had differential gene abundance across changes in the clinical state including Staphylococcus aureus, Streptococcus salivarius, and Veillonella atypica (all padj < 0.01 and log2FoldChange > |2|). These corresponded to a differential abundance of bacterial genes, with S. aureus accounting for 81% of the genes more abundant in PEx and S. salivarius accounting for 83% of the genes more abundant in follow-up, all compared to the end of treatment. Lastly, 8,653 metabolic pathways were identified across samples, with again S. aureus and S. salivarius contributing to the differential abundance of pathways (106 in PEx vs. 66 in follow-up, respectively). V. atypica was associated with a single metabolic pathway (UDP-N-acetyl-D-glucosamine biosynthesis) increased in follow-up compared to PEx.
Discussion: Taken together, these data suggest that the metabolic potential of bacterial species can provide more insight into changes across clinical states than the relative abundance of the bacteria alone.
Keywords: bacterial gene; cystic fibrosis; lung disease; metabolic pathway; microbiome.
Copyright © 2023 Shumyatsky, Burrell, Chaney, Sami, Koumbourlis, Freishtat, Crandall, Zemanick and Hahn.
Conflict of interest statement
The authors declare that the research was conducted in the absence of any commercial or financial relationships that could be construed as a potential conflict of interest.
Figures


Similar articles
-
Therapeutic beta-lactam dosages and broad-spectrum antibiotics are associated with reductions in microbial richness and diversity in persons with cystic fibrosis.Sci Rep. 2023 Jan 21;13(1):1217. doi: 10.1038/s41598-023-27628-x. Sci Rep. 2023. PMID: 36681756 Free PMC article.
-
Inflammation in children with cystic fibrosis: contribution of bacterial production of long-chain fatty acids.Pediatr Res. 2021 Jul;90(1):99-108. doi: 10.1038/s41390-021-01419-4. Epub 2021 Mar 2. Pediatr Res. 2021. PMID: 33654282 Free PMC article.
-
Impact of Antibiotics on the Lung Microbiome and Lung Function in Children With Cystic Fibrosis 1 Year After Hospitalization for an Initial Pulmonary Exacerbation.Open Forum Infect Dis. 2022 Sep 12;9(9):ofac466. doi: 10.1093/ofid/ofac466. eCollection 2022 Sep. Open Forum Infect Dis. 2022. PMID: 36168550 Free PMC article.
-
The Elusive Role of Airway Infection in Cystic Fibrosis Exacerbation.J Pediatric Infect Dis Soc. 2022 Sep 7;11(Supplement_2):S40-S45. doi: 10.1093/jpids/piac062. J Pediatric Infect Dis Soc. 2022. PMID: 36069900 Review.
-
Reevaluating approaches to cystic fibrosis pulmonary exacerbations.Pediatr Pulmonol. 2018 Nov;53(S3):S51-S63. doi: 10.1002/ppul.24125. Epub 2018 Jul 6. Pediatr Pulmonol. 2018. PMID: 29979495 Review.
Cited by
-
Molecular Accounting and Profiling of Human Respiratory Microbial Communities: Toward Precision Medicine by Targeting the Respiratory Microbiome for Disease Diagnosis and Treatment.Int J Mol Sci. 2023 Feb 17;24(4):4086. doi: 10.3390/ijms24044086. Int J Mol Sci. 2023. PMID: 36835503 Free PMC article. Review.
-
Remodeling of Gut Microbiome of Pakistani Expats in China After Ramadan Fasting.Food Sci Nutr. 2025 Feb 26;13(3):e70019. doi: 10.1002/fsn3.70019. eCollection 2025 Mar. Food Sci Nutr. 2025. PMID: 40012570 Free PMC article.
References
-
- Elborn J. Cystic fibrosis. Lancet. (2016) 388:2519–31. - PubMed
LinkOut - more resources
Full Text Sources