

Increased functional connectivity patterns in mild Alzheimer's disease: A rsfMRI study
- PMID: 36698861
- PMCID: PMC9869068
- DOI: 10.3389/fnagi.2022.1037347
Increased functional connectivity patterns in mild Alzheimer's disease: A rsfMRI study
Abstract
Background: Alzheimer's disease (AD) is the most common age-related neurodegenerative disorder. In view of our rapidly aging population, there is an urgent need to identify Alzheimer's disease (AD) at an early stage. A potential way to do so is by assessing the functional connectivity (FC), i.e., the statistical dependency between two or more brain regions, through novel analysis techniques.
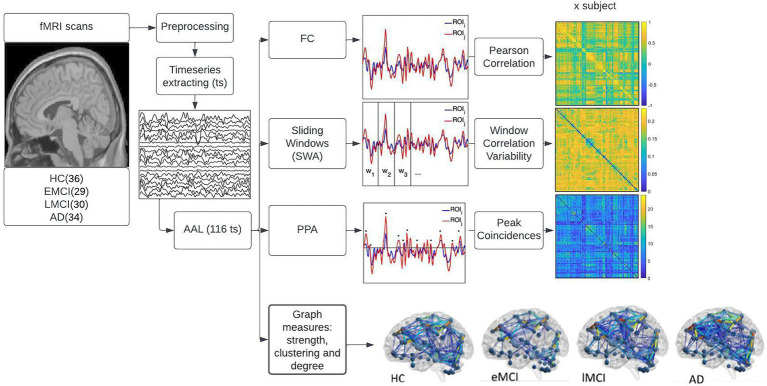
Methods: In the present study, we assessed the static and dynamic FC using different approaches. A resting state (rs)fMRI dataset from the Alzheimer's disease neuroimaging initiative (ADNI) was used (n = 128). The blood-oxygen-level-dependent (BOLD) signals from 116 regions of 4 groups of participants, i.e., healthy controls (HC; n = 35), early mild cognitive impairment (EMCI; n = 29), late mild cognitive impairment (LMCI; n = 30), and Alzheimer's disease (AD; n = 34) were extracted and analyzed. FC and dynamic FC were extracted using Pearson's correlation, sliding-windows correlation analysis (SWA), and the point process analysis (PPA). Additionally, graph theory measures to explore network segregation and integration were computed.
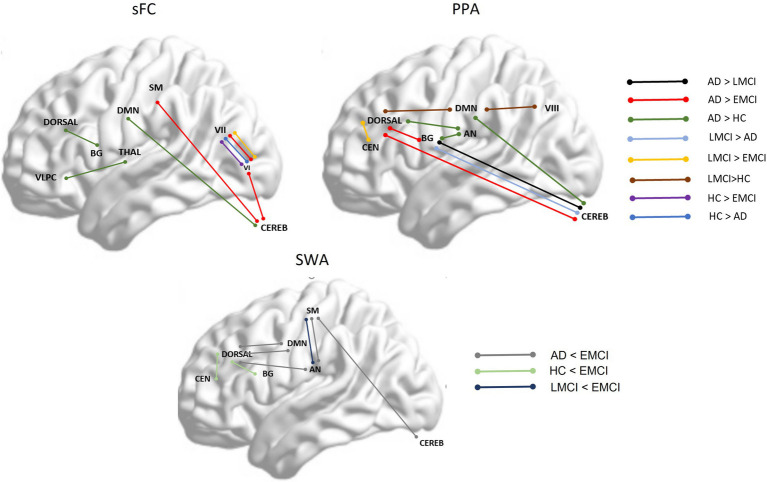
Results: Our results showed a longer characteristic path length and a decreased degree of EMCI in comparison to the other groups. Additionally, an increased FC in several regions in LMCI and AD in contrast to HC and EMCI was detected. These results suggest a maladaptive short-term mechanism to maintain cognition.
Conclusion: The increased pattern of FC in several regions in LMCI and AD is observable in all the analyses; however, the PPA enabled us to reduce the computational demands and offered new specific dynamic FC findings.
Keywords: Alzheimer’s disease; dynamic functional connectivity; functional connectivity; mild cognitive impairment; point process analysis; resting state fMRI.
Copyright © 2023 Penalba-Sánchez, Oliveira-Silva, Sumich and Cifre.
Conflict of interest statement
The authors declare that the research was conducted in the absence of any commercial or financial relationships that could be construed as a potential conflict of interest.
Figures
Similar articles
-
Altered Functional Connectivity of the Basal Nucleus of Meynert in Subjective Cognitive Impairment, Early Mild Cognitive Impairment, and Late Mild Cognitive Impairment.Front Aging Neurosci. 2021 Jun 25;13:671351. doi: 10.3389/fnagi.2021.671351. eCollection 2021. Front Aging Neurosci. 2021. PMID: 34248603 Free PMC article.
-
Functional Connectivity between the Resting-State Olfactory Network and the Hippocampus in Alzheimer's Disease.Brain Sci. 2019 Nov 25;9(12):338. doi: 10.3390/brainsci9120338. Brain Sci. 2019. PMID: 31775369 Free PMC article.
-
Altered Functional Connectivity of Basal Ganglia in Mild Cognitive Impairment and Alzheimer's Disease.Brain Sci. 2022 Nov 15;12(11):1555. doi: 10.3390/brainsci12111555. Brain Sci. 2022. PMID: 36421879 Free PMC article.
-
Static and Dynamic Functional Connectivity Alterations in Alzheimer's Disease and Neuropsychiatric Diseases.Brain Connect. 2023 Jun;13(5):307-314. doi: 10.1089/brain.2022.0044. Epub 2022 Sep 15. Brain Connect. 2023. PMID: 35994384 Review.
-
A survey on applications and analysis methods of functional magnetic resonance imaging for Alzheimer's disease.J Neurosci Methods. 2019 Apr 1;317:121-140. doi: 10.1016/j.jneumeth.2018.12.012. Epub 2018 Dec 26. J Neurosci Methods. 2019. PMID: 30593787 Review.
Cited by
-
The abnormal accumulation of pathological proteins and compensatory functional connectivity enhancement of insula subdivisions in mild cognitive impairment.Front Aging Neurosci. 2025 Mar 18;17:1506478. doi: 10.3389/fnagi.2025.1506478. eCollection 2025. Front Aging Neurosci. 2025. PMID: 40171383 Free PMC article.
-
Triple-network analysis of Alzheimer's disease based on the energy landscape.Front Neurosci. 2023 May 23;17:1171549. doi: 10.3389/fnins.2023.1171549. eCollection 2023. Front Neurosci. 2023. PMID: 37287802 Free PMC article.
-
A group based network analysis for Alzheimer's disease fMRI data.Sci Rep. 2025 Mar 29;15(1):10888. doi: 10.1038/s41598-025-95190-9. Sci Rep. 2025. PMID: 40157941 Free PMC article.
-
Altered brain connectivity in mild cognitive impairment is linked to elevated tau and phosphorylated tau, but not to GAP-43 and Amyloid-β measurements: a resting-state fMRI study.Mol Brain. 2024 Aug 30;17(1):60. doi: 10.1186/s13041-024-01136-z. Mol Brain. 2024. PMID: 39215335 Free PMC article.
-
MRI and Clinical Biomarkers Overlap between Glaucoma and Alzheimer's Disease.Int J Mol Sci. 2023 Oct 5;24(19):14932. doi: 10.3390/ijms241914932. Int J Mol Sci. 2023. PMID: 37834380 Free PMC article. Review.
References
LinkOut - more resources
Full Text Sources