

Develop ment and validation of a prognostic dynamic nomogram for in-hospital mortality in patients with Stanford type B aortic dissection
- PMID: 36698955
- PMCID: PMC9868166
- DOI: 10.3389/fcvm.2022.1099055
Develop ment and validation of a prognostic dynamic nomogram for in-hospital mortality in patients with Stanford type B aortic dissection
Abstract
Background: This study aimed to identify the risk factors for in-hospital mortality in patients with Stanford type B aortic dissection (TBAD) and develop and validate a prognostic dynamic nomogram for in-hospital mortality in these patients.
Methods: This retrospective study involved patients with TBAD treated from April 2002 to December 2020 at the General Hospital of Northern Theater Command. The patients with TBAD were divided into survival and non-survival groups. The data were analyzed by univariate and multivariate logistic regression analyses. To identify independent risk factors for in-hospital mortality, multivariate logistic regression analysis, least absolute shrinkage, and selection operator regression were used. A prediction model was constructed using a nomogram based on these factors and validated using the original data set. To assess its discriminative ability, the area under the receiver operating characteristic curve (AUC) was calculated, and the calibration ability was tested using a calibration curve and the Hosmer-Lemeshow test. Clinical utility was evaluated using decision curve analysis (DCA) and clinical impact curves (CIC).
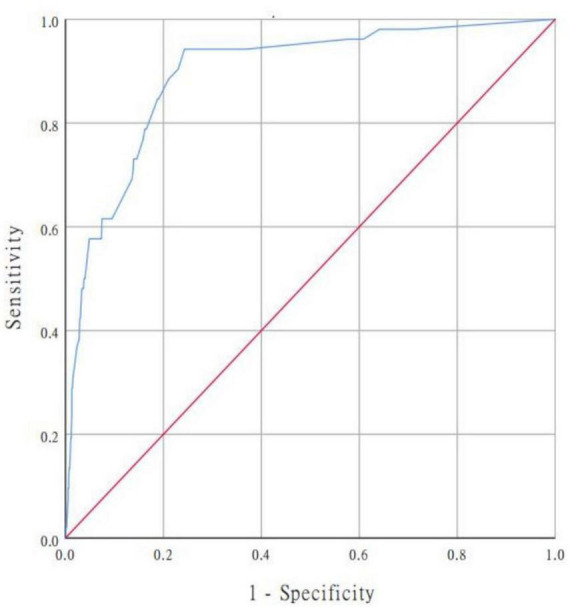
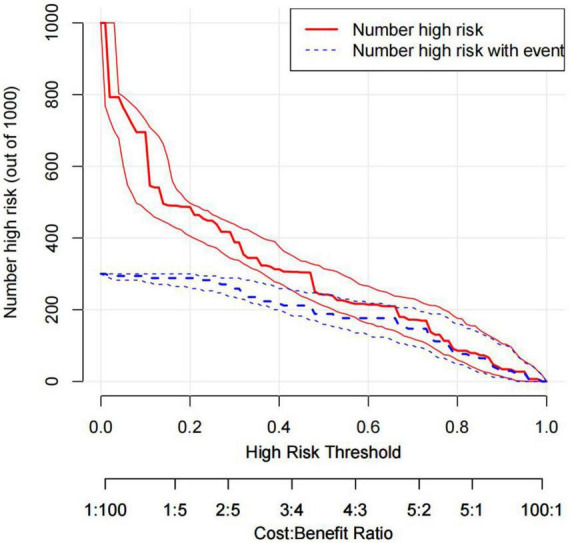
Results: Of the 978 included patients, 52 (5.3%) died in hospital. The following variables helped predict in-hospital mortality: pleural effusion, systolic blood pressure ≥160 mmHg, heart rate >100 bpm, anemia, ischemic cerebrovascular disease, abnormal cTnT level, and estimated glomerular filtration rate <60 ml/min. The prediction model demonstrated good discrimination [AUC = 0.894; 95% confidence interval (CI), 0.850-0.938]. The predicted probabilities of in-hospital death corresponded well to the actual prevalence rate [calibration curve: via 1,000 bootstrap resamples, a bootstrap-corrected Harrell's concordance index of 0.905 (95% CI, 0.865-0.945), and the Hosmer-Lemeshow test (χ2 = 8.3334, P = 0.4016)]. DCA indicated that when the risk threshold was set between 0.04 and 0.88, the predictive model could achieve larger clinical net benefits than "no intervention" or "intervention for all" options. Moreover, CIC showed good predictive ability and clinical utility for the model.
Conclusion: We developed and validated prediction nomograms, including a simple bed nomogram and online dynamic nomogram, that could be used to identify patients with TBAD at higher risk of in-hospital mortality, thereby better enabling clinicians to provide individualized patient management and timely and effective interventions.
Keywords: Stanford type B aortic dissection; in-hospital mortality; nomogram; prediction model; risk factors.
Copyright © 2023 Yang, Wang, He, Liu, Sui, Wang and Wang.
Conflict of interest statement
The authors declare that the research was conducted in the absence of any commercial or financial relationships that could be construed as a potential conflict of interest.
Figures


Similar articles
-
Construction and validation of a personalized risk prediction model for in-hospital mortality in patients with acute myocardial infarction undergoing percutaneous coronary intervention.Clinics (Sao Paulo). 2025 Feb 1;80:100580. doi: 10.1016/j.clinsp.2025.100580. eCollection 2025. Clinics (Sao Paulo). 2025. PMID: 39893830 Free PMC article.
-
A nomogram prediction model for short-term aortic-related adverse events in patients with acute Stanford type B aortic intramural hematoma: development and validation.Front Cardiovasc Med. 2024 Jul 10;11:1364361. doi: 10.3389/fcvm.2024.1364361. eCollection 2024. Front Cardiovasc Med. 2024. PMID: 39049955 Free PMC article.
-
Development and validation of a nomogram to predict postoperative delirium in type B aortic dissection patients underwent thoracic endovascular aortic repair.Front Surg. 2022 Sep 8;9:986185. doi: 10.3389/fsurg.2022.986185. eCollection 2022. Front Surg. 2022. PMID: 36468080 Free PMC article.
-
Development and validation of a nomogram for predicting in-hospital mortality of patients with cervical spine fractures without spinal cord injury.Eur J Med Res. 2024 Jan 29;29(1):80. doi: 10.1186/s40001-024-01655-4. Eur J Med Res. 2024. PMID: 38287435 Free PMC article.
-
Development and validation of a risk prediction model for aspiration in patients with acute ischemic stroke.J Clin Neurosci. 2024 Jun;124:60-66. doi: 10.1016/j.jocn.2024.04.022. Epub 2024 Apr 22. J Clin Neurosci. 2024. PMID: 38652929
Cited by
-
Correlation of the serum cell division cycle 42 with CD4+ T cell subsets and in-hospital mortality in Stanford type B aortic dissection patients.Front Cardiovasc Med. 2024 Feb 27;11:1324345. doi: 10.3389/fcvm.2024.1324345. eCollection 2024. Front Cardiovasc Med. 2024. PMID: 38476381 Free PMC article.
-
Prognostic Significance of Preoperative Neutrophil-to-lymphocyte Ratio and Platelet-to-lymphocyte Ratio in Patients with Ruptured Abdominal Aortic Aneurysm Undergoing Endovascular Aneurysm Repair.J Cardiothorac Surg. 2024 Dec 19;19(1):650. doi: 10.1186/s13019-024-03165-0. J Cardiothorac Surg. 2024. PMID: 39702354 Free PMC article.
-
The clinical prediction model to distinguish between colonization and infection by Klebsiella pneumoniae.Front Microbiol. 2025 Jan 23;15:1508030. doi: 10.3389/fmicb.2024.1508030. eCollection 2024. Front Microbiol. 2025. PMID: 39917270 Free PMC article.
References
LinkOut - more resources
Full Text Sources
Research Materials
Miscellaneous