

The putative maintaining mechanism of gut bacterial ecosystem in giant pandas and its potential application in conservation
- PMID: 36699119
- PMCID: PMC9850007
- DOI: 10.1111/eva.13494
The putative maintaining mechanism of gut bacterial ecosystem in giant pandas and its potential application in conservation
Abstract
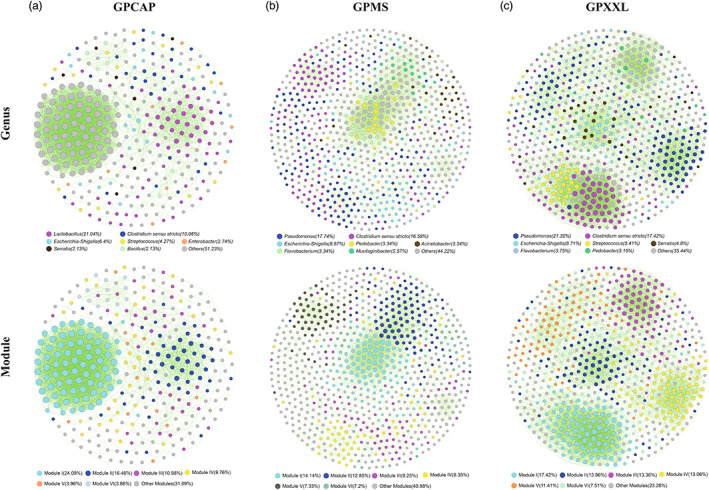
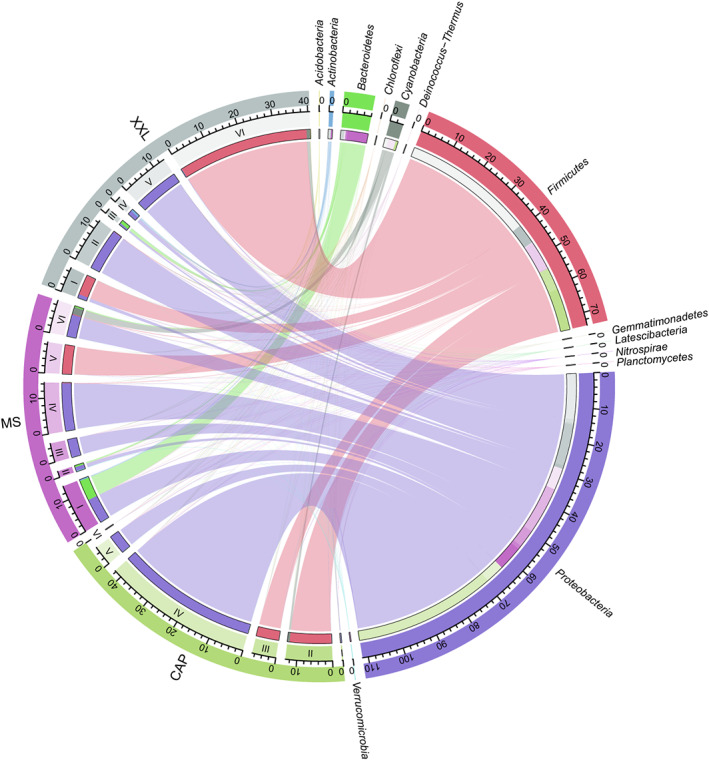
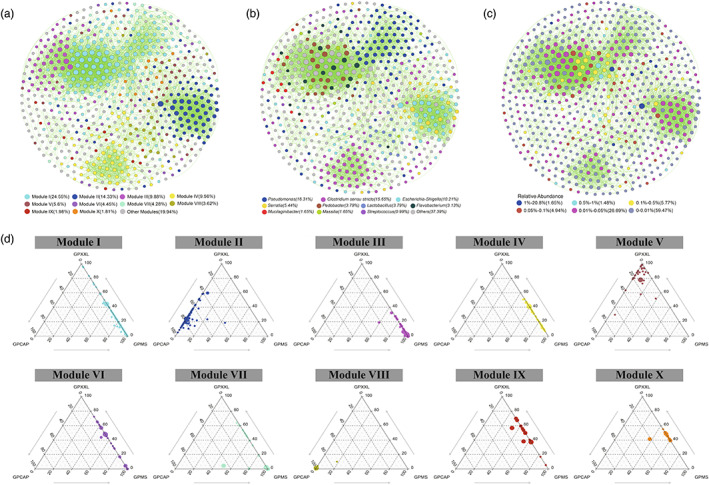
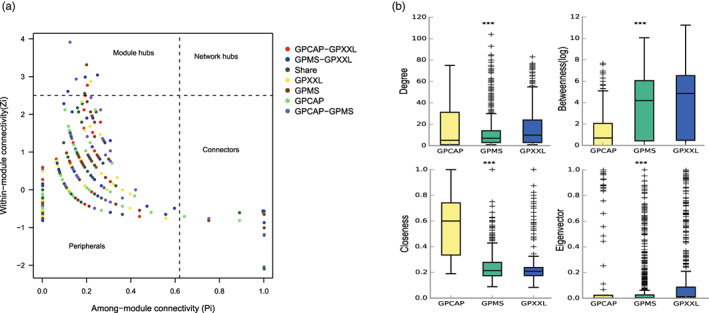
Animals living in captivity and the wild show differences in the internal structure of their gut microbiomes. Here, we performed a meta-analysis of the microbial data of about 494 fecal samples obtained from giant pandas (captive and wild giant pandas). Our results show that the modular structures and topological features of the captive giant panda gut microbiome differ from those of the wild populations. The co-occurrence network of wild giant pandas also contained more nodes and edges, indicating a higher complexity and stability compared to that of captive giant pandas. Keystone species analysis revealed the differences between geographically different wild populations, indicating the potential effect of geography on the internal modular structure. When combining all the giant panda samples for module analysis, we found that the abundant taxa (e.g., belonged to Flavobacterium, Herbaspirillum, and Escherichia-Shigella) usually acted as module hubs to stabilize the modular structure, while the rare taxa usually acted as connectors of different modules. We conclude that abundant and rare taxa play different roles in the gut bacterial ecosystem. The conservation of some key bacterial species is essential for promoting the development of the gut microbiome in pandas. The living environment of the giant pandas can influence the internal structure, topological features, and strength of interrelationships in the gut microbiome. This study provides new insights into the conservation and management of giant panda populations.
Keywords: gut microbiome; keystone species; maintaining mechanism; module analysis; rare taxa; wild and captive giant panda.
© 2022 The Authors. Evolutionary Applications published by John Wiley & Sons Ltd.
Conflict of interest statement
The authors declare that they have no known competing financial interests or personal relationships that could have appeared to influence the work reported in this article.
Figures
Similar articles
-
The Potential of Co-Evolution and Interactions of Gut Bacteria-Phages in Bamboo-Eating Pandas: Insights from Dietary Preference-Based Metagenomic Analysis.Microorganisms. 2024 Mar 31;12(4):713. doi: 10.3390/microorganisms12040713. Microorganisms. 2024. PMID: 38674657 Free PMC article.
-
Comparative Study of Gut Microbiota in Wild and Captive Giant Pandas (Ailuropoda melanoleuca).Genes (Basel). 2019 Oct 20;10(10):827. doi: 10.3390/genes10100827. Genes (Basel). 2019. PMID: 31635158 Free PMC article.
-
Captivity increased the abundance of high-risk antibiotic resistance genes in the giant panda gut microbiome.Environ Res. 2024 Dec 15;263(Pt 3):120220. doi: 10.1016/j.envres.2024.120220. Epub 2024 Oct 22. Environ Res. 2024. PMID: 39448015
-
The Science Underlying Giant Panda Conservation Translocations.Animals (Basel). 2023 Oct 26;13(21):3332. doi: 10.3390/ani13213332. Animals (Basel). 2023. PMID: 37958087 Free PMC article. Review.
-
Review on parasites of wild and captive giant pandas (Ailuropoda melanoleuca): Diversity, disease and conservation impact.Int J Parasitol Parasites Wildl. 2020 Jul 28;13:38-45. doi: 10.1016/j.ijppaw.2020.07.007. eCollection 2020 Dec. Int J Parasitol Parasites Wildl. 2020. PMID: 32793415 Free PMC article. Review.
Cited by
-
Multi-omics analysis of gut microbiota and metabolites reveals contrasting profiles in domestic pigs and wild boars across urban environments.Front Microbiol. 2024 Aug 13;15:1450306. doi: 10.3389/fmicb.2024.1450306. eCollection 2024. Front Microbiol. 2024. PMID: 39193431 Free PMC article.
-
Adaptive changes in the intestinal microbiota of giant pandas following reintroduction.Sci Rep. 2025 Aug 23;15(1):31014. doi: 10.1038/s41598-025-16136-9. Sci Rep. 2025. PMID: 40849504
-
Effects of ex situ conservation on commensal bacteria of crocodile lizard and conservation implications.Vet Q. 2025 Dec;45(1):1-14. doi: 10.1080/01652176.2025.2463704. Epub 2025 Feb 10. Vet Q. 2025. PMID: 39930789 Free PMC article.
-
Natural mating ability is associated with gut microbiota composition and function in captive male giant pandas.Ecol Evol. 2024 Apr 1;14(4):e11189. doi: 10.1002/ece3.11189. eCollection 2024 Apr. Ecol Evol. 2024. PMID: 38571808 Free PMC article.
-
The Potential of Co-Evolution and Interactions of Gut Bacteria-Phages in Bamboo-Eating Pandas: Insights from Dietary Preference-Based Metagenomic Analysis.Microorganisms. 2024 Mar 31;12(4):713. doi: 10.3390/microorganisms12040713. Microorganisms. 2024. PMID: 38674657 Free PMC article.
References
-
- Arumugam, M. , Raes, J. , Pelletier, E. , le Paslier, D. , Yamada, T. , Mende, D. R. , Fernandes, G. R. , Tap, J. , Bruls, T. , Batto, J. M. , Bertalan, M. , Borruel, N. , Casellas, F. , Fernandez, L. , Gautier, L. , Hansen, T. , Hattori, M. , Hayashi, T. , Kleerebezem, M. , … Bork, P. (2011). Enterotypes of the human gut microbiome. Nature, 473(7346), 174–180. 10.1038/nature09944 - DOI - PMC - PubMed
LinkOut - more resources
Full Text Sources
