. 2023 Jan 20;5(1):e0825.
doi: 10.1097/CCE.0000000000000825. eCollection 2023 Jan.

Overt and Occult Hypoxemia in Patients Hospitalized With COVID-19

Affiliations

Overt and Occult Hypoxemia in Patients Hospitalized With COVID-19

Shrirang M Gadrey et al. Crit Care Explor. .

Abstract

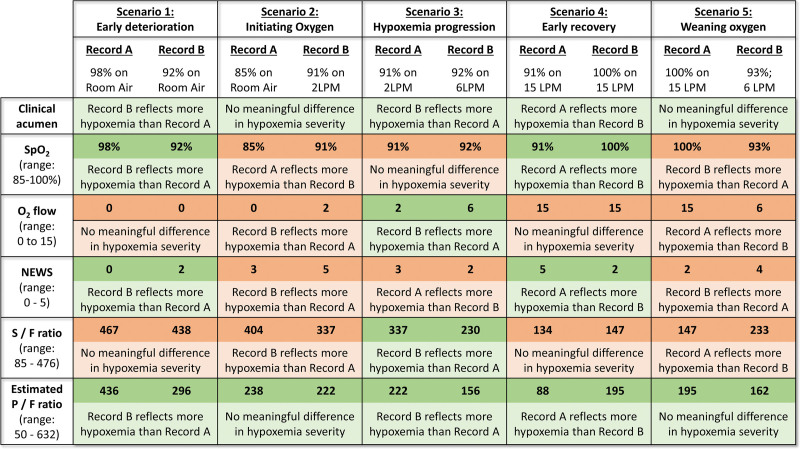
Progressive hypoxemia is the predominant mode of deterioration in COVID-19. Among hypoxemia measures, the ratio of the Pao2 to the Fio2 (P/F ratio) has optimal construct validity but poor availability because it requires arterial blood sampling. Pulse oximetry reports oxygenation continuously (ratio of the Spo2 to the Fio2 [S/F ratio]), but it is affected by skin color and occult hypoxemia can occur in Black patients. Oxygen dissociation curves allow noninvasive estimation of P/F ratios (ePFRs) but remain unproven.

Objectives: Measure overt and occult hypoxemia using ePFR.

Design setting and participants: We retrospectively studied COVID-19 hospital encounters (n = 5,319) at two academic centers (University of Virginia [UVA] and Emory University).

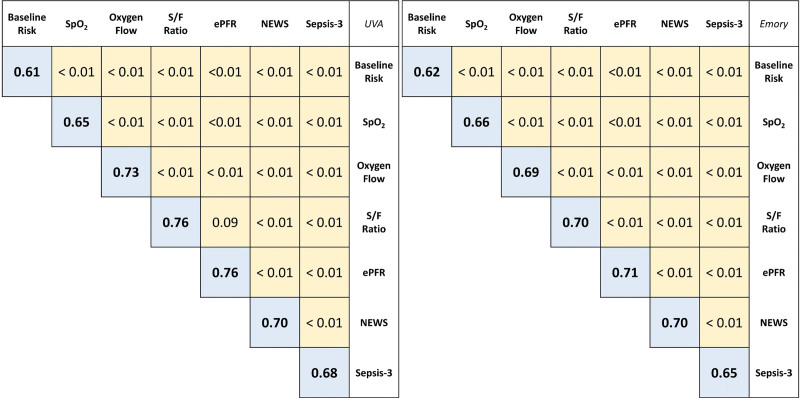
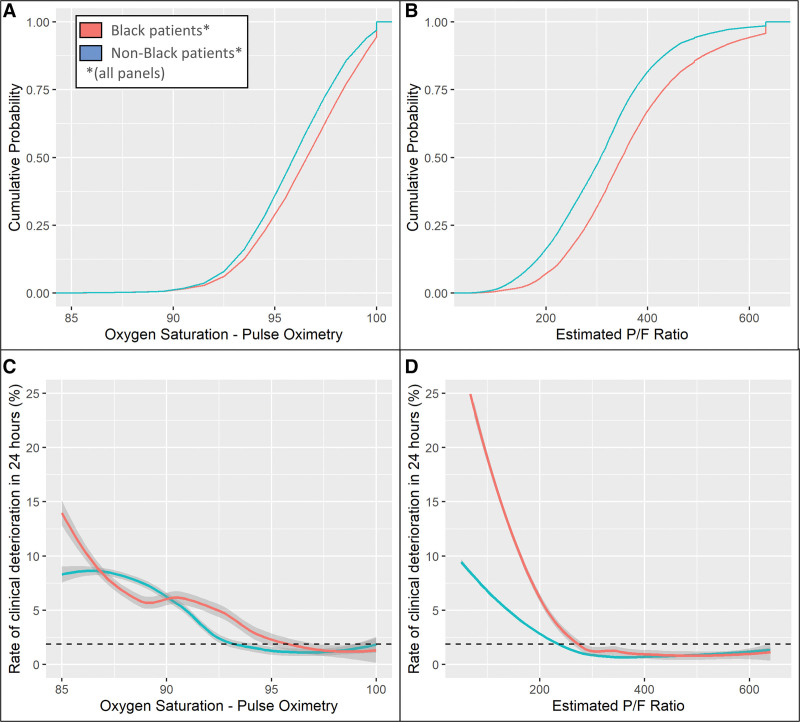
Main outcomes and measures: We measured primary outcomes (death or ICU transfer within 24 hr), ePFR, conventional hypoxemia measures, baseline predictors (age, sex, race, comorbidity), and acute predictors (National Early Warning Score [NEWS] and Sequential Organ Failure Assessment [SOFA]). We updated predictors every 15 minutes. We assessed predictive validity using adjusted odds ratios (AORs) and area under the receiver operating characteristic curves (AUROCs). We quantified disparities (Black vs non-Black) in empirical cumulative distributions using the Kolmogorov-Smirnov (K-S) two-sample test.

Results: Overt hypoxemia (low ePFR) predicted bad outcomes (AOR for a 100-point ePFR drop: 2.7 [UVA]; 1.7 [Emory]; p < 0.01) with better discrimination (AUROC: 0.76 [UVA]; 0.71 [Emory]) than NEWS (0.70 [both sites]) or SOFA (0.68 [UVA]; 0.65 [Emory]) and similar to S/F ratio (0.76 [UVA]; 0.70 [Emory]). We found racial differences consistent with occult hypoxemia. Black patients had better apparent oxygenation (K-S distance: 0.17 [both sites]; p < 0.01) but, for comparable ePFRs, worse outcomes than other patients (AOR: 2.2 [UVA]; 1.2 [Emory]; p < 0.01).

Conclusions and relevance: The ePFR was a valid measure of overt hypoxemia. In COVID-19, it may outperform multi-organ dysfunction models. By accounting for biased oximetry as well as clinicians' real-time responses to it (supplemental oxygen adjustment), ePFRs may reveal racial disparities attributable to occult hypoxemia.

Keywords: COVID-19; hospital mortality; organ dysfunction scores; prognosis; respiratory failure.


Conflict of interest statement

Dr. Moore is supported by the National Institutes of Health (U01AI150508). Dr. Holder is supported by the National Institutes of Health (K23GM37182), and he has received speaker and consulting fees from Baxter International and Philips, respectively. Dr. Kamaleswaran was supported by the National Institutes of Health (R01GM139967). Dr. Clark is an employee of Nihon Kohden Digital Health Solutions (Irvine, CA). Dr. Moorman has equity in Medical Predictive Science Corporation, Charlottesville, VA, and consults for Nihon Kohden Digital Health Solutions, Irvine, CA, with proceeds donated to the University of Virginia Medical Foundation. The remaining authors have disclosed that they do not have any potential conflicts of interest.

Figures

Figure 1.
Figure 1.
Evaluation of the construct validity of operational markers of hypoxemia in hypothetical clinical scenarios. Construct validity of any marker of hypoxemia is the extent to which that marker accurately reflects the clinical construct of hypoxemia. This figure examines the construct validity of five operational markers of hypoxemia (rows) in common clinical scenarios (columns). In each scenario (column), two records of a patient’s oxygenation are compared (record A on left, record B on right). The first row titled “clinical acumen” describes a clinically sensible conclusion that a clinician might draw by comparing the two records. For example, in scenario 2, a clinician will likely conclude that the two records do not represent any meaningful change in the severity of hypoxemic respiratory failure (row 1, column 2). Rather, record B (oxygen saturation from pulse oximetry [Spo2] of 91% on 2 L/min [LPM] of oxygen) might simply reflect the fact that a clinician initiated supplemental oxygen in response to record A (Spo2 of 85% on room air). Each of the subsequent rows describes the conclusion based solely on comparing a particular marker of hypoxemia. For example, if one solely compared Spo2 in scenario 2 (row 2, column 2), the conclusion would be that record A reflects significantly more severe hypoxemia than record B (Spo2 of 85% vs 91%). Considering the varying range of each marker, we used the following cutoffs to determine a “significantly more/less hypoxemia”: any difference greater than or equal to 1 for National Early Warning Score (NEWS) (range, 0–5), any difference greater than or equal to 2 for Spo2 (range, 85–100) and supplemental oxygen flow rate (range, 0–15 LPM), and any difference greater than or equal to 50 for ratio of Spo2/Fio2 (S/F ratio) (range, 85–476) and ratio of Pao2/Fio2 (P/F ratio) (range, 50–632). A cell is shaded green when there is agreement between the marker of hypoxemia and clinical acumen, and it is shaded red when there is disagreement. This figure illustrates the advantages of estimated P/F ratios over other markers—it is the only marker to agree with clinical acumen in all scenarios. We were unable to conceptualize any scenario where P/F ratio would be inferior to other markers.
Figure 2.
Figure 2.
Discrimination of estimated ratio of Pao2/Fio2 (P/F ratio) for clinical deterioration in patients with COVID-19. This figure compares the area under the receiver operating characteristic curve (AUROC) of multivariable logistic regression models for clinical deterioration (transfer to ICU or mortality within 24 hr) from COVID-19. The blue boxes show the AUROC for a model and the yellow boxes show p values from pairwise comparison (DeLong test). Results from University of Virginia (UVA) are on the left and those from Emory are on the right. The baseline risk model used age, sex, race, Charlson Comorbidity Index, and preinfection baseline Sequential Organ Failure Assessment (SOFA) score as predictors (baseline SOFA was only available at UVA). The model for each criterion was created by adding that criterion to the baseline risk predictors. The estimated P/F ratio (ePFR) had optimal model discrimination, and it outperformed National Early Warning Score (NEWS) and SOFA (acute rise in SOFA score at UVA and total SOFA in Emory) models. S/F ratio = ratio of oxygen saturation from pulse oximetry/Fio2, Spo2 = oxygen saturation from pulse oximetry.
Figure 3.
Figure 3.
Characterizing the impact of racially biased pulse oximetry measurements. A and B, Empirical cumulative distribution functions (ECDFs) for oxygen saturation from pulse oximetry (Spo2) and estimated Pao2/Fio2 ratio (ePFR), respectively. This figure depicts the results from University of Virginia. Corresponding results from Emory are shown in eFigure 2 (http://links.lww.com/CCX/B110). Race is encoded by color (red—Black patients, blue—others). The separation in Spo2 distributions was narrow (being minimal at Spo2 < 92%), suggesting an equitable clinician effort to prevent oxygen desaturation. Yet, the separation in the ePFR distribution was wide at all values. This suggests that, on average, clinicians were achieving their Spo2 targets with lower Fio2 settings in Black patients (eFig. 4, http://links.lww.com/CCX/B110). For comparable ePFR values, outcomes were worse for Black patients than others (D). Together, these findings reveal that clinicians were likely undertreating hypoxemia due to an overestimation of Spo2. Significantly, this disparity remained undetected when the Spo2 was studied (C) instead of ePFR (D). To make the plots directly comparable despite the varying scales of the hypoxemia measures, we used Spo2 values ranging from 85% to 100% and the corresponding range from a minimum ePFR of 50 (representing a Spo2 of 85% on 100% Fio2) to a maximum ePFR of 633 (representing a Spo2 of 100% on room air). To smoothen the ECDFs, we converted Spo2 from integer to continuous by adding uniformly distributed noise (± 0.5% with a maximum Spo2 of 100%). To calculate the rate of clinical deterioration at a particular level, we used a window centered at that level with width equal to one sd (2.5 for Spo2 and 120 for ePFR). The dashed horizontal lines (C and D) mark the rate of clinical deterioration in the entire dataset (1.85%). P/F ratio = ratio of Pao2/Fio2.

Update of

References

    1. Gupta RK, Marks M, Samuels THA, et al. ; UCLH COVID-19 Reporting Group: Systematic evaluation and external validation of 22 prognostic models among hospitalised adults with COVID-19: An observational cohort study. Eur Respir J 2020; 56:2003498. - PMC - PubMed
    1. Wynants L, Calster BV, Collins GS, et al. : Prediction models for diagnosis and prognosis of Covid-19: Systematic review and critical appraisal. BMJ 2020; 369:m1328. - PMC - PubMed
    1. Knight SR, Ho A, Pius R, et al. ; ISARIC4C investigators: Risk stratification of patients admitted to hospital with Covid-19 using the ISARIC WHO Clinical Characterisation Protocol: Development and validation of the 4C Mortality Score. BMJ 2020; 370:m3339. - PMC - PubMed
    1. Liang W, Liang H, Ou L, et al. : Development and validation of a clinical risk score to predict the occurrence of critical illness in hospitalized patients with COVID-19. JAMA Intern Med 2020; 180:1081–1089 - PMC - PubMed
    1. Gerotziafas GT, Sergentanis TN, Voiriot G, et al. : Derivation and validation of a predictive score for disease worsening in patients with COVID-19. Thromb Haemost 2020; 120:1680–1690 - PMC - PubMed