

Screening and identification of potential hub genes and immune cell infiltration in the synovial tissue of rheumatoid arthritis by bioinformatic approach
- PMID: 36699262
- PMCID: PMC9868484
- DOI: 10.1016/j.heliyon.2023.e12799
Screening and identification of potential hub genes and immune cell infiltration in the synovial tissue of rheumatoid arthritis by bioinformatic approach
Abstract
Background: Rheumatoid arthritis (RA) is an autoimmune disease that affects individuals of all ages. The basic pathological manifestations are synovial inflammation, pannus formation, and erosion of articular cartilage, bone destruction will eventually lead to joint deformities and loss of function. However, the specific molecular mechanisms of synovitis tissue in RA are still unclear. Therefore, this study aimed to screen and explore the potential hub genes and immune cell infiltration in RA.
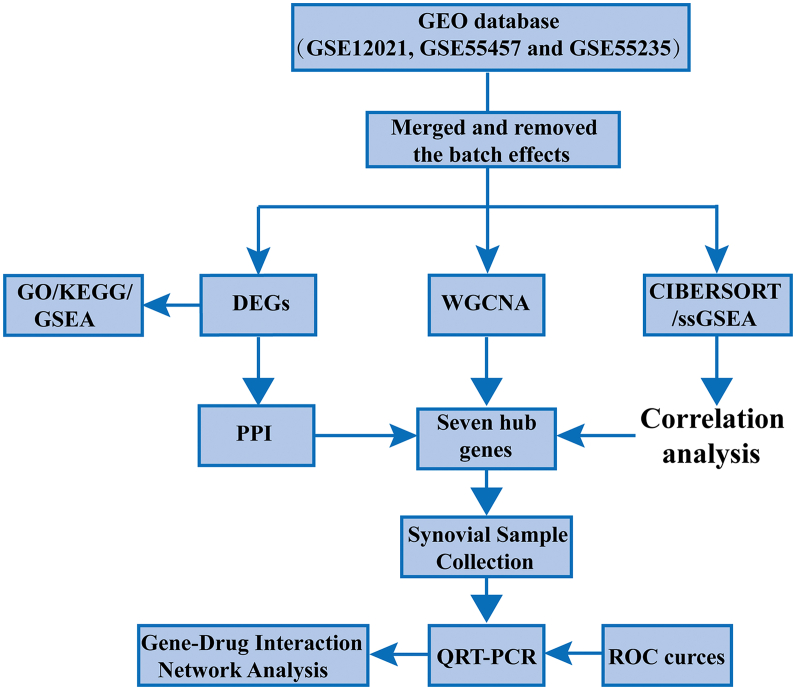
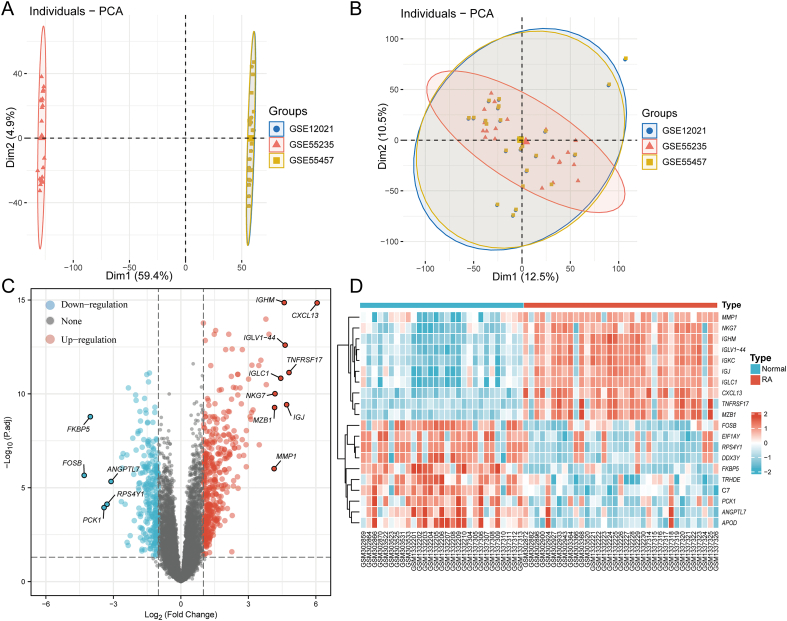
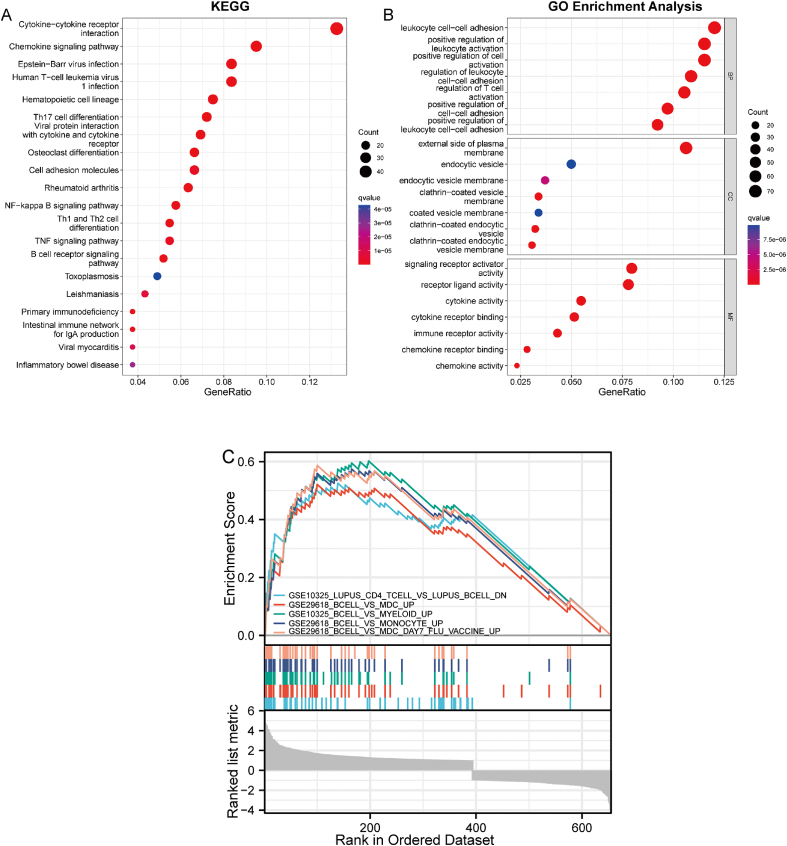
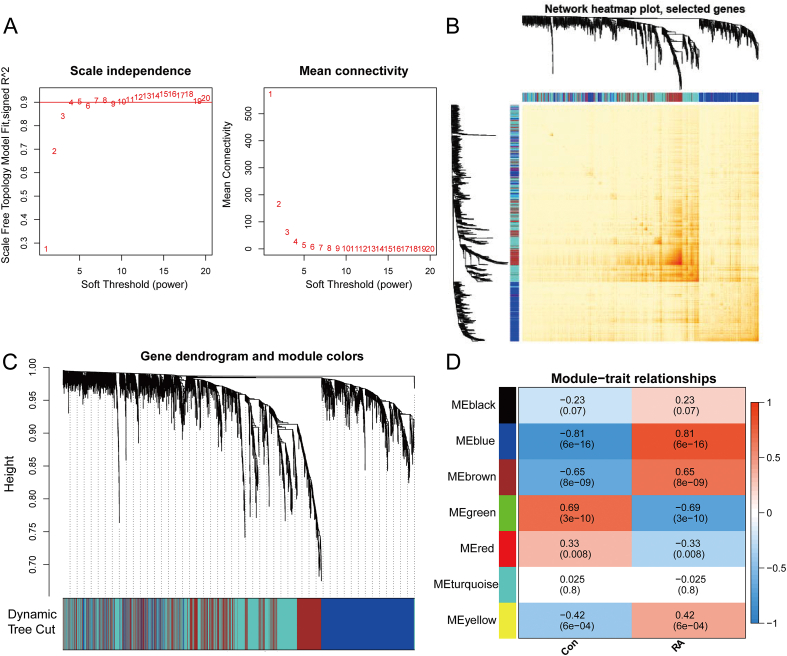
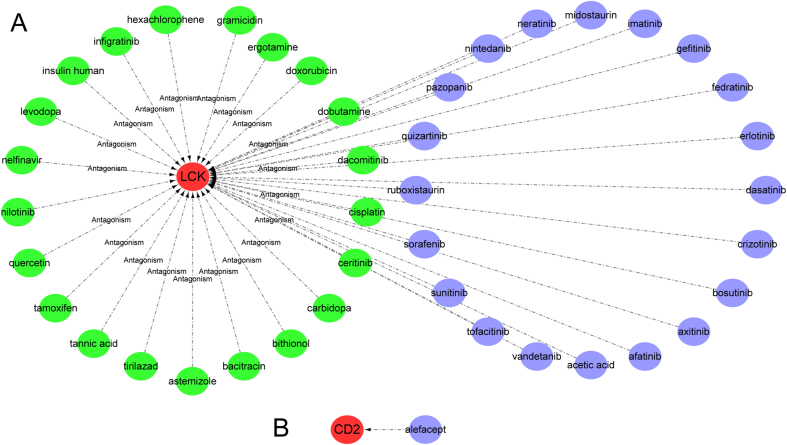
Methods: Three microarray datasets (GSE12021, GSE55457, and GSE55235), from the Gene Expression Omnibus (GEO) database, have been analyzed to explore the potential hub genes and immune cell infiltration in RA. First, the LIMMA package was used to screen the differentially expression genes (DEGs) after removing the batch effect. Then the clusterProfiler package was used to perform functional enrichment analyses. Second, through weighted coexpression network analysis (WGCNA), the key module was identified in the coexpression network of the gene set. Third, the protein-protein interaction (PPI) network was constructed through STRING website and the module analysis was performed using Cytoscape software. Fourth, the CIBERSORT and ssGSEA algorithm were used to analyze the immune status of RA and healthy synovial tissue, and the associations between immune cell infiltration and RA-related diagnostic biomarkers were evaluated. Fifth, we used the quantitative reverse transcription-polymerase chain reaction (qRT-PCR) to validate the expression levels of the hub genes, and ROC curve analysis of hub genes for discriminating between RA and healthy tissue. Finally, the gene-drug interaction network was constructed using DrugCentral database, and identification of drug molecules based on hub genes using the Drug Signature Database (DSigDB) by Enrichr.
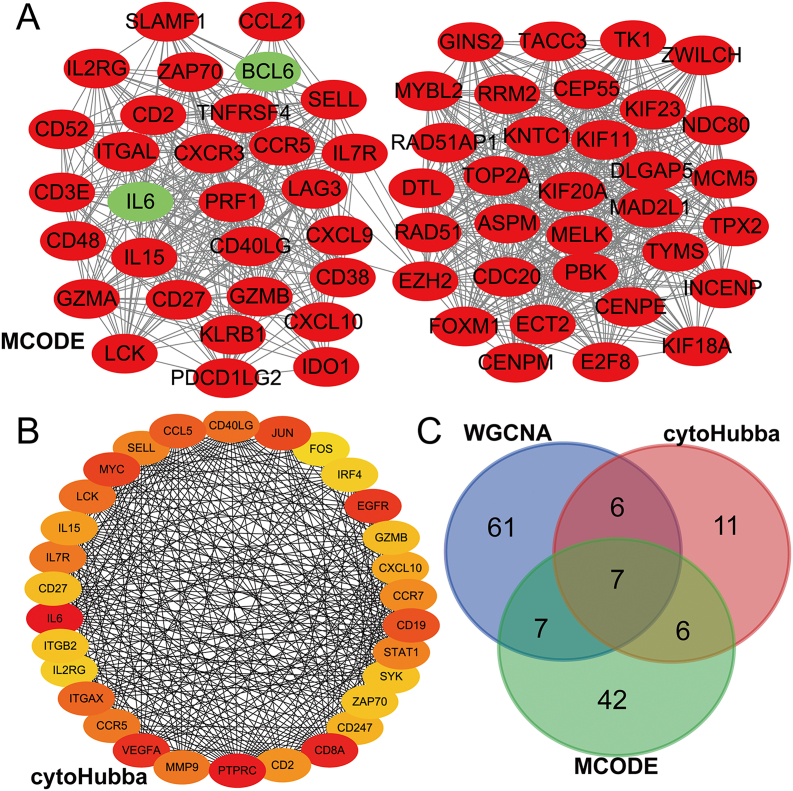
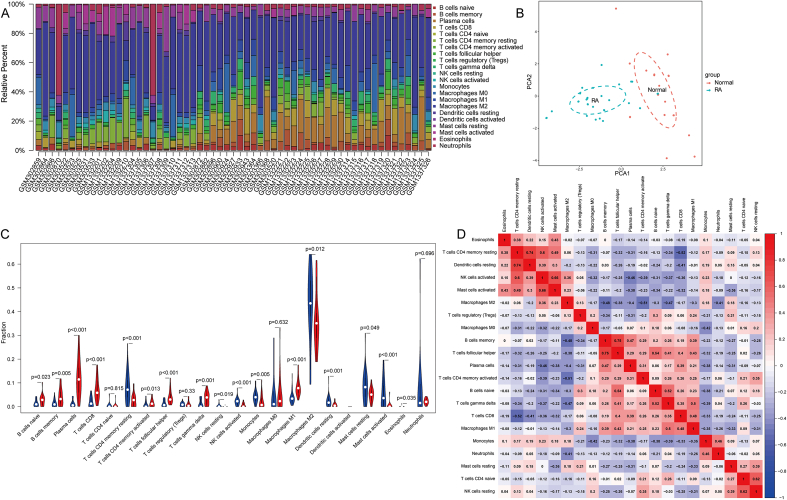
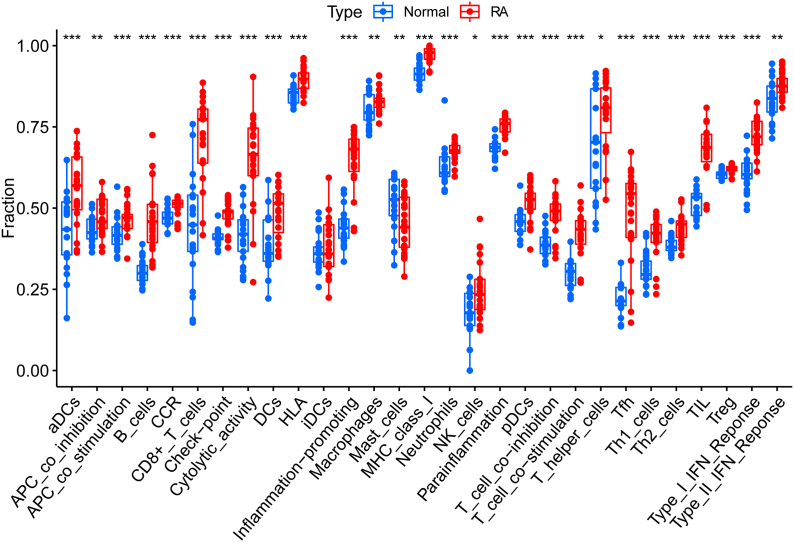
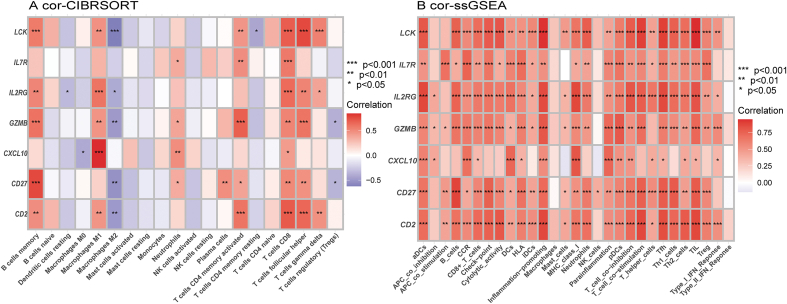
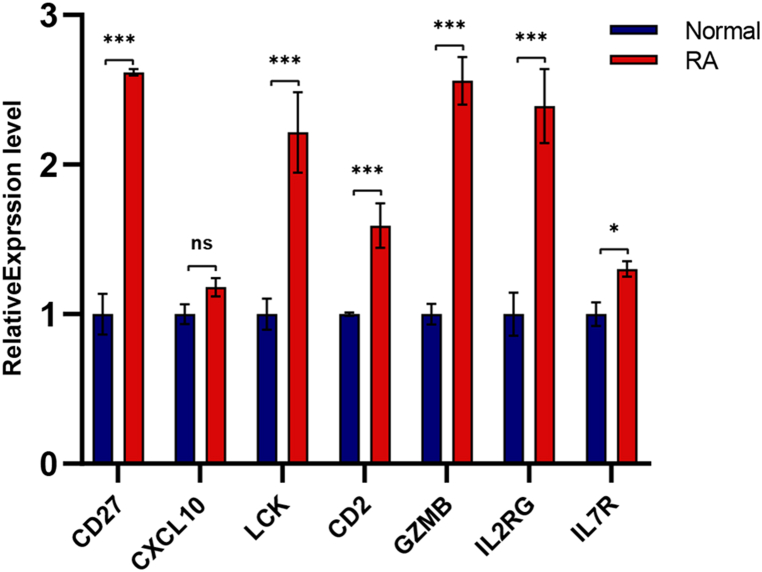
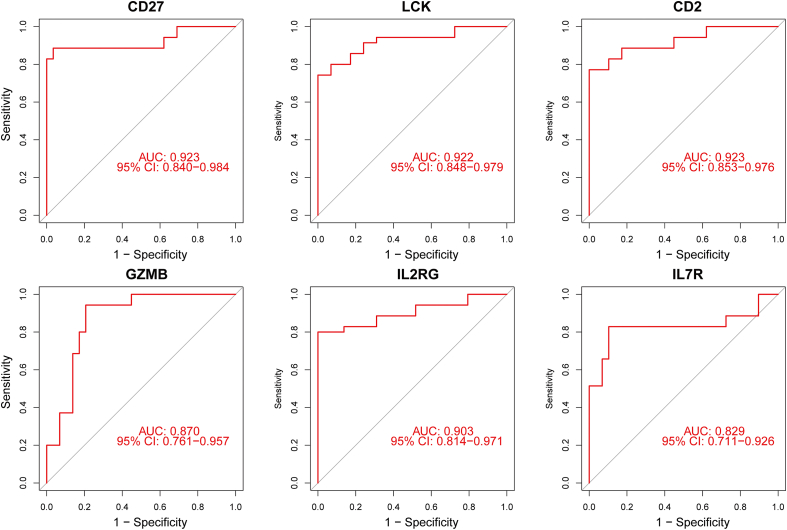
Results: A total of 679 DEGs were identified, containing 270 downregulated genes and 409 upregulated genes. DEGs were primarily enriched in immune response and chemokine signaling pathways, according to functional enrichment analysis of DEGs. WGCNA explored the co-expression network of the gene set and identified key modules, the blue module was selected as the key module associated with RA. Seven hub genes are identified when PPI network and WGCNA core modules are intersected. Immune infiltration analysis using CIBERSORT and ssGSEA algorithms revealed that multiple types of immune infiltration were found to be upregulated in RA tissue compared to normal tissue. Furthermore, the levels of 7 hub genes were closely related to the relative proportions of multiple immune cells in RA. The results of the qRT-PCR demonstrated that the relative expression levels of 6 hub genes (CD27, LCK, CD2, GZMB, IL7R, and IL2RG) were up-regulated in RA synovial tissue, compared with normal tissue. Simultaneously, ROC curves indicated that the above 6 hub genes had strong biomarker potential for RA (AUC >0.8).
Conclusions: Through bioinformatics analysis and qRT-PCR experiment, our study ultimately discovered 6 hub genes (CD27, LCK, CD2, GZMB, IL7R, and IL2RG) that closely related to RA. These findings may provide valuable direction for future RA clinical diagnosis, treatment, and associated research.
Keywords: Bioinformatics approach; Hub genes; Immune infiltration; Rheumatoid arthritis; WGCNA.
© 2023 The Authors.
Conflict of interest statement
The authors claim to have no conflicts of interest.
Figures

Similar articles
-
Identification of Disease-Specific Hub Biomarkers and Immune Infiltration in Osteoarthritis and Rheumatoid Arthritis Synovial Tissues by Bioinformatics Analysis.Dis Markers. 2021 May 17;2021:9911184. doi: 10.1155/2021/9911184. eCollection 2021. Dis Markers. 2021. PMID: 34113405 Free PMC article.
-
Exploration and Identification of Potential Biomarkers and Immune Cell Infiltration Analysis in Synovial Tissue of Rheumatoid Arthritis.Int J Rheum Dis. 2025 Feb;28(2):e70137. doi: 10.1111/1756-185X.70137. Int J Rheum Dis. 2025. PMID: 39953769
-
Identification of key biomarkers and immune infiltration in the synovial tissue of osteoarthritis by bioinformatics analysis.PeerJ. 2020 Jan 17;8:e8390. doi: 10.7717/peerj.8390. eCollection 2020. PeerJ. 2020. PMID: 31988808 Free PMC article.
-
Identification of oxidative stress-related diagnostic markers and immune infiltration features for idiopathic pulmonary fibrosis by bibliometrics and bioinformatics.Front Med (Lausanne). 2024 Aug 6;11:1356825. doi: 10.3389/fmed.2024.1356825. eCollection 2024. Front Med (Lausanne). 2024. PMID: 39165378 Free PMC article. Review.
-
Identification of potential genes associated with metastasis in osteosarcoma: an integrated bioinformatics analysis.Musculoskelet Surg. 2025 Feb 25. doi: 10.1007/s12306-025-00891-z. Online ahead of print. Musculoskelet Surg. 2025. PMID: 40000579 Review.
Cited by
-
Identification and validation of immune-related genes in osteoarthritic synovial fibroblasts.Heliyon. 2024 Mar 24;10(7):e28330. doi: 10.1016/j.heliyon.2024.e28330. eCollection 2024 Apr 15. Heliyon. 2024. PMID: 38571590 Free PMC article.
-
The SELP, CD93, IL2RG, and VAV1 Genes Associated with Atherosclerosis May Be Potential Diagnostic Biomarkers for Psoriasis.J Inflamm Res. 2023 Feb 27;16:827-843. doi: 10.2147/JIR.S398862. eCollection 2023. J Inflamm Res. 2023. PMID: 36876153 Free PMC article.
-
The combination of modified acupuncture needle and melittin hydrogel as a novel therapeutic approach for rheumatoid arthritis treatment.J Nanobiotechnology. 2024 Jul 22;22(1):432. doi: 10.1186/s12951-024-02722-y. J Nanobiotechnology. 2024. PMID: 39034393 Free PMC article.
-
Granzyme B PET Imaging for Assessment of Disease Activity in Inflammatory Bowel Disease.J Nucl Med. 2024 Jul 1;65(7):1137-1143. doi: 10.2967/jnumed.123.267344. J Nucl Med. 2024. PMID: 38754959 Free PMC article.
-
Genetic insights into the connection between pulmonary TB and non-communicable diseases: An integrated analysis of shared genes and potential treatment targets.PLoS One. 2024 Oct 21;19(10):e0312072. doi: 10.1371/journal.pone.0312072. eCollection 2024. PLoS One. 2024. PMID: 39432502 Free PMC article.
References
-
- Iwamoto T., et al. Molecular aspects of rheumatoid arthritis: chemokines in the joints of patients. FEBS J. 2008;275(18):4448–4455. - PubMed
-
- Burmester G.R., et al. Mononuclear phagocytes and rheumatoid synovitis. Mastermind or workhorse in arthritis? Arthritis Rheum. 1997;40(1):5–18. - PubMed
-
- Sack U., Stiehl P., Geiler G. Distribution of macrophages in rheumatoid synovial membrane and its association with basic activity. Rheumatol. Int. 1994;13(5):181–186. - PubMed
LinkOut - more resources
Full Text Sources
Research Materials
Miscellaneous
