. 2022 Feb 15;2(1):vbac011.
doi: 10.1093/bioadv/vbac011. eCollection 2022.

scMoC: single-cell multi-omics clustering

Affiliations

scMoC: single-cell multi-omics clustering

Mostafa Eltager et al. Bioinform Adv. .

Abstract

Motivation: Single-cell multi-omics assays simultaneously measure different molecular features from the same cell. A key question is how to benefit from the complementary data available and perform cross-modal clustering of cells.

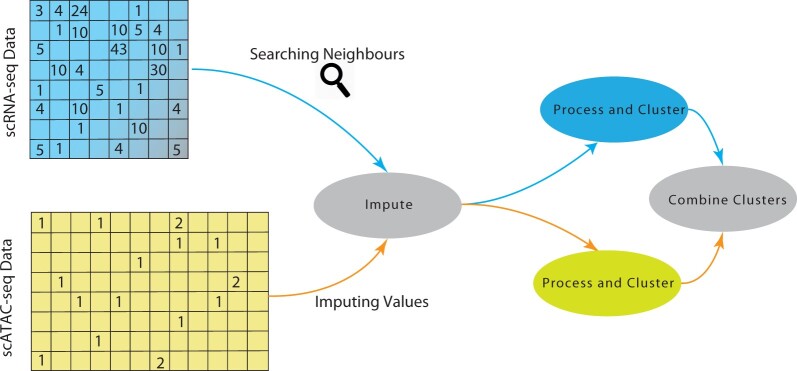
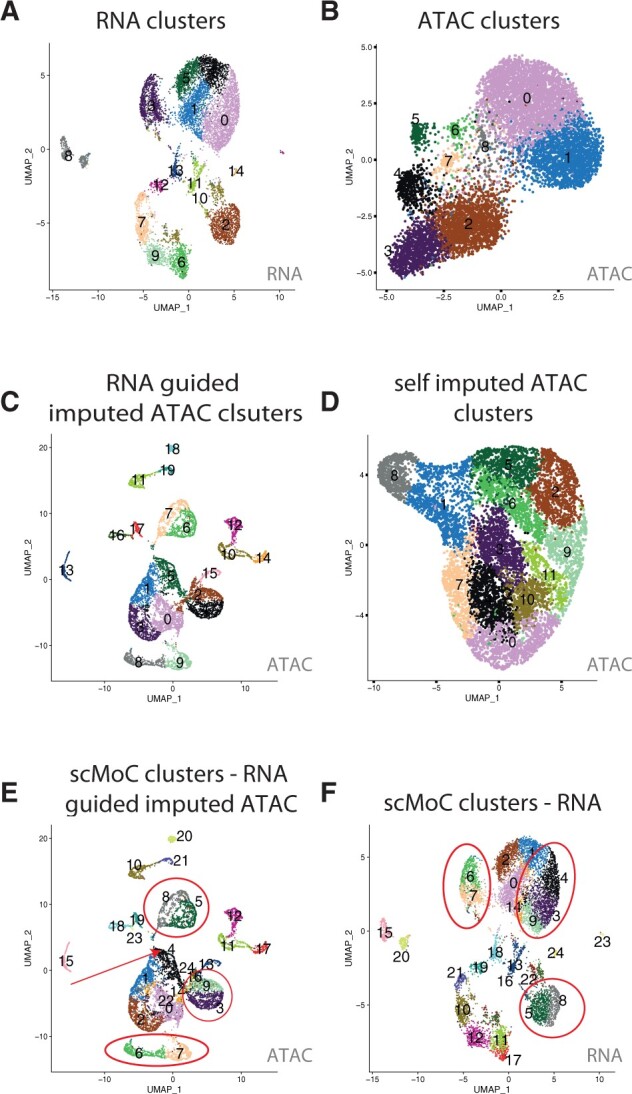
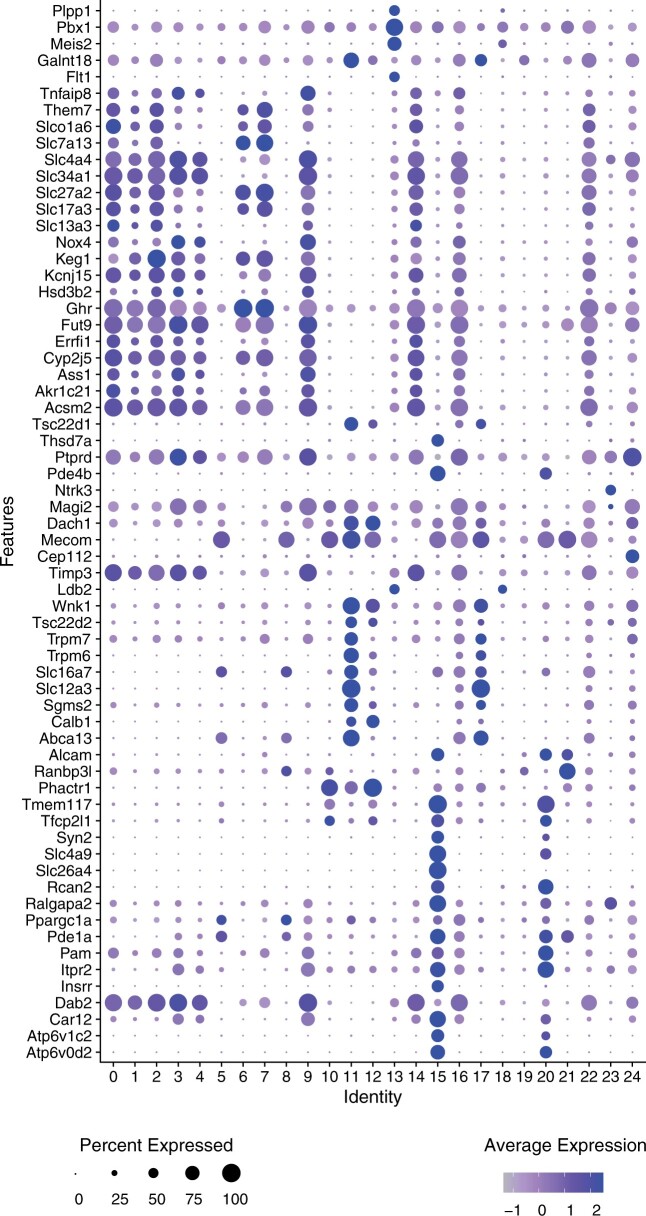
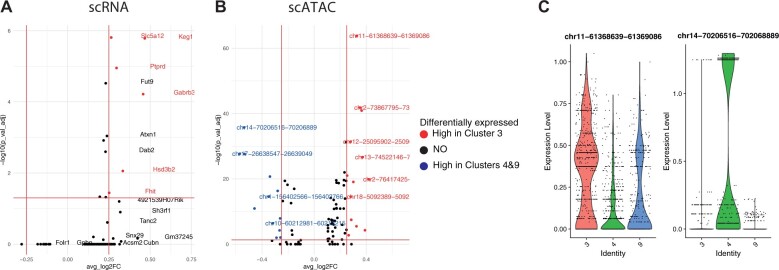
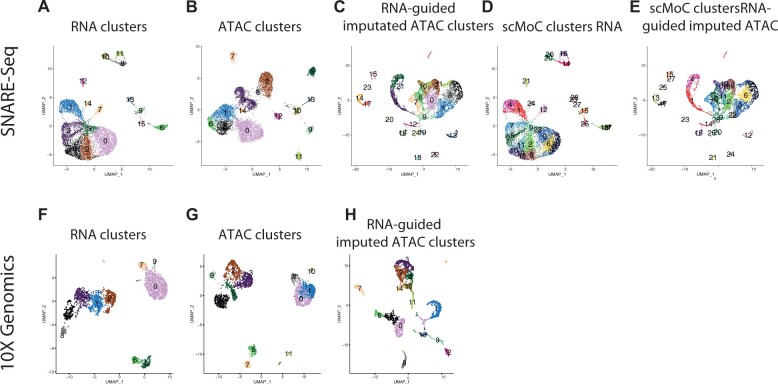
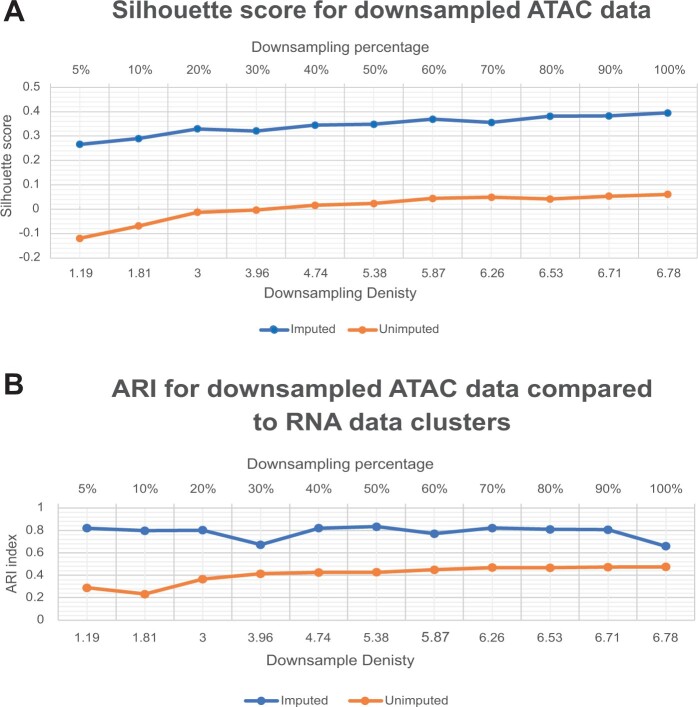
Results: We propose Single-Cell Multi-omics Clustering (scMoC), an approach to identify cell clusters from data with comeasurements of scRNA-seq and scATAC-seq from the same cell. We overcome the high sparsity of the scATAC-seq data by using an imputation strategy that exploits the less-sparse scRNA-seq data available from the same cell. Subsequently, scMoC identifies clusters of cells by merging clusterings derived from both data domains individually. We tested scMoC on datasets generated using different protocols with variable data sparsity levels. We show that scMoC (i) is able to generate informative scATAC-seq data due to its RNA-guided imputation strategy and (ii) results in integrated clusters based on both RNA and ATAC information that are biologically meaningful either from the RNA or from the ATAC perspective.

Availability and implementation: The data used in this manuscript is publicly available, and we refer to the original manuscript for their description and availability. For convience sci-CAR data is available at NCBI GEO under the accession number of GSE117089. SNARE-seq data is available at NCBI GEO under the accession number of GSE126074. The 10X multiome data is available at the following link https://www.10xgenomics.com/resources/datasets/pbmc-from-a-healthy-donor-no-cell-sorting-3-k-1-standard-2-0-0.

Supplementary information: Supplementary data are available at Bioinformatics Advances online.


Figures

Fig. 1.
Fig. 1.
Schematic overview of scMoC. scMoC clusters multimodal single-cell data based on scRNA-seq and scATAC-seq measurements from the same cell. It encompasses an RNA-guided imputation strategy to leverage the higher data sparsity of the scRNA-seq data (with respect to the scATAC-seq data). scMoC builds on the idea that cell–cell similarities can be better estimated from the RNA profiles and then used to define a neighborhood to impute from it the ATAC data, since these are comeasured from the same cell. After the imputation, the two modalities are clustered individually and then combined into one clustering in which RNA-based clusters are being split if there is enough evidence from the ATAC data
Fig. 2.
Fig. 2.
scMoC shows different cluster in the scRNA-seq data based on the imputed scATAC-seq data. UMAP visualizations of the sci-CAR. (A) scRNA-seq data, colors indicating RNA-based clusters. (B) scATAC-seq data, colors indicating ATAC-based clusters. (C) RNA-guided imputed scATAC-seq data, colors indicating clusters within the imputed data. (D) Self-imputed scATAC-seq data, colors indicating clusters detected in these data. (E) RNA-guided imputed scATAC-seq data using the scMoC clusters. (F) scRNA-seq data using the scMoC clusters. Clusters in both E and F are named and colored identically according to scMoC clusters
Fig. 3.
Fig. 3.
scMoC clusters marker genes. Dot plot showing the DE genes (i.e. markers) of the scMoC clusters. Expression of a set of Mouse kidney marker genes across scMoC clusters. The color intensity of the dot represents the average expression of the gene across the cells in the cluster and the size relates to the percentage of cells within the cluster expressing each gene
Fig. 4.
Fig. 4.
DE genes and differentially accessible peaks for ATAC induced splits. Volcano plots showing (A) DE scRNA genes, and (B) differentially accessible scATAC peaks between scMoC cluster 3 versus scMoC clusters 4&9. (C) Violin plot for the top upregulated peak (i.e. chr11-61368639-61369086) and top downregulated peak (i.e. chr14-70206516-70206889)
Fig. 5.
Fig. 5.
Applying scMoC to SNARE-seq and 10X genomics multiome data. UMAP visulation for SNARE-seq and 10X genmics multiome data. (A) SNARE-seq scRNA-seq data, colors indicating the RNA-based clusters. (B) SNARE-seq scATAC-seq data, colors indicating ATAC-based clusters. (C) RNA-guided imputed SNARE-seq scATAC-seq data, colors indicating clusters within the imputed data clustered independently. (D) SNARE-seq scRNA-seq data colored according to the scMoC clusters. (E) RNA-guided imputed scATAC-seq data colored according to the scMoC clusters. (F) 10X genomics multiome scRNA-seq data. (G) 10X genomics multiome scATAC-seq data. (H) RNA-guided imputed 10X genomics scATAC-seq data
Fig. 6.
Fig. 6.
Defining the benefiting limits of RNA-guided imputation in scMoC. (A) Silhouette score for downsampled scATAC-seq data. Measuring the Silhouette score for the resultant scMoC clusters for RNA-guided imputed and unimputed downsampled scATAC to simulate variable data densities. (B) ARI for downsampled ATAC data compared to the clusters generated from the full RNA data. It measures the consistency between the RNA clusters versus the ATAC either RNA-guided imputed or unimputed data

References

    1. Baek S., Lee I. (2020) Single-cell ATAC sequencing analysis: from data preprocessing to hypothesis generation. Comput. Struct. Biotechnol. J., 18, 1429–1439. - PMC - PubMed
    1. Blondel V.D. et al. (2008) Fast unfolding of communities in large networks. J. Stat. Mech. Theory Exp., 2008, P10008.
    1. Bossone S.A. et al. (1992) MAZ, a zinc finger protein, binds to c-MYC and C2 gene sequences regulating transcriptional initiation and termination. Proc. Natl. Acad. Sci. USA, 89, 7452–7456. - PMC - PubMed
    1. Cao J. et al. (2018) Joint profiling of chromatin accessibility and gene expression in thousands of single cells. Science, 361, 1380–1385. - PMC - PubMed
    1. Chen H. et al. (2019a) Assessment of computational methods for the analysis of single-cell ATAC-seq data. Genome Biol., 20, 1–25. - PMC - PubMed