. 2023 Jan 9:16:1069133.
doi: 10.3389/fnins.2022.1069133. eCollection 2022.

Piecewise quadratic neuron model: A tool for close-to-biology spiking neuronal network simulation on dedicated hardware

Affiliations

Piecewise quadratic neuron model: A tool for close-to-biology spiking neuronal network simulation on dedicated hardware

Takuya Nanami et al. Front Neurosci. .

Abstract

Spiking neuron models simulate neuronal activities and allow us to analyze and reproduce the information processing of the nervous system. However, ionic-conductance models, which can faithfully reproduce neuronal activities, require a huge computational cost, while integral-firing models, which are computationally inexpensive, have some difficulties in reproducing neuronal activities. Here we propose a Piecewise Quadratic Neuron (PQN) model based on a qualitative modeling approach that aims to reproduce only the key dynamics behind neuronal activities. We demonstrate that PQN models can accurately reproduce the responses of ionic-conductance models of major neuronal classes to stimulus inputs of various magnitudes. In addition, the PQN model is designed to support the efficient implementation on digital arithmetic circuits for use as silicon neurons, and we confirm that the PQN model consumes much fewer circuit resources than the ionic-conductance models. This model intends to serve as a tool for building a large-scale closer-to-biology spiking neural network.

Keywords: FPGA; PQN model; silicon neuron; silicon neuronal network; spiking neuron model.


Conflict of interest statement

The authors declare that the research was conducted in the absence of any commercial or financial relationships that could be construed as a potential conflict of interest.

Figures

Figure 1
Figure 1
Phase-resetting curve of spiking neuron models. The horizontal axis represents the phase at which the pulse stimulus was given, and the vertical axis represents how much the phase was shifted by the pulse stimulus.
Figure 2
Figure 2
Block diagram of the PQN engine for the IB and LTS mode. The symbols ×, +, M and C represent multipliers, adders, multiplexers, and comparators, respectively. The v, n, q, u and Istim are input for the PQN engine. The output vnext, nnext, qnext, and unext are values of the state variables at the next time step.
Figure 3
Figure 3
An example of the multiplication of a state variable and a coefficient.
Figure 4
Figure 4
The structure and clock cycle of the PQN unit. (A) The internal structure of the PQN unit. The state variables are stored in the FIFO memory and sent to the PQN engine in turn. (B) The clock cycle of the PQN unit.
Figure 5
Figure 5
PQN model of Class II mode in the Hodgkin's classification. (A) Graded responses to pulse stimuli. Pulse stimuli of various magnitudes were given between 0.1 and 0.102 [s]. (B) Phase changes induced by the pulse stimulus. (C) PRCs of the PQN model and the ionic-conductance model. The horizontal axis represents the phase at which the pulse stimulus was given, and the vertical axis represents how much the phase was shifted by the pulse stimulus.
Figure 6
Figure 6
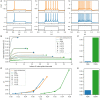
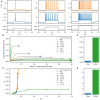
Waveforms and spiking properties in excitatory RS mode. (A) Waveforms of the ionic-conductance model (orange) and the PQN model (blue). Gray lines represent stimulus inputs, whose unit in the ionic-conductance model is nA. In the PQN model, they have no physical unit. (B) The transitions of ISIs are shown while increasing the magnitude of the stimulus input. The horizontal axis represents the index of the ISIs, and the vertical axis represents the magnitude of the ISIs. Orange, blue, and green lines represent the ionic-conductance, PQN, and DSSN models, respectively. Markers were plotted to show the corresponding magnitude of the stimulus input. (C) The mean square errors of the PQN model and the DSSN model with the ionic-conductance model over the data points shown in (B). (D) Values of the CV and LV were calculated from the waveforms and plotted while varying the magnitude of the stimulus inputs. The waveforms used here are the same as that used in (B). (E) The mean square errors of the PQN model and the DSSN model with the ionic-conductance model over the data points shown in (D).
Figure 7
Figure 7
Waveforms and spiking properties in inhibitory RS mode. (A) Waveforms of the ionic-conductance model (orange) and the PQN model (blue). Gray lines represent stimulus inputs. (B) The transitions of ISIs are shown while increasing the magnitude of the stimulus input. (C) The mean square errors of the PQN model and the DSSN model with the ionic-conductance model over the data points shown in (B). (D) Values of the CV and LV were calculated from the waveforms and plotted while varying the magnitude of the stimulus inputs. The waveforms used here are the same as that used in (B). (E) The mean square errors of the PQN model and the DSSN model with the ionic-conductance model over the data points shown in (D).
Figure 8
Figure 8
Waveforms and spiking properties in FS mode. (A) Waveforms of the ionic-conductance model (orange) and the PQN model (blue). Gray lines represent stimulus inputs. (B) The transitions of ISIs are shown while increasing the magnitude of the stimulus input. (C) The mean square errors of the PQN model and the DSSN model with the ionic-conductance model over the data points shown in (B). (D) Values of the CV and LV were calculated from the waveforms and plotted while varying the magnitude of the stimulus inputs. The waveforms used here are the same as that used in (B). (E) The mean square errors of the PQN model and the DSSN model with the ionic-conductance model over the data points shown in (D).
Figure 9
Figure 9
Waveforms and spiking properties in LTS mode. (A) Waveforms of the ionic-conductance model (orange) and the PQN model (blue). Gray lines represent stimulus inputs. (B) The transitions of ISIs are shown while increasing the magnitude of the stimulus input. (C) The mean square errors of the PQN model and the DSSN model with the ionic-conductance model over the data points shown in (B). (D) Values of the CV and LV were calculated from the waveforms and plotted while varying the magnitude of the stimulus inputs. The waveforms used here are the same as that used in (B). (E) The mean square errors of the PQN model and the DSSN model with the ionic-conductance model over the data points shown in (D).
Figure 10
Figure 10
Waveforms and spiking properties in IB mode. (A) Waveforms of the ionic-conductance model (orange) and the PQN model (blue). Gray lines represent stimulus inputs. (B) The transitions of ISIs are shown while increasing the magnitude of the stimulus input. (C) The mean square errors of the PQN model and the DSSN model with the ionic-conductance model over the data points shown in (B). (D) Values of the CV and LV were calculated from the waveforms and plotted while varying the magnitude of the stimulus inputs. The waveforms used here are the same as that used in (B). (E) The mean square errors of the PQN model and the DSSN model with the ionic-conductance model over the data points shown in (D).
Figure 11
Figure 11
Waveforms and spiking properties in EB mode. (A) Waveforms of the ionic-conductance model (orange) and the PQN model (blue). Gray lines represent stimulus inputs. (B) Properties of bursting. The horizontal axis represents the interval between bursts, and the vertical axis represents the number of spikes in a burst. Stimulus inputs were increased by 0.25 from 2.75 to 4.25. (C) The mean square errors of the PQN model and the DSSN model with the ionic-conductance model over the data points shown in (B). (D) Values of the CV and LV were calculated from the waveforms and plotted while varying the magnitude of the stimulus inputs. (E) The mean square errors of the PQN model and the DSSN model with the ionic-conductance model over the data points shown in (D).
Figure 12
Figure 12
Waveforms and spiking properties in PB mode. (A) Waveforms of the ionic-conductance model (orange) and the PQN model (blue). Gray lines represent stimulus inputs. (B) Properties of bursting. The horizontal axis represents the interval between bursts, and the vertical axis represents the number of spikes in a burst. Stimulus inputs were increased by 0.25 from 2.75 to 4.25. (C) The mean square errors of the PQN model and the DSSN model with the ionic-conductance model over the data points shown in (B). (D) Values of the CV and LV were calculated from the waveforms and plotted while varying the magnitude of the stimulus inputs. (E) The mean square errors of the PQN model and the DSSN model with the ionic-conductance model over the data points shown in (D).

Similar articles

Cited by

References

    1. Alle H., Geiger J. R. P. (2006). Combined analog and action potential coding in hippocampal mossy fibers. Science 311, 1290–1293. 10.1126/science.1119055 - DOI - PubMed
    1. Arthur J. V., Boahen K. A. (2011). Silicon-neuron design: a dynamical systems approach. IEEE Trans. Circ. Syst. I 58, 1034–1043. 10.1109/TCSI.2010.2089556 - DOI - PMC - PubMed
    1. Benda J., Longtin A., Maler L. (2005). Spike-frequency adaptation separates transient communication signals from background oscillations. J. Neurosci. 25, 2312–2321. 10.1523/JNEUROSCI.4795-04.2005 - DOI - PMC - PubMed
    1. Bezaire M. J., Raikov I., Burk K., Vyas D., Soltesz I. (2016). Interneuronal mechanisms of hippocampal theta oscillations in a full-scale model of the rodent ca1 circuit. Elife 5, 1–106. 10.7554/eLife.18566 - DOI - PMC - PubMed
    1. Brette R., Gerstner W. (2005). Adaptive exponential integrate-and-fire model as an effective description of neuronal activity. J. Neurophysiol. 94, 3637–3642. 10.1152/jn.00686.2005 - DOI - PubMed

LinkOut - more resources