. 2022 Dec 13;7(1):e10701.
doi: 10.1002/jbm4.10701. eCollection 2023 Jan.

Bone Formation in 2D Culture of Primary Cells

Affiliations

Bone Formation in 2D Culture of Primary Cells

Edward L Mertz et al. JBMR Plus. .

Abstract

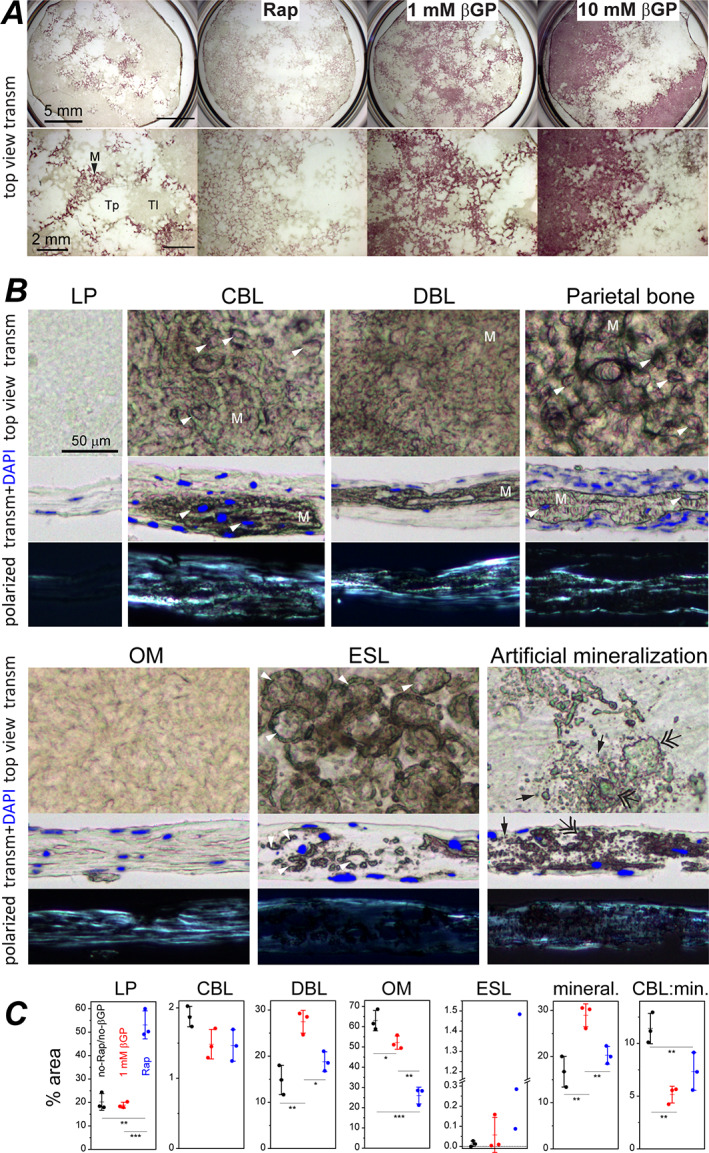
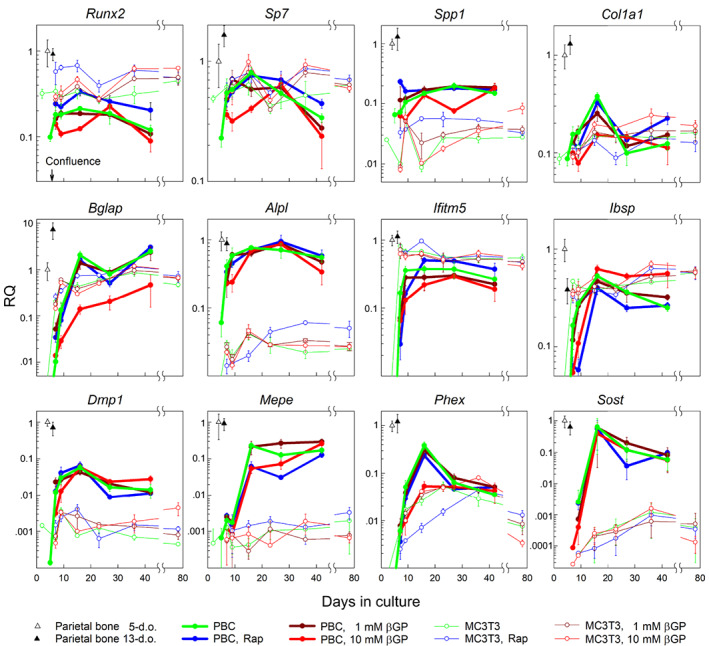
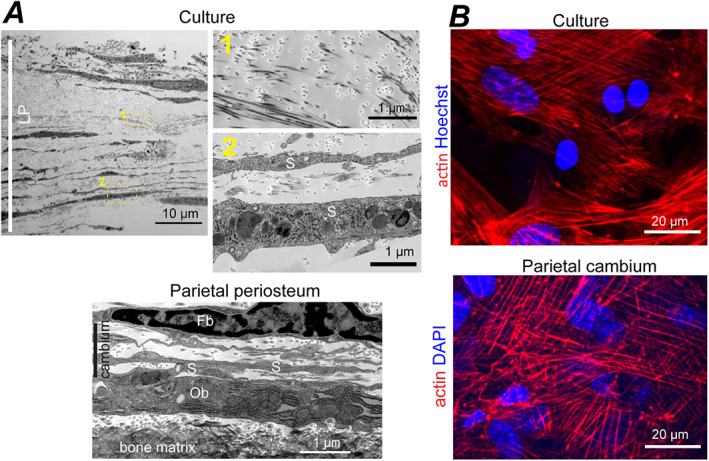
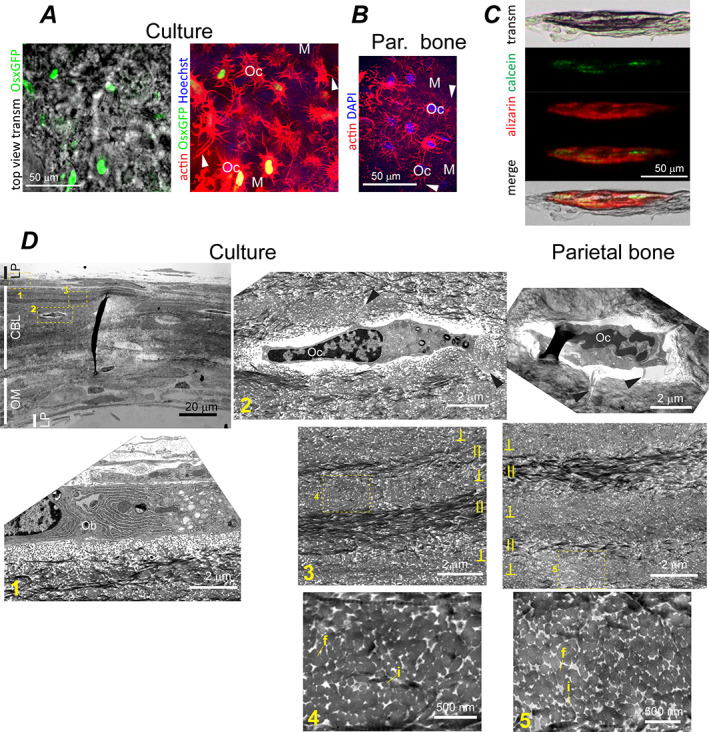
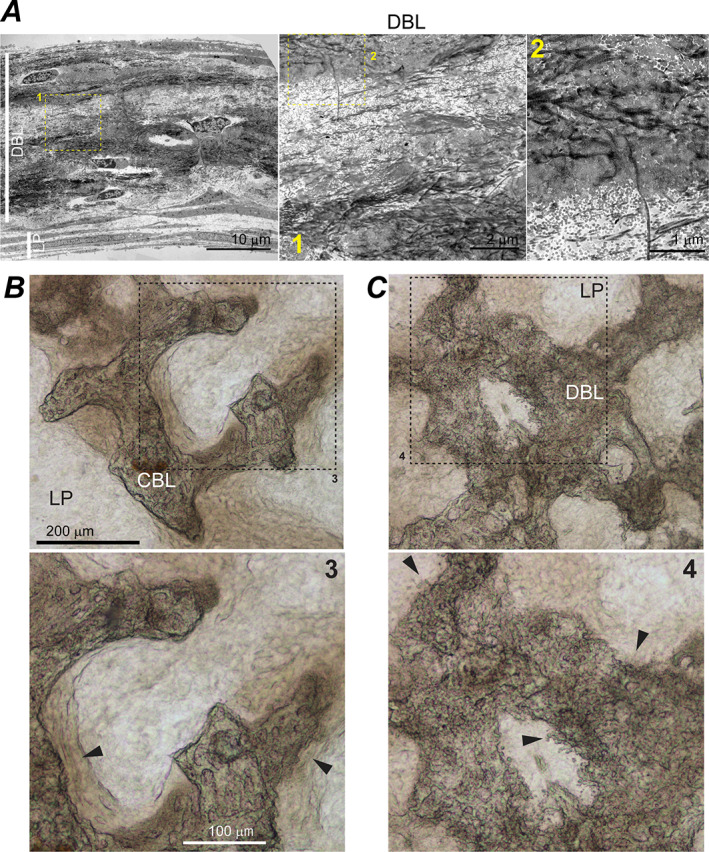
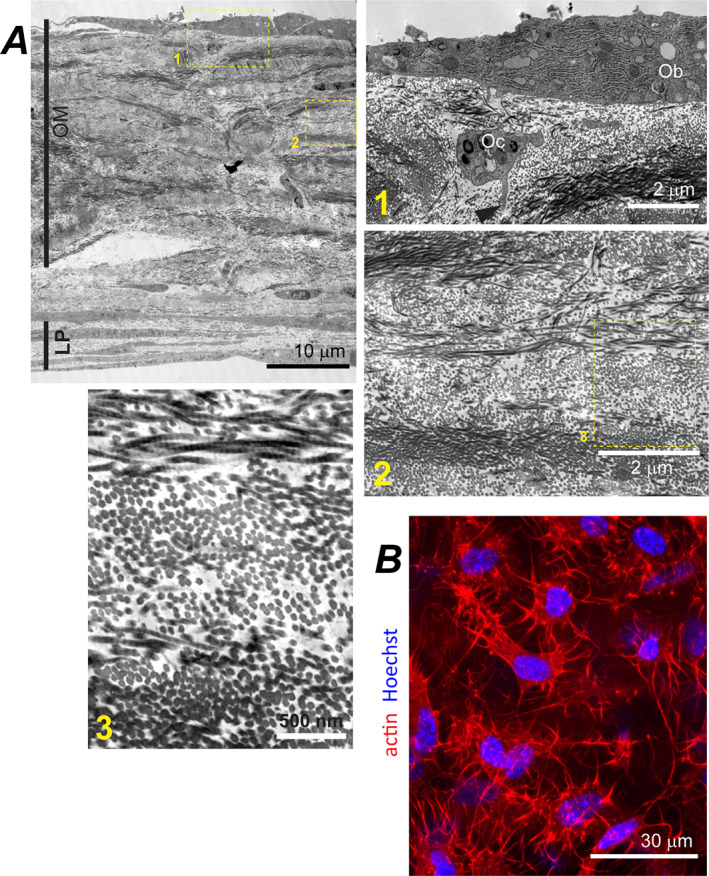
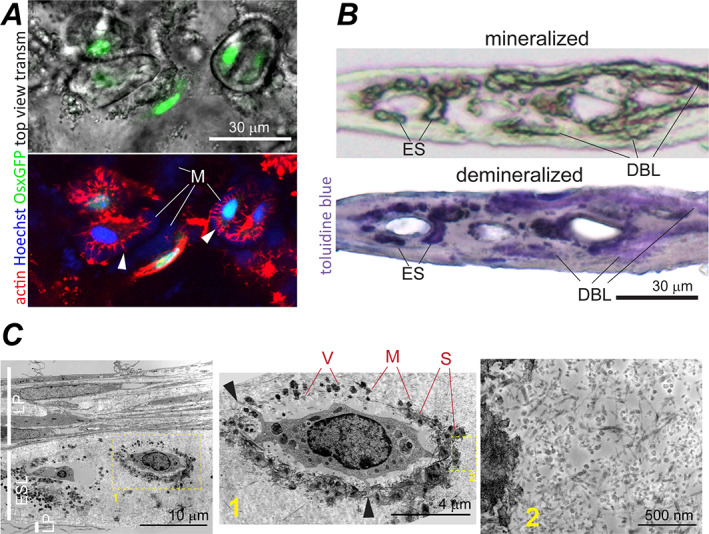
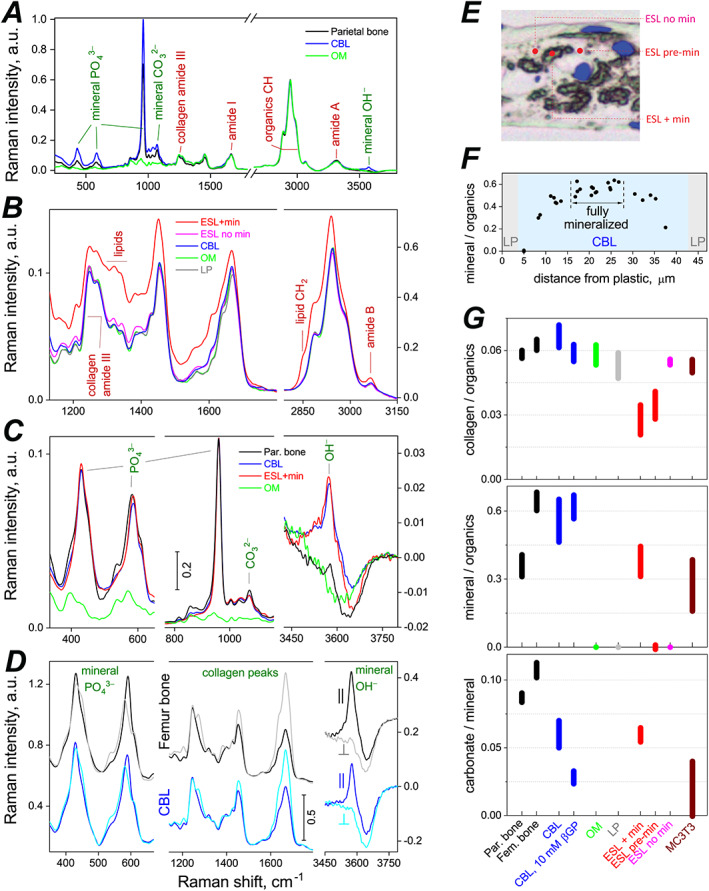
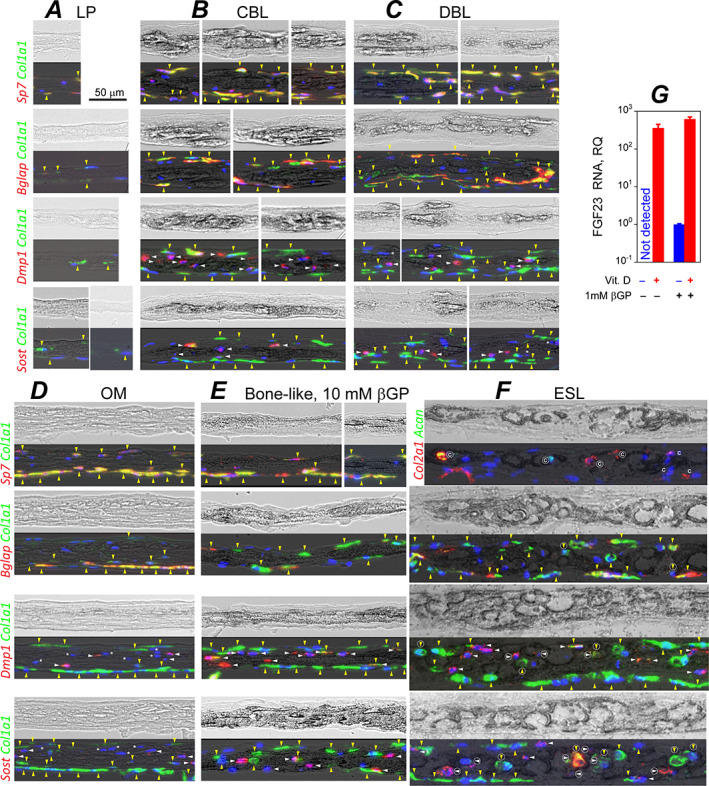
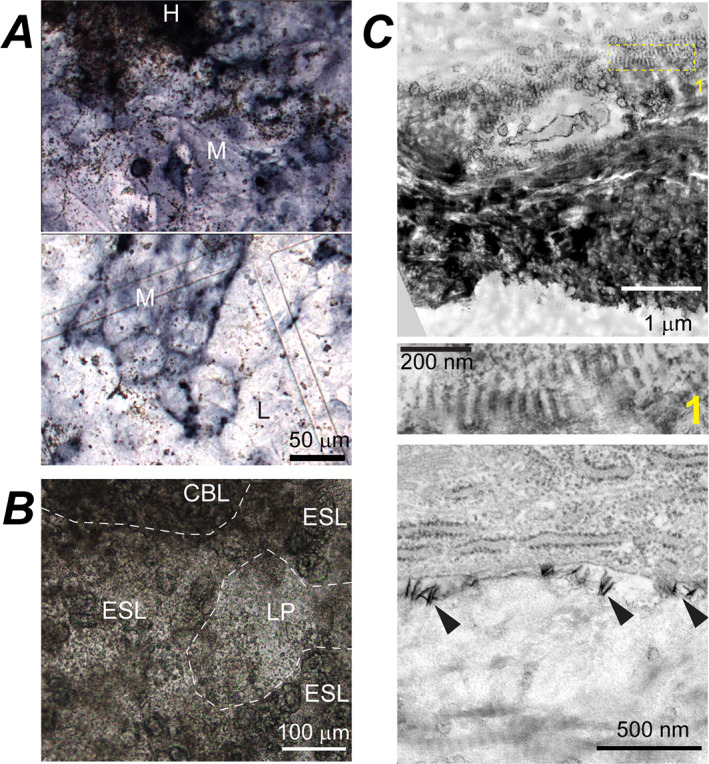
Relevance of mineralized nodules in two-dimensional (2D) osteoblast/osteocyte cultures to bone biology, pathology, and engineering is a decades old question, but a comprehensive answer appears to be still wanting. Bone-like cells, extracellular matrix (ECM), and mineral were all reported but so were non-bone-like ones. Many studies described seemingly bone-like cell-ECM structures based on similarity to few select bone features in vivo, yet no studies examined multiple bone features simultaneously and none systematically studied all types of structures coexisting in the same culture. Here, we report such comprehensive analysis of 2D cultures based on light and electron microscopies, Raman microspectroscopy, gene expression, and in situ messenger RNA (mRNA) hybridization. We demonstrate that 2D cultures of primary cells from mouse calvaria do form bona fide bone. Cells, ECM, and mineral within it exhibit morphology, structure, ultrastructure, composition, spatial-temporal gene expression pattern, and growth consistent with intramembranous ossification. However, this bone is just one of at least five different types of cell-ECM structures coexisting in the same 2D culture, which vary widely in their resemblance to bone and ability to mineralize. We show that the other two mineralizing structures may represent abnormal (disrupted) bone and cartilage-like structure with chondrocyte-to-osteoblast transdifferentiation. The two nonmineralizing cell-ECM structures may mimic periosteal cambium and pathological, nonmineralizing osteoid. Importantly, the most commonly used culture conditions (10mM β-glycerophosphate) induce artificial mineralization of all cell-ECM structures, which then become barely distinguishable. We therefore discuss conditions and approaches promoting formation of bona fide bone and simple means for distinguishing it from the other cell-ECM structures. Our findings may improve osteoblast differentiation and function analyses based on 2D cultures and extend applications of these cultures to general bone biology and tissue engineering research. Published 2022. This article is a U.S. Government work and is in the public domain in the USA. JBMR Plus published by Wiley Periodicals LLC on behalf of American Society for Bone and Mineral Research.

Keywords: CHONDROCYTES; COLLAGEN; MATRIX MINERALIZATION; MC3T3; OSTEOBLASTS; OSTEOCYTES.


Conflict of interest statement

All authors declare having no conflicts of interest and not being subjects of any institutional investigations.

Figures

Fig. 1
Fig. 1
Cell‐ECM structures in cultures of primary parietal bone cells and in parietal bone. (A) Top view transmission images of cultures grown in media containing indicated supplements and stained with alizarin complexone (0.63× objective). Asc2P was present in all cultures. Zoomed‐in images (bottom) show transparent (Tp), translucent (Tl), and opaque, stained mineralized (M) patches. (B) Top view and cross‐section images of LP, CBL, DBL, OM, ESL, and artificially mineralized LP cell‐ECM structures in culture and of a parietal bone from a 5‐day‐old mouse with periosteal surface facing up (10×/0.3 NA objective). Mineralized matrix (M) is marked in CBL, DBL, and parietal bone. Arrowheads mark cell lacunas inside mineralized matrix in CBL and parietal bone and ovoid lacunas with perilacunar mineralization in ESL. Single and double arrows mark individual and merged mineral granules, respectively, which were formed by artificial mineralization. The cultures were grown without βGP or Rap (LP, OM, ESL), with Rap (CBL, DBL), or with 10mM βGP (artificial mineralization). Rap or 1mM βGP did not qualitatively alter the appearance of these cell‐ECM structures. Transmission cross‐section images (middle) are overlain with DAPI fluorescence of cell nuclei. Dark‐field, polarized images of the same areas (bottom) reveal well‐oriented collagen fibers (bright). Alternating darker and brighter stripes in CBL and OM indicate lamellar ECM. All polarized images were captured at the same microscope settings. All bright‐field transmission images were corrected for white balance and intensity variations without contrast enhancement (see Materials and Methods). ECM with high thickness and high protein density is distinguished by its brownish hue. Unstained mineralized ECM appears darker and has a more prominent 3D texture. (C) Area fraction occupied by individual structures and by all mineralized structures (CBL, DBL, and ESL) in a culture grown for 34 days with indicated supplements. Each data point represents a different culture well in the same experiment. Error bars represent standard deviations; *p < 0.05, **p < 0.01, and ***p < 0.001. βGP = β‐glycerophosphate; CBL = continuous bone‐like; DBL = discontinuous bone‐like; ESL = eggshell‐like; LP = loosely packed; M = mineralized; OM = osteoid‐mimicking; Rap = 10nM rapamycin; Tl = translucent unmineralized; Tp = transparent unmineralized.
Fig. 2
Fig. 2
Transcription of key osteoblast genes in primary PBC cultures, MC3T3‐E1 cell cultures, and in vivo parietal bone from 5‐day‐old and 13‐day‐old mice. Cultures were grown in media containing indicated supplements. RQ of mRNA measured by qPCR represents 2−ΔΔC T normalized to parietal bone from 5‐day‐old mice (using B2m, Gapdh, and Hprt1 as housekeeping genes). Error bars are the standard deviations for N = 3 (culture) wells of PBCs pooled from multiple animals and N = 5 (bone) different animals. Reproducibility of the data in different cell preparations of primary PBCs and in different stocks of MC3T3‐E1 is demonstrated by Fig. S3. PBC = parietal bone cell; RQ = relative quantity.
Fig. 3
Fig. 3
LP cell‐ECM structure and cambium layer of parietal bone periosteum. (A) Cross‐section TEM images of full‐thickness LP in primary PBC culture (top, no βGP or Rap) and parietal bone periosteum from a 5‐day‐old mouse (bottom). Boxes mark zoomed‐in regions shown in the correspondingly numbered panels. Fb, Ob, and S mark fibroblast‐like, osteoblast‐like, and spread‐out cells, respectively. (B) Confocal fluorescence images of actin stress fibers and cell nuclei in LP layer (top, no βGP or Rap) and cambium layer of parietal bone (bottom) from a 4‐day‐old mouse. The images are optical slices through the layers parallel to layer plane. LP = loosely packed.
Fig. 4
Fig. 4
CBL structure in PBC cultures and parietal bone. (A) Top view transmission and confocal fluorescence images of CBL in live PBC culture from transgenic mice expressing a Cre::GFP construct in cells actively transcribing Sp7/osterix (no βGP or Rap). The left panel shows GFP signal (green) from cell nuclei overlaid with the transmission image. The right panel image of the same area (optically sliced through the middle of the mineralized CBL layer) shows the same GFP signal overlaid with actin cytoskeleton (red) and cell nuclei (blue). (B) Confocal fluorescence image showing actin cytoskeleton (red) and nuclei (blue) of osteocytes optically sliced through the middle of the mineralized layer of parietal bone from a 4‐day‐old mouse. In A and B, arrowheads point to processes of Ocs embedded into mineralized ECM (M, blue autofluorescence). (C) Transmission and wide‐field fluorescence images of a CBL cross‐section labeled by a calcein pulse at 3 weeks and by an alizarin complexone pulse at 4 weeks after induction of osteogenic differentiation (10nM Rap). (D) TEM images of primary PBC culture (no βGP or Rap) and parietal bone cross‐sections. Low resolution image (top left) shows layering of LP, CBL, and OM structures. Boxes mark zoomed‐in regions shown in the correspondingly numbered panels. Ob and Oc mark cells with osteoblast and osteocyte morphology, respectively. Arrowheads point to cell processes. Fused and individual collagen fibers are marked by letters f and i. Lamellas with collagen orientation approximately parallel and perpendicular to the section plane are marked by II and ⊥. CBL = continuous bone‐like; Oc = osteocyte‐like cell.
Fig. 5
Fig. 5
DBL and CBL structures in PBC cultures. (A) Low resolution TEM image (left panel) shows layering of DBL and LP structures in a cross‐section of a primary PBC culture (no βGP or Rap). The middle and right panels show zoomed‐in DBL regions marked with the correspondingly numbered boxes on the left panel. ECM mineralization occurred only within regions with smeared ultrastructure. The smearing was caused by uranyl acetate staining of negatively charged non‐collagenous proteins, which were crosslinked to collagen fibers by glutaraldehyde fixation and thereby retained during demineralization. (B) Top view transmission images revealing CBL's smooth mineralization front with adjacent osteoid (arrowheads) and numerous well‐defined cell lacunae (10nM Rap). (C) Similar images revealing DBL's ragged mineralization front without well‐defined osteoid (arrowheads), rough and poorly organized texture, and few well‐defined cell lacunae (10nM Rap). Boxes mark zoomed‐in regions shown in the correspondingly numbered panels. DBL = discontinuous bone‐like.
Fig. 6
Fig. 6
OM structure in primary PBC cultures. (A) Low resolution TEM image showing layering of OM and LP in a cross‐section of a primary PBC culture and higher resolution images of different OM regions marked by correspondingly numbered boxes (no βGP or Rap). Ob and Oc label osteoblast‐like and osteocyte‐like cells respectively; the arrowhead points to a process of the osteocyte‐like cell. (B) Confocal fluorescence image of a live primary PBC culture showing actin (red) cytoskeleton and nuclei (blue) of cells embedded inside an OM layer (no βGP or Rap). The image is an optical slice parallel to the layer. OM = osteoid‐mimicking.
Fig. 7
Fig. 7
Eggshell‐like (ESL) structure in primary PBC cultures. (A) Top view transmission and confocal fluorescence images of ESL in live PBC culture expressing Cre::GFP in cells actively transcribing Sp7 (no βGP or Rap, c.f. Fig. 4A,B ). In the top panel, GFP signal from cell nuclei is overlaid with the transmission image. The bottom panel image of the same area shows the same GFP signal (green), Sir‐Actin‐labeled actin cytoskeleton (red), and Hoechst‐labeled cell nuclei (blue). The fluorescence images are optical slices parallel to the ESL layer. Arrowheads point to cell processes in ovoidal lacunas. Letter M marks pericellular mineralized matrix (blue autofluorescence). (B) Transmission images of a culture cross‐section containing ESL before (top, 10×/0.3 NA objective) and after (bottom, 40×/0.55 NA objective) demineralization and toluidine blue staining (no βGP or Rap). ES points to mineralized pericellular matrix of an ovoidal lacuna. DBL marks mineralized DBL matrix. The sample was formaldehyde‐fixed before demineralization. (C) TEM images of ESL (no βGP or Rap). Low resolution TEM (left) shows LP and ESL layering in culture cross‐section. Zoomed‐in ESL regions (middle and right) marked by the correspondingly numbered boxes show ESL ultrastructure. The sample was glutaraldehyde‐fixed and not demineralized. V marks matrix vesicles. Very dark spots (M) around ovoidal lacunas are mineral crystals apparently nucleated by matrix vesicles. S marks staining smear around the mineral crystals apparently caused by negatively charged molecules (eg, mineral‐binding proteins) that bind the uranyl acetate stain. Similar smear appears in fixed bone and bone‐like samples (cf. Figs. 3A , 4D , 5A , and S7). Arrowheads point at cell processes.
Fig. 8
Fig. 8
Confocal Raman microspectroscopy analysis of ECM composition and organization in compact bones and cell‐ECM structures grown in primary PBC cultures. Raman spectra of 8‐μm or 10‐μm cross‐sections of bones and cell‐ECM structures were measured within different structural features and away from cell lacunae with ~0.5 μm x‐y resolution. (AD) Representative Raman spectra of fully mineralized compact bones and cell‐ECM structures grown without βGP. In A, B, and D, the spectra were scaled to have similar intensity of collagen amide III peaks. In D, femur and CBL spectra were also vertically offset. In C, parietal bone, CBL, and ESL spectra were scaled to match intensity of their 959 cm‐1 phosphate peaks whereas OM spectrum was scaled to match collagen amide III peaks. Panels A, B, and D show nonpolarized spectra. D shows polarized spectra with both excitation and emission polarizations set either parallel (||) or perpendicular (⊥) to collagen fibers. (E) Representative locations within ESL structure at which spectra of mineralized regions (ESL + min), unmineralized regions (ESL no min), and regions about to be mineralized (ESL pre‐min) were measured. (F) A profile of mineral phosphate to organic CH ratio across full thickness of a cell culture cross‐section that had a CBL structure (shaded in blue) in the middle. Fully mineralized region of the CBL is marked by a double arrow. Reduced mineralization on the sides indicates that mineral was deposited near the CBL center first, because mineralization at a given ECM spot takes ~3 weeks to proceed from nucleation to full level.( 40 ) Integral intensities of the 959 cm‐1 phosphate peak and organic CH peaks were used to calculate this ratio. (G) Ratios of integral intensities of collagen amide III to organic CH peaks (top), 959 cm‐1 mineral phosphate to organic CH (middle), and mineral carbonate to 959 cm‐1 mineral phosphate (bottom), representing ECM compositions in different cell‐ECM structures formed in culture and in vivo bones. In G, the bars show mean ± standard deviation; CBL bars represent an aggregate of similar data pooled from no βGP or Rap, 10nM Rap, and 1mM βGP cultures (Fig. S4B ); CBL 10mM βGP bars represent data only from 10mM βGP cultures; all other bars represent data from no‐βGP/no‐Rap or 1mM βGP cultures (which had similar ECM compositions).
Fig. 9
Fig. 9
mRNA expression in LP (A), CBL (B), DBL (C), OM (D), artificially mineralized bone‐like (E), and ESL (F) cell‐ECM structures grown in primary PBC cultures. (AF) Transmission images of PBC culture cross‐sections before demineralization (top) and the same images at reduced intensity overlaid with fluorescence signals from mRNA after staining (bottom). mRNA was fluorescently labeled by in situ hybridization with RNAScope™ probes for transcripts preferentially expressed in osteoblasts (Bglap, Col1a1, Sp7), osteocytes (Dmp1, Sost), and chondrocytes (Acan, Col2a1). All panels except E represent no‐βGP/no‐Rap or 1mM βGP cultures (in which each structure had similar appearance and mRNA expression). Vertical, yellow arrowheads mark cells expressing Col1a1 (preosteoblasts, osteoblasts, and possibly fibroblasts). Horizontal, white arrowheads mark differentiating and mature osteocytes. Asterisks mark cells embedded in DBL and OM that do not express Dmp1 or Sost. Letter C marks cells expressing Col2a1 and/or Acan. Encircled arrowheads and letter C mark the corresponding cells inside mineralized ESL ovoids. We did not label signals which could be artifacts of sample preparation (eg, displaced cells or debris). (G) Fgf23 mRNA transcription in mineralized primary PBC cultures in response to 2‐day treatment with 1α, 25‐dihydroxyvitamin D3. Error bars are standard deviations for N = 3 culture wells.
Fig. 10
Fig. 10
Artificial and normal mineralization induced by 10mM βGP in primary PBC cultures. (A) Top view, transmission images of a culture stained for ALP activity (dark blue/purple) at early mineralization stage (while mineralized nodules are small and sparse). Small brown dots are mineral granules. Dark, heavily stained region in the top panel (H) is a mineralized CBL nodule with densely packed mineral granules. Within regions with moderate ALP‐staining intensity (M), multiple mineral granules are present around well‐defined mineralized nodules (top panel) and fewer granules away from the nodules (bottom panel). Some mineral granules are also present in regions with low ALP‐staining intensity (L, bottom panel). (B) Top view, transmission image of a culture at intermediate mineralization stage showing numerous mineral granules within LP, CBL, and ESL structures, which begin to mask distinctive features of these structures and are about to merge into continuously mineralized plates (Fig. 1B ) and then layer. (C) TEM images of a CBL cross‐section at an early mineralization stage, which was neither demineralized nor stained with uranyl acetate (mineral appears very dark). Zoomed‐in middle panel (box 1 in the top panel) shows normal mineralization within gap regions of collagen fibers, which matches the fiber D‐periodicity. The bottom panel shows abnormal deposition of needle‐like mineral crystals (arrowheads) at the surface of an early osteocyte‐like cell. ALP = alkaline phosphatase.

Similar articles

Cited by

References

    1. Bilezikian JP, ed. Primer on the Metabolic Bone Diseases and Disorders of Mineral Metabolism. 9th ed. Wiley‐Blackwell: Hoboken, NJ; 2019.
    1. Bronner F, Farach‐Carson MC, Roach HI, eds. Bone and Development. London: Springer; 2010.
    1. Thakker RV, Whyte MP, Eisman JA, Igarashi T, eds. Genetics of Bone Biology and Skeletal Disease. 2nd ed. Academic Press; 2017.
    1. Boskey AL, Roy R. Cell culture systems for studies of bone and tooth mineralization. Chem Rev. 2008;108(11):4716‐4733. - PMC - PubMed
    1. Kalajzic I, Matthews BG, Torreggiani E, Harris MA, Pajevic PD, Harris SE. In vitro and in vivo approaches to study osteocyte biology. Bone. 2013;54(2):296‐306. - PMC - PubMed

LinkOut - more resources