Cancer treatment induces neuroinflammation and behavioral deficits in mice
- PMID: 36699654
- PMCID: PMC9868853
- DOI: 10.3389/fnbeh.2022.1067298
Cancer treatment induces neuroinflammation and behavioral deficits in mice
Abstract
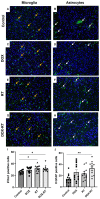
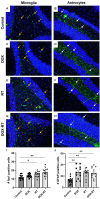
Introduction: Cancer survivors are increasingly diagnosed with a syndrome of neurocognitive dysfunction termed cancer-related cognitive impairment (CRCI). Chemotherapy and radiation therapy have been implicated in CRCI; however, its underlying pathogenesis remains unclear, hindering effective prevention or treatment. Methods: We used the hairless strain SKH1 (11-12-week-old) and treated the mice with radiation to the right hindlimb, doxorubicin (a chemotherapy agent), concurrent radiation, and doxorubicin, or no treatment (control). Neurocognition was evaluated via standardized behavioral testing following treatment. Mice were subsequently humanely euthanized, and plasma and brains were collected to identify inflammatory changes. Results: Mice treated with radiation, doxorubicin, or both radiation and doxorubicin demonstrated equivalent hippocampal dependent memory deficits and significant increases in activated microglia and astrocytes compared to control mice. Doxorubicin-treated mice had significantly increased plasma IL-6 and failed to gain weight compared to control mice over the study period. Discussion: This study demonstrates that non-brain directed radiation induces both gliosis and neurocognitive deficits. Moreover, this work presents the first characterization of SKH1 mice as a relevant and facile animal model of CRCI. This study provides a platform from which to build further studies to identify potential key targets that contribute to CRCI such that strategies can be developed to mitigate unintended neuropathologic consequences associated with anticancer treatment.
Keywords: SKH1 mice; cancer treatment; cancer-related cognitive impairment; neurobehavior; neuroinflammation.
Copyright © 2023 Demos-Davies, Lawrence, Rogich, Lind and Seelig.
Conflict of interest statement
The authors declare that the research was conducted in the absence of any commercial or financial relationships that could be construed as a potential conflict of interest.
Figures


Similar articles
-
The Distant Molecular Effects on the Brain by Cancer Treatment.Brain Sci. 2023 Dec 24;14(1):22. doi: 10.3390/brainsci14010022. Brain Sci. 2023. PMID: 38248237 Free PMC article.
-
Cancer related cognitive impairment: a downside of cancer treatment.Front Oncol. 2024 Apr 23;14:1387251. doi: 10.3389/fonc.2024.1387251. eCollection 2024. Front Oncol. 2024. PMID: 38715789 Free PMC article. Review.
-
Longitudinal Neuropathological Consequences of Extracranial Radiation Therapy in Mice.Int J Mol Sci. 2024 May 24;25(11):5731. doi: 10.3390/ijms25115731. Int J Mol Sci. 2024. PMID: 38891920 Free PMC article.
-
A Drosophila model relevant to chemotherapy-related cognitive impairment.Sci Rep. 2023 Nov 7;13(1):19290. doi: 10.1038/s41598-023-46616-9. Sci Rep. 2023. PMID: 37935827 Free PMC article.
-
Long-Term Cognitive Dysfunction in Cancer Survivors.Front Mol Biosci. 2021 Dec 14;8:770413. doi: 10.3389/fmolb.2021.770413. eCollection 2021. Front Mol Biosci. 2021. PMID: 34970595 Free PMC article. Review.
Cited by
-
Neuroimaging based biotypes for precision diagnosis and prognosis in cancer-related cognitive impairment.Front Med (Lausanne). 2023 Aug 29;10:1199605. doi: 10.3389/fmed.2023.1199605. eCollection 2023. Front Med (Lausanne). 2023. PMID: 37720513 Free PMC article. Review.
-
Drug protection against radiation-induced neurological injury: mechanisms and developments.Arch Toxicol. 2025 Mar;99(3):851-863. doi: 10.1007/s00204-024-03933-w. Epub 2024 Dec 26. Arch Toxicol. 2025. PMID: 39724149 Review.
-
The Distant Molecular Effects on the Brain by Cancer Treatment.Brain Sci. 2023 Dec 24;14(1):22. doi: 10.3390/brainsci14010022. Brain Sci. 2023. PMID: 38248237 Free PMC article.
-
Cancer related cognitive impairment: a downside of cancer treatment.Front Oncol. 2024 Apr 23;14:1387251. doi: 10.3389/fonc.2024.1387251. eCollection 2024. Front Oncol. 2024. PMID: 38715789 Free PMC article. Review.
-
Brain alterations and neurologic disorder progression induced by lymphatic dysfunction in the head and neck region.Acta Neuropathol Commun. 2025 Apr 8;13(1):72. doi: 10.1186/s40478-025-01953-w. Acta Neuropathol Commun. 2025. PMID: 40200314 Free PMC article.
References
-
- Ali M. A., Menze E. T., Tadros M. G., Tolba M. F. (2020). Caffeic acid phenethyl ester counteracts doxorubicin-induced chemobrain in Sprague-Dawley rats: emphasis on the modulation of oxidative stress and neuroinflammation. Neuropharmacology 181:108334. 10.1016/j.neuropharm.2020.108334 - DOI - PubMed
-
- Argyriou A. A., Assimakopoulos K., Iconomou G., Giannakopoulou F., Kalofonos H. P. (2011). Either called “chemobrain” or “chemofog”, the long-term chemotherapy-induced cognitive decline in cancer survivors is real. J. Pain Symptom Manage. 41, 126–139. 10.1016/j.jpainsymman.2010.04.021 - DOI - PubMed

