. 2023 Jan 9:9:1095193.
doi: 10.3389/fmolb.2022.1095193. eCollection 2022.

Modeling nonsegmented negative-strand RNA virus (NNSV) transcription with ejective polymerase collisions and biased diffusion

Affiliations

Modeling nonsegmented negative-strand RNA virus (NNSV) transcription with ejective polymerase collisions and biased diffusion

Felipe-Andrés Piedra et al. Front Mol Biosci. .

Abstract

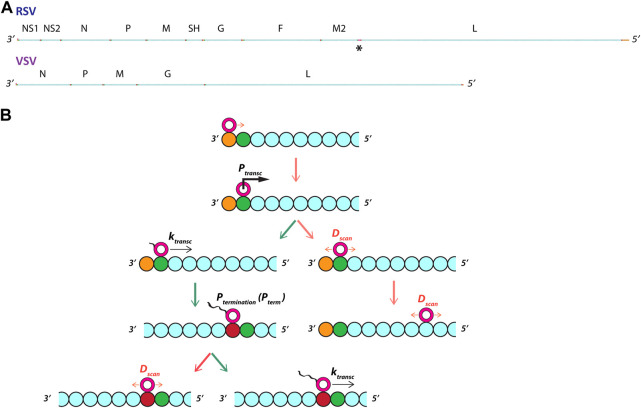
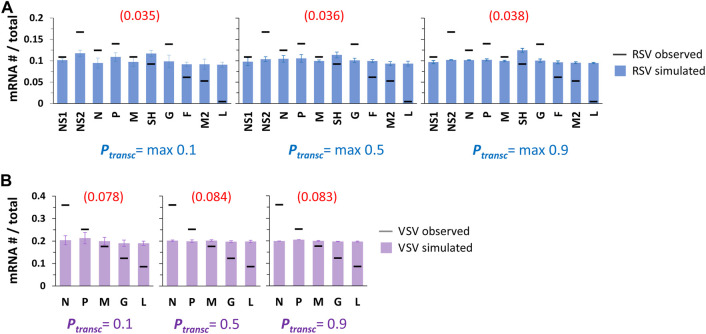
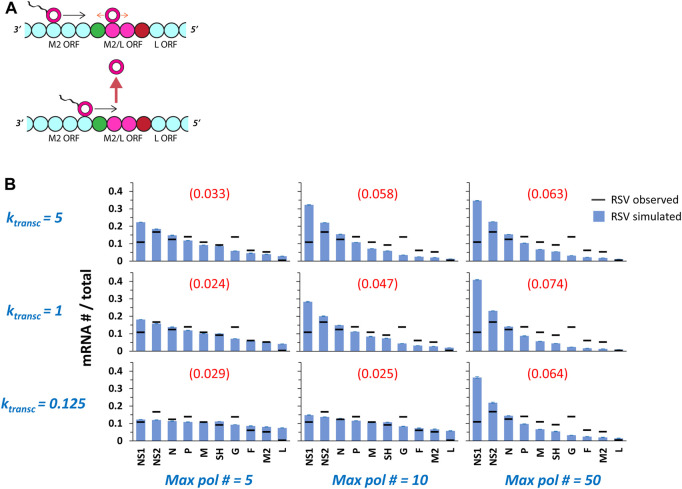
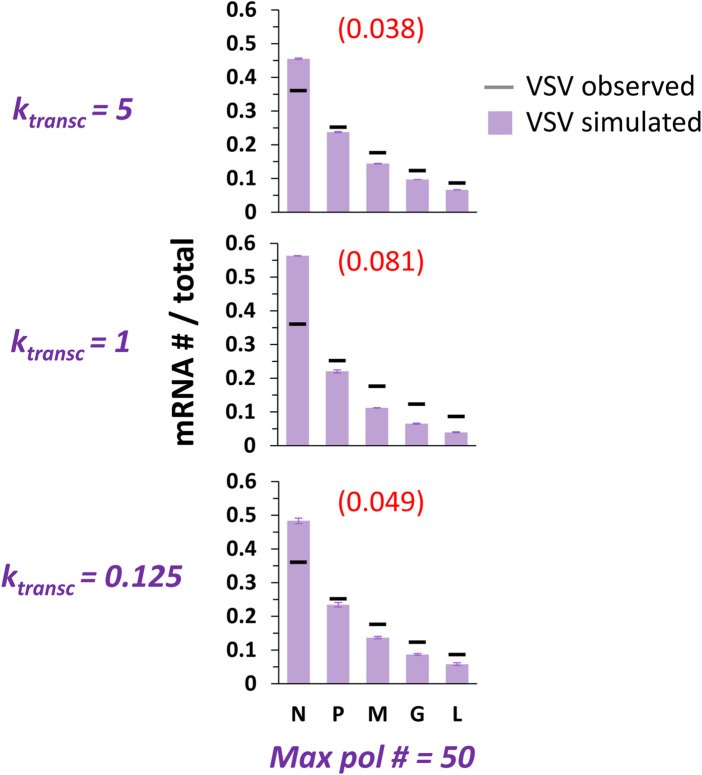
Infections by non-segmented negative-strand RNA viruses (NNSV) are widely thought to entail gradient gene expression from the well-established existence of a single promoter at the 3' end of the viral genome and the assumption of constant transcriptional attenuation between genes. But multiple recent studies show viral mRNA levels in infections by respiratory syncytial virus (RSV), a major human pathogen and member of NNSV, that are inconsistent with a simple gradient. Here we integrate known and newly predicted phenomena into a biophysically reasonable model of NNSV transcription. Our model succeeds in capturing published observations of respiratory syncytial virus and vesicular stomatitis virus (VSV) mRNA levels. We therefore propose a novel understanding of NNSV transcription based on the possibility of ejective polymerase-polymerase collisions and, in the case of RSV, biased polymerase diffusion.

Keywords: RNA viral genome; biased diffusion; polymerase collisions; transcriptional regulation; viral gene expression.


Conflict of interest statement

The authors declare that the research was conducted in the absence of any commercial or financial relationships that could be construed as a potential conflict of interest.

Figures

FIGURE 1
FIGURE 1
The model: linear respiratory syncytial virus (RSV) and vesicular stomatitis virus (VSV) genomes support the stochastic initiation and termination of transcription by a diffusing viral RNA-dependent RNA polymerase (pol). (A) The genetic structure of RSV and VSV genomes. The modeled RSV genome is 15,222 nt long and contains 10 ORFs with 8 gene junctions and a single short region (68 nt) of overlapping ORFs between genes M2 and L (see black asterisk). The modeled VSV genome is 11,152 nt long and contains 5 ORFs with 4 gene junctions. The genomes were divided into chunks approximating the size of a pol footprint (28 nts). Most of each genome is coding sequence (represented as cyan beads). (B) Essential model phenomena and parameters. A single RNA-dependent RNA polymerase (pol) starts an unbiased random walk at a rate D scan (= 1 genomic chunk per event) at the most 3’ chunk (depicted as a burnt orange bead) of the modeled genome. Transcription initiation occurs with a probability P transc when a pol diffuses onto a genomic chunk containing a gene start (GS) signal (depicted as a green bead). If transcription is not initiated, the unbiased random walk (i.e., diffusion) resumes. If transcription is initiated, the modeled pol state changes and the pol starts translocating 5’ down the genome at a rate k transc (= x genomic chunks per event). Transcription termination occurs with a probability P term when a transcribing pol translocates onto a genomic chunk containing a gene end (GE) signal (depicted as a red bead). If termination occurs, the pol state changes back to non-transcribing and resumes diffusion along the genome at a rate D scan ; if termination does not occur, the pol ‘reads through’ the GE signal and continues transcribing into the next ORF. (Cyan beads represent coding sequence).
FIGURE 2
FIGURE 2
Single pol simulations produce flat patterns of gene expression across P transc values tested. (A) Simulated RSV transcription. Histograms of mRNA # for each RSV gene divided by the total mRNA # show uniform gene expression across the 10 genes for all three sets of P transc tested (max 0.1, max 0.5, and max 0.9). For each set of P transc, the max value equals the probability of transcription at every GS signal except for that of the G gene, which equals 0.65*max. Blue bars depict results from simulations; black horizontal bars depict average published experimentally observed values (Rajan et al., 2022). Each data point is the average of three 100,000 event simulations; error bars show the standard deviation. The number in parentheses and red above each histogram is the root-mean-square deviation (RMSD) of the simulated gene expression pattern from the experimental observations. (B) Simulated VSV transcription. Histograms of mRNA # for each VSV gene divided by the total mRNA # show uniform gene expression across the 5 genes for all three sets of P transc tested (0.1, 0.5, and 0.9). For each set of P transc, the probability of transcription is the same at every GS signal. Lavender bars depict results from simulations; black horizontal bars depict average published experimentally observed values (Iverson and Rose, 1981). Each data point is the average of three 100,000 event simulations; error bars show the standard deviation. The number in parentheses and red above each histogram is the root-mean-square deviation (RMSD) of the simulated gene expression pattern from the experimental observations.
FIGURE 3
FIGURE 3
Multiple pols on a single genome undergoing ejective collisions between transcribing and non-transcribing pols produce gene expression gradients of increasing steepness with increasing 5’ translocation rate (k transc ) and increasing maximum pol number (max pol #). (A) The M2/L overlap in ORFs. The final two genes of the RSV genome, M2 (which encodes both a transcription processivity factor and a regulatory factor that enhances replication) and L (which encodes the polymerase), share a 68 nt stretch (approximately two genomic chunks of 28 nts each—depicted as magenta beads) of ORF. This ORF overlap should be a hotspot for collisions between transcribing pols and non-transcribing pols diffusing in the neighborhood of the M2 GE signal (shown as red bead). The L gene GS signal is depicted as a green bead. (B) RSV gene expression patterns over a range of k transc and max pol #. The parameter k transc sets the rate at which transcribing pols move 5’ down the genome (units = genomic chunks per simulated event) and the parameter max pol # sets the maximum number of pols allowed on the genome at one time. Simulations of RSV transcription were performed at three different values of k transc x three different values of max pol #. Histograms of mRNA # for each RSV gene divided by the total mRNA # depict results from the simulations (blue bars) and average published experimentally observed values (black horizontal bars) (Rajan et al., 2022). Each data point is the average of three 100,000 event simulations; error bars show the standard deviation. The number in parentheses and red above each histogram is the root-mean-square deviation (RMSD) of the simulated gene expression pattern from the experimental observations.
FIGURE 4
FIGURE 4
Simulations of at most 50 pols and collision-based pol ejections fit benchmark observations of VSV gene expression best at the highest k transc tested. VSV gene expression patterns over a range of k transc and a single max pol #. The parameter k transc sets the rate at which transcribing pols move 5’ down the genome (units = genomic chunks per simulated event) and the parameter max pol # sets the maximum number of pols allowed on the genome at one time. Simulations of VSV transcription were performed at three different values of k transc . Histograms of mRNA # for each VSV gene divided by the total mRNA # depict results from the simulations (lavender bars) and average published experimentally observed values (black horizontal bars) (Iverson and Rose, 1981). Each data point is the average of three 100,000 event simulations; error bars show the standard deviation. The number in parentheses and red above each histogram is the root-mean-square deviation (RMSD) of the simulated gene expression pattern from the experimental observations.
FIGURE 5
FIGURE 5
The number of pol ejections occurring over one run of the model and the ratio of RSV L mRNA to M2 mRNA levels (L:M2) produced are inversely related. (A) The number of pol ejections vs. max pol # for three different values of k transc . Each data point is the average of three 100,000 event simulations. (B) The ratio of L mRNA to M2 mRNA levels (L:M2) vs. max pol # for three different values of k transc . Each data point is the average of three 100,000 event simulations.
FIGURE 6
FIGURE 6
Including a 5’ pol diffusion bias (D bias ) can reproduce the experimentally observed drop in gene expression between RSV genes M2 and L. (A) D bias is expected to have its largest effect on ratios of L mRNA to M2 mRNA levels (L:M2). M2 and L ORFs are depicted as cyan beads (bead size reflects a pol footprint size of 28 nt); the M2/L overlap is depicted as two magenta beads; the L GS signal is depicted as a green bead; the M2 GE signal is depicted as a red bead. (B) A scan of parameter values shows that moderate D bias with reduced pol footprint size can reproduce the experimentally observed value of L:M2 (Rajan et al., 2022). Left panel: histograms show simulated (blue bar) and experimentally observed (horizontal black bar) L:M2 values for two different values of k transc x three different values of D bias (max pol # = 5). The two lower values of D bias tested (highlighted in pale yellow) result in a slightly greater drop in L:M2 than D bias = 3; these values were used in subsequent simulations. Middle panel: histograms show simulated (blue bar) and experimentally observed (horizontal black bar) L:M2 values for two different values of k transc x two different values of D bias under conditions of increased P transc (= max of 0.9). As predicted, an increased P transc resulted in a further decreased L:M2. Simulations with D bias = 2 (results highlighted in pale yellow) were chosen for subsequent simulations. Right panel: histograms show simulated (blue bar) and experimentally observed (horizontal black bar) L:M2 values for two different values of k transc x two different pol footprint sizes (14 and 7 nt) and D bias = 2. A decreased pol footprint size increases the effective distance between the M2 GE and L GS signals, and results in simulated levels of L:M2 that closely match experimental observations. Each data point is the average of three 100,000 event simulations. (C) Global fits of the RSV gene expression data improve with the introduction of D bias and reduced pol footprint size. Simulations of RSV transcription were performed at two different values of k transc x two different values of pol footprint and D bias = 2. Histograms of mRNA # for each RSV gene divided by the total mRNA # depict results from the simulations (blue bars) and average published experimentally observed values (black horizontal bars) (Rajan et al., 2022). Each data point is the average of three 100,000 event simulations; error bars show the standard deviation. The number in parentheses and red above each histogram is the root-mean-square deviation (RMSD) of the simulated gene expression pattern from the experimental observations.
FIGURE 7
FIGURE 7
The model captures published observations of RSV and VSV transcription with adjustments to the underlying transcription probabilities (P transc ). (A) High quality fits of experimentally observed RSV gene expression patterns. P transc were manually adjusted to achieve optimized fits at max pol # = 5, k transc = 5, D bias = 2, and pol footprint of 14 and 7 nt. Histograms of mRNA # for each RSV gene divided by the total mRNA # depict results from the simulations (blue bars) and average published experimentally observed values (black horizontal bars) (Rajan et al., 2022). Each data point is the average of three 100,000 event simulations; error bars show the standard deviation. The number in parentheses and red above each histogram is the root-mean-square deviation (RMSD) of the simulated gene expression pattern from the experimental observations. (B) A high quality fit of the benchmark experimentally observed VSV gene expression pattern. P transc were manually adjusted to achieve an optimized fit at max pol # = 50, k transc = 5, D bias = 1 (i.e., NO 5’ bias), and pol footprint = 28 nt. The histogram of mRNA # for each VSV gene divided by the total mRNA # depicts results from the simulations (lavender bars) and average published experimentally observed values (black horizontal bars) (Iverson and Rose, 1981). Each data point is the average of three 100,000 event simulations; error bars show the standard deviation. The number in parentheses and red above the histogram is the root-mean-square deviation (RMSD) of the simulated gene expression pattern from the experimental observations.

References

    1. Aljabr W., Touzelet O., Pollakis G., Wu W., Munday D. C., Hughes M., et al. (2016). Investigating the influence of ribavirin on human respiratory syncytial virus RNA synthesis by using a high-resolution transcriptome sequencing approach. J. Virol. 90 (10), 4876–4888. 10.1128/JVI.02349-15 - DOI - PMC - PubMed
    1. Barik S. (1993). The structure of the 5' terminal cap of the respiratory syncytial virus mRNA. J. Gen. Virol. 74 , 485–490. 10.1099/0022-1317-74-3-485 - DOI - PubMed
    1. Barr J. N., Tang X., Hinzman E., Shen R., Wertz G. W. (2008). The VSV polymerase can initiate at mRNA start sites located either up or downstream of a transcription termination signal but size of the intervening intergenic region affects efficiency of initiation. Virology 374 (2), 361–370. 10.1016/j.virol.2007.12.023 - DOI - PMC - PubMed
    1. Barr J. N., Whelan S. P., Wertz G. W. (1997). cis-Acting signals involved in termination of vesicular stomatitis virus mRNA synthesis include the conserved AUAC and the U7 signal for polyadenylation. J. Virol. 71 (11), 8718–8725. 10.1128/JVI.71.11.8718-8725.1997 - DOI - PMC - PubMed
    1. Brauburger K., Boehmann Y., Krahling V., Muhlberger E. (2016). Transcriptional regulation in Ebola virus: Effects of gene border structure and regulatory elements on gene expression and polymerase scanning behavior. J. Virol. 90 (4), 1898–1909. 10.1128/JVI.02341-15 - DOI - PMC - PubMed

LinkOut - more resources