

cblaster: a remote search tool for rapid identification and visualization of homologous gene clusters
- PMID: 36700093
- PMCID: PMC9710679
- DOI: 10.1093/bioadv/vbab016
cblaster: a remote search tool for rapid identification and visualization of homologous gene clusters
Abstract
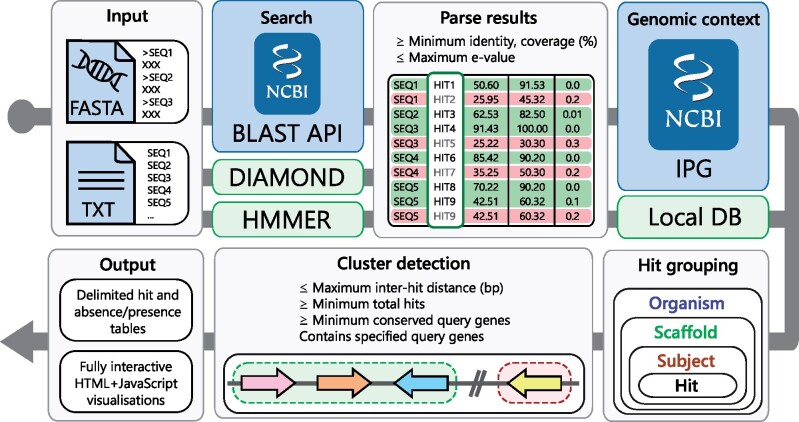
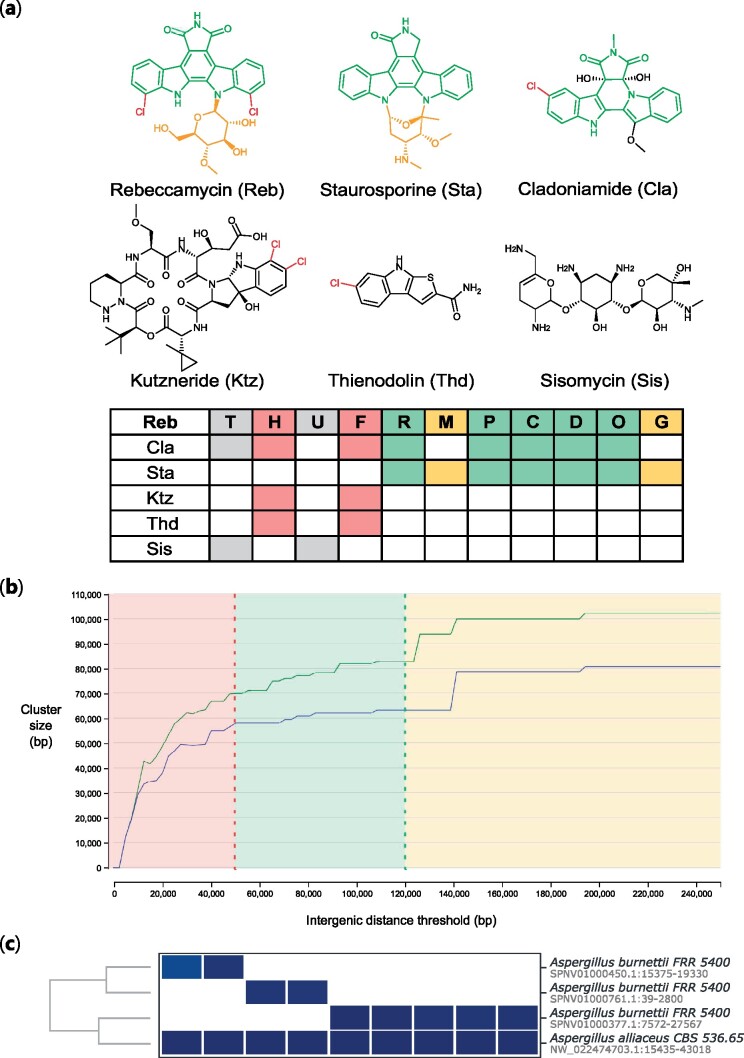
Motivation: Genes involved in coordinated biological pathways, including metabolism, drug resistance and virulence, are often collocalized as gene clusters. Identifying homologous gene clusters aids in the study of their function and evolution, however, existing tools are limited to searching local sequence databases. Tools for remotely searching public databases are necessary to keep pace with the rapid growth of online genomic data.
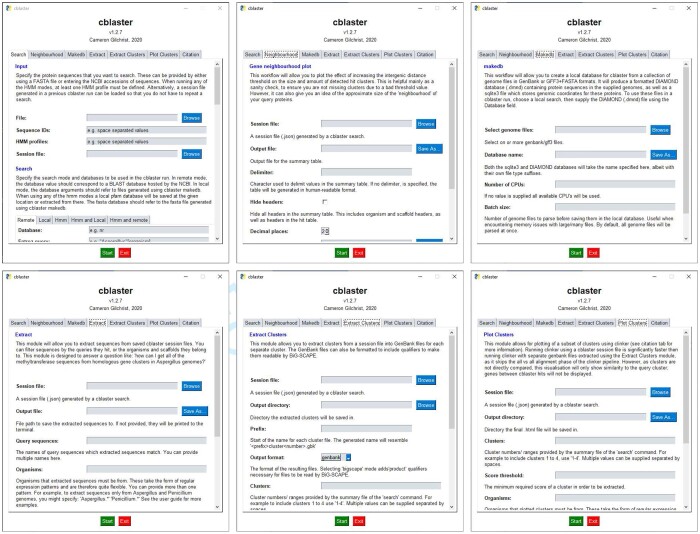
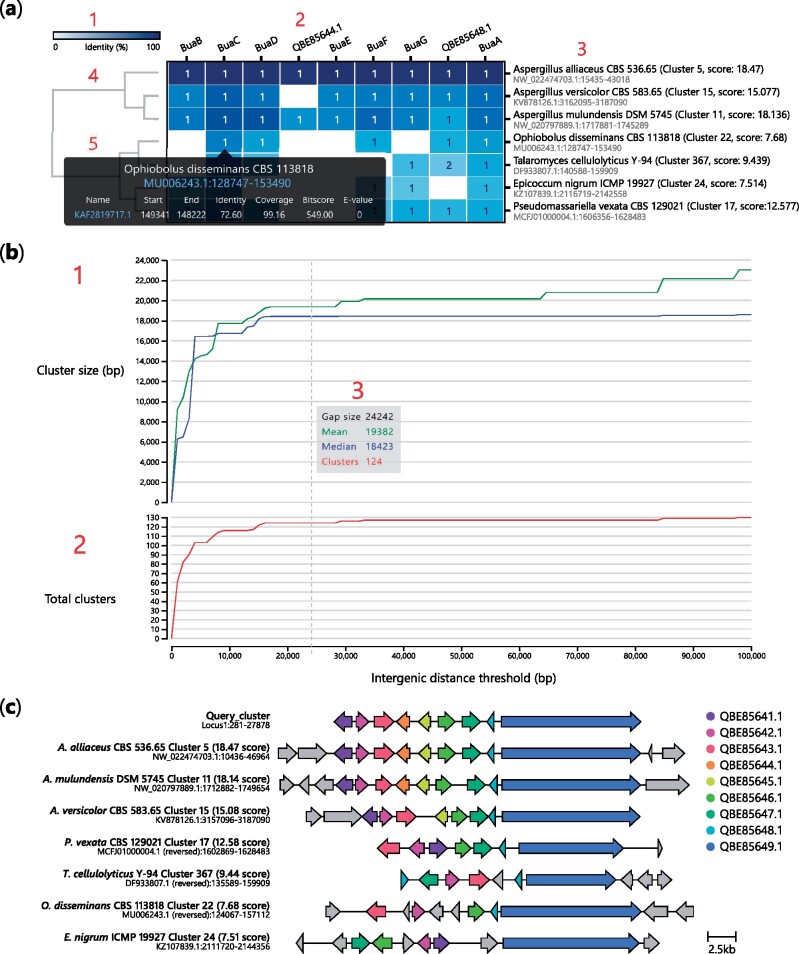
Results: Here, we present cblaster, a Python-based tool to rapidly detect collocated genes in local and remote databases. cblaster is easy to use, offering both a command line and a user-friendly graphical user interface. It generates outputs that enable intuitive visualizations of large datasets and can be readily incorporated into larger bioinformatic pipelines. cblaster is a significant update to the comparative genomics toolbox.
Availability and implementation: cblaster source code and documentation is freely available from GitHub under the MIT license (github.com/gamcil/cblaster).
Supplementary information: Supplementary data are available at Bioinformatics Advances online.
© The Author(s) 2021. Published by Oxford University Press.
Figures
Similar articles
-
clinker & clustermap.js: automatic generation of gene cluster comparison figures.Bioinformatics. 2021 Aug 25;37(16):2473-2475. doi: 10.1093/bioinformatics/btab007. Bioinformatics. 2021. PMID: 33459763
-
CAGECAT: The CompArative GEne Cluster Analysis Toolbox for rapid search and visualisation of homologous gene clusters.BMC Bioinformatics. 2023 May 3;24(1):181. doi: 10.1186/s12859-023-05311-2. BMC Bioinformatics. 2023. PMID: 37131131 Free PMC article.
-
PDEparams: parameter fitting toolbox for partial differential equations in python.Bioinformatics. 2020 Apr 15;36(8):2618-2619. doi: 10.1093/bioinformatics/btz938. Bioinformatics. 2020. PMID: 31851311
-
ASCIIGenome: a command line genome browser for console terminals.Bioinformatics. 2017 May 15;33(10):1568-1569. doi: 10.1093/bioinformatics/btx007. Bioinformatics. 2017. PMID: 28119307 Free PMC article.
-
getENRICH: a tool for the gene and pathway enrichment analysis of non-model organisms.Bioinform Adv. 2025 Feb 7;5(1):vbaf023. doi: 10.1093/bioadv/vbaf023. eCollection 2025. Bioinform Adv. 2025. PMID: 39990255 Free PMC article.
Cited by
-
Marine bacteroidetes use a conserved enzymatic cascade to digest diatom β-mannan.ISME J. 2023 Feb;17(2):276-285. doi: 10.1038/s41396-022-01342-4. Epub 2022 Nov 21. ISME J. 2023. PMID: 36411326 Free PMC article.
-
Trichoderma reesei Contains a Biosynthetic Gene Cluster That Encodes the Antifungal Agent Ilicicolin H.J Fungi (Basel). 2021 Dec 1;7(12):1034. doi: 10.3390/jof7121034. J Fungi (Basel). 2021. PMID: 34947016 Free PMC article.
-
Relation of pest insect-killing and soilborne pathogen-inhibition abilities to species diversification in environmental Pseudomonas protegens.ISME J. 2023 Sep;17(9):1369-1381. doi: 10.1038/s41396-023-01451-8. Epub 2023 Jun 13. ISME J. 2023. PMID: 37311938 Free PMC article.
-
Mining for a New Class of Fungal Natural Products: The Evolution, Diversity, and Distribution of Isocyanide Synthase Biosynthetic Gene Clusters.bioRxiv [Preprint]. 2023 Apr 18:2023.04.17.537281. doi: 10.1101/2023.04.17.537281. bioRxiv. 2023. Update in: Nucleic Acids Res. 2023 Aug 11;51(14):7220-7235. doi: 10.1093/nar/gkad573. PMID: 37131656 Free PMC article. Updated. Preprint.
-
CASCADE-Cas3 enables highly efficient genome engineering in Streptomyces species.Nucleic Acids Res. 2025 Mar 20;53(6):gkaf214. doi: 10.1093/nar/gkaf214. Nucleic Acids Res. 2025. PMID: 40138716 Free PMC article.
References
LinkOut - more resources
Full Text Sources
