. 2023 Mar 15;133(6):e158357.
doi: 10.1172/JCI158357.

Th2-skewed T cells correlate with B cell response to α-Gal and tick antigens in α-Gal syndrome

Affiliations

Th2-skewed T cells correlate with B cell response to α-Gal and tick antigens in α-Gal syndrome

Danijela Apostolovic et al. J Clin Invest. .

Abstract

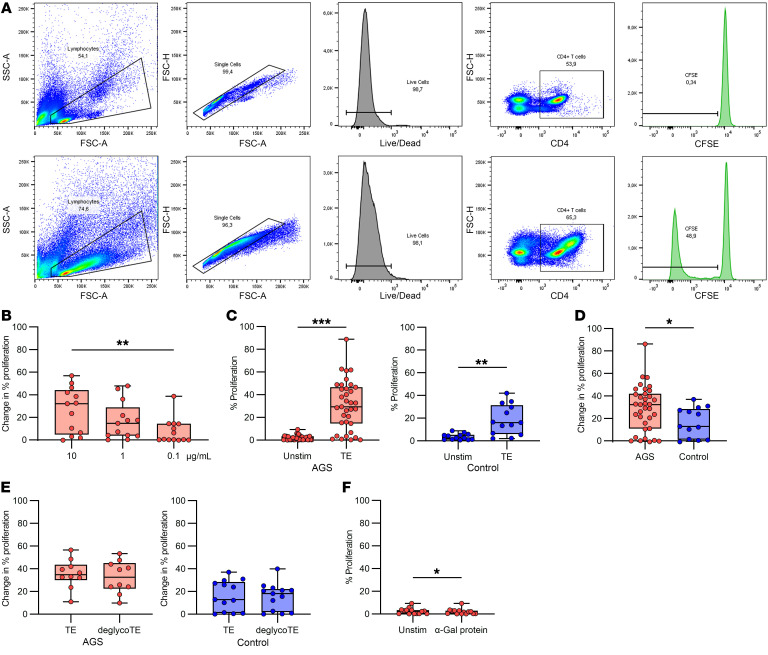
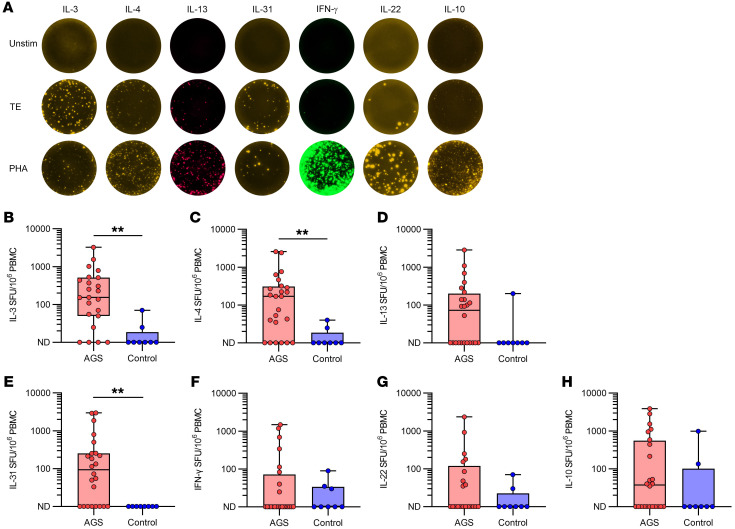
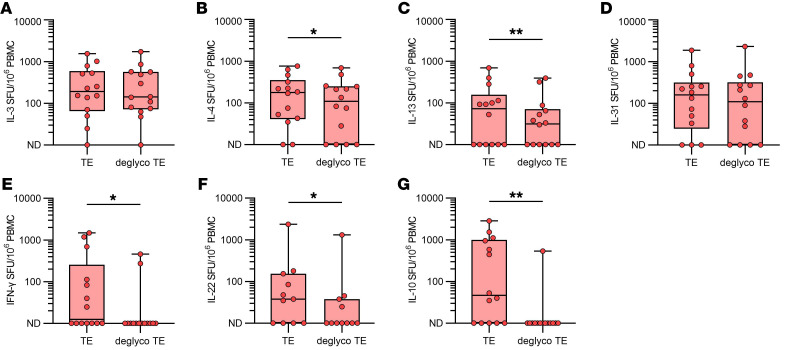
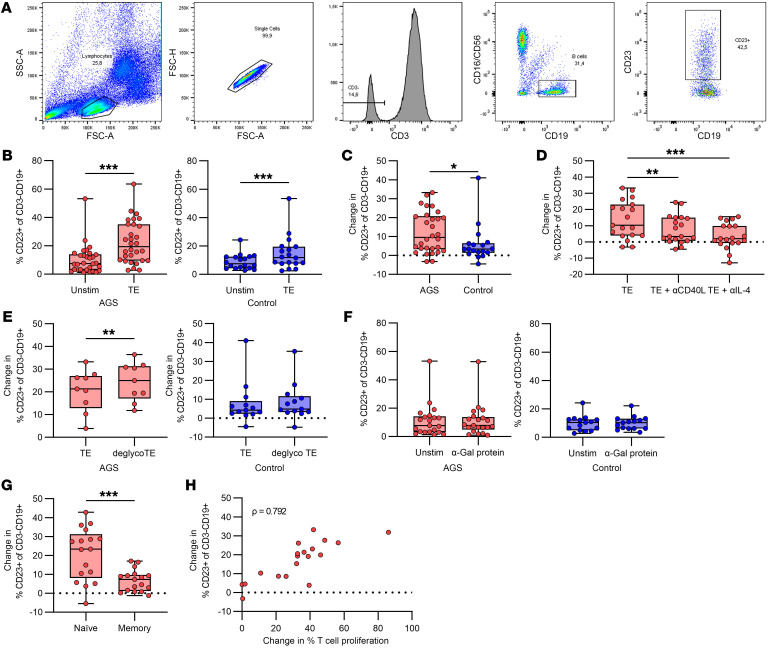
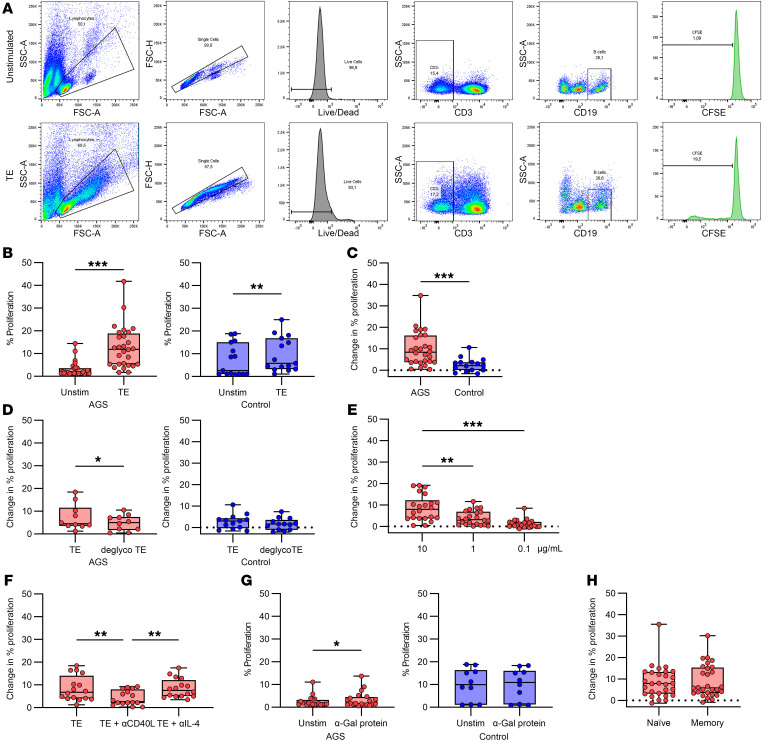
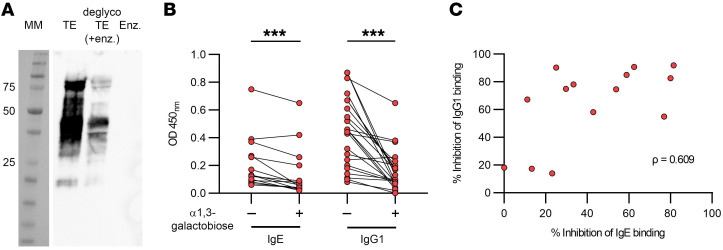
Tick bites have been shown to transmit a novel form of severe food allergy, the galactose-α-1,3-galactose (α-Gal) syndrome (AGS). Cellular responses to α-Gal in patients with AGS have, to date, not been thoroughly scrutinized. Therefore, we investigated T and B cell proliferation, activation, and cytokine profiles in response to tick protein extract (TE) and α-Gal-free TE in patients with AGS and in healthy controls. T and B cells from both patients and controls proliferated in response to TE, but significantly more in patients with AGS. B cell proliferation, but not T cell proliferation, in patients with AGS was reduced by removing α-Gal from the TE. In addition, TE induced a clear Th2 cytokine profile in patients with AGS. Expression of CD23 by B cells correlated only to T cell proliferation. However, both B cell proliferation and CD23 expression were reduced when CD40L and IL-4 were blocked. A large portion of the IgG1 and IgE antibodies binding TE in patients with AGS were directed against the α-Gal epitope. We have, for what we believe to be the first time, investigated T and B cell responses to α-Gal carrying tick proteins in patients with AGS, which will be essential for the understanding of the immune response against an allergenic carbohydrate transmitted by ticks.

Keywords: Allergy; Immunology; Th2 response.


Conflict of interest statement

Conflict of interest: MVH reports personal fees from Thermo Fisher Scientific, outside the submitted work. MS reports personal fees from ALK, CHIESI, MEDA, and AstraZeneca, outside the submitted work. SP is a shareholder in Mabtech AB.

Figures

Figure 1
Figure 1. T cell proliferation measured by dilution of CFSE.
(A) Gating strategy for proliferation of CD4+ T helper cells. (B) T cell proliferation in response to different doses of TE in patients with AGS, Friedman test with Dunn’s multiple comparisons test, **P < 0.01, n = 13. (C) T cell proliferation to TE compared with unstimulated cells in patients with AGS (left, n = 35) and healthy controls (right, n = 16), Wilcoxon matched-pairs signed rank test, **P < 0.01, ***P < 0.001. (D) Comparison of patients with AGS and healthy controls, Mann-Whitney U test, *P < 0.05, n = 35 (AGS) and n = 13 (controls). (E) T cell proliferation after removal of α-Gal from the TE in patients with AGS (left, n = 10) and healthy controls (right, n = 13), Wilcoxon matched-pairs signed rank test. (F) T cell proliferation to an α-Gal containing nontick protein in patients with AGS, Wilcoxon matched-pairs signed rank test, *P < 0.05, n = 14. Each point within the box plot represents 1 individual. Box plots represent IQR and median, whiskers extend to the farthest data points.
Figure 2
Figure 2. Cytokine expression by PBMCs in response to TE from patients with AGS and healthy controls.
(A) Representative photos of FluoroSpot wells from a patient with AGS for unstimulated cells, TE-stimulated cells, and PHA-stimulated cells. (B) IL-3, (C) IL-4, (D) IL-13, (E) IL-31, (F) IFN-γ, (G) IL-22, and (H) IL-10. Mann-Whitney U test, **P < 0.01, n = 24 (AGS, n = 23 for IL-3) and n = 8 (control). Each point within the box plot represents 1 individual. Box plots represent IQR and median, whiskers extend to the farthest data points.
Figure 3
Figure 3. Cytokine secreting cells in PBMCs from patients with AGS after stimulation with TE and deglycosylated TE.
(A) IL-3, (B) IL-4, (C) IL-13, (D) IL-31, (E) IFN-γ, (F) IL-22, and (G) IL-10. Wilcoxon matched-pairs signed rank test. *P < 0.05, and **P < 0.01. n = 14 for all except IL-22, where n = 11. Each point within the box plot represents 1 individual. Box plots represent IQR and median, whiskers extend to the farthest data points.
Figure 4
Figure 4. B cell expression of CD23.
(A) Gating strategy for CD23-expressing B cells. (B) CD23 expression in unstimulated compared with TE stimulated B cells in patients with AGS (left, n = 30) and healthy controls (right, n = 18), Wilcoxon matched-pairs signed rank test, ***P < 0.001. (C) Comparison of patients with AGS and healthy controls, Mann-Whitney U test, *P < 0.05, n = 30 (AGS) and n = 18 (controls). (D) Effect of inhibition with anti-CD40L and anti-IL-4 antibodies in patients with AGS, Friedman test with Dunn’s multiple comparisons test, **P < 0.01, ***P < 0.001, n = 19. (E) Effect of removing α-Gal from the TE in patients with AGS (left, n = 9), and healthy controls (right, n = 13), Wilcoxon matched-pairs signed rank test, **P < 0.01. (F) Comparison of CD23 expression in unstimulated B cells compared with B cells stimulated with an α-Gal containing nontick protein in patients with AGS (left, n = 21) and healthy controls (right, n = 15). (G) Comparison of CD23 expression by naive (CD27-IgD+) and memory (CD27+) B cells after TE stimulation in patients with AGS, Wilcoxon matched-pairs signed rank test, ***P < 0.001, n = 17. Each point within the box plot represents 1 individual. Box plots represent IQR and median, whiskers extend to the farthest data points. (H) Correlation of T cell proliferation and CD23 expression in response to TE in patients with AGS, Spearman’s rank correlation, ρ = 0.792, P < 0.001, n = 19. Each point represents 1 individual.
Figure 5
Figure 5. B cell proliferation measured by CFSE dilution.
(A) Gating strategy for proliferation of CD3-CD19+ B cells. (B) Proliferation of unstimulated compared with TE stimulated B cells in patients with AGS (left, n = 28) and healthy controls (right, n = 15), Wilcoxon matched-pairs signed rank test, **P < 0.01 and ***P < 0.001. (C) Comparison of patients with AGS and individuals acting as healthy controls, Mann-Whitney U test, ***P < 0.001, n = 28 (AGS) and n = 15 (controls). (D) Effect of removing α-Gal from the TE in patients with AGS (left, n = 10) and individuals acting as healthy controls (right, n = 13), Wilcoxon matched-pairs signed rank test, *P < 0.05. (E) B cell proliferation in response to different doses of TE in patients with AGS, Friedman test with Dunn’s multiple comparisons test, **P < 0.01, ***P < 0.001, n = 22. (F) Effect of inhibition with anti-CD40L and anti-IL-4 antibodies in patients with AGS, Friedman test with Dunn’s multiple comparisons test, **P < 0.01, n = 16. (G) Comparison of B cell proliferation in unstimulated cells and cells stimulated with an α-Gal containing nontick protein in patients with AGS (left, n = 20) and individuals acting as healthy controls (right, n = 10), Wilcoxon matched-pairs signed rank test, *P < 0.05. (H) Comparison of proliferation in naive (CD27-IgD+) and memory (CD27+) B cells in patients with AGS, Wilcoxon matched-pairs signed rank test, n = 28). Each point within the box plot represents 1 individual. Box plots represent IQR and median, whiskers extend to the farthest data points.
Figure 6
Figure 6. Patient antibody responses to TE.
(A) Binding of a serum pool sample from a patient with AGS (n = 8) in a Western blot. MM = molecular marker, TE = tick extract, deglycoTE = deglycosylated TE, Enz. = α-galactosidase from green coffee bean. (B) Inhibition of IgE and IgG1 antibody binding to tick extract by α-Gal in patients with AGS. Wilcoxon matched-pairs signed-rank test, ***P < 0.001, for IgE n = 14, for IgG1 n = 23. Each pair of points connected by a line represents 1 individual. (C) Correlation of the inhibition of IgE and IgG1 antibody binding to TE by α-Gal. Spearman’s correlation coefficient ρ = 0.609, P < 0.05, n = 14. Each point represents 1 individual.

References

    1. Swei A, et al. Patterns, drivers, and challenges of vector-borne disease emergence. Vector Borne Zoonotic Dis. 2020;20(3):159–170. doi: 10.1089/vbz.2018.2432. - DOI - PMC - PubMed
    1. Rochlin I, Toledo A. Emerging tick-borne pathogens of public health importance: a mini-review. J Med Microbiol. 2020;69(6):781–791. doi: 10.1099/jmm.0.001206. - DOI - PMC - PubMed
    1. Kitsou C, et al. Tick host immunity: vector immunomodulation and acquired tick resistance. Trends Immunol. 2021;42(7):554–574. doi: 10.1016/j.it.2021.05.005. - DOI - PMC - PubMed
    1. Van Nunen SA, et al. An association between tick bite reactions and red meat allergy in humans. Med J Aust. 2009;190(9):510–511. doi: 10.5694/j.1326-5377.2009.tb02533.x. - DOI - PubMed
    1. Hamsten C, et al. Red meat allergy in Sweden: association with tick sensitization and B-negative blood groups. J Allergy Clin Immunol. 2013;132(6):1431–1434. doi: 10.1016/j.jaci.2013.07.050. - DOI - PMC - PubMed

Publication types

Supplementary concepts