. 2023 Mar 1;133(5):e161593.
doi: 10.1172/JCI161593.

Antigen specificity and cross-reactivity drive functionally diverse anti-Aspergillus fumigatus T cell responses in cystic fibrosis

Affiliations

Antigen specificity and cross-reactivity drive functionally diverse anti-Aspergillus fumigatus T cell responses in cystic fibrosis

Carsten Schwarz et al. J Clin Invest. .

Abstract

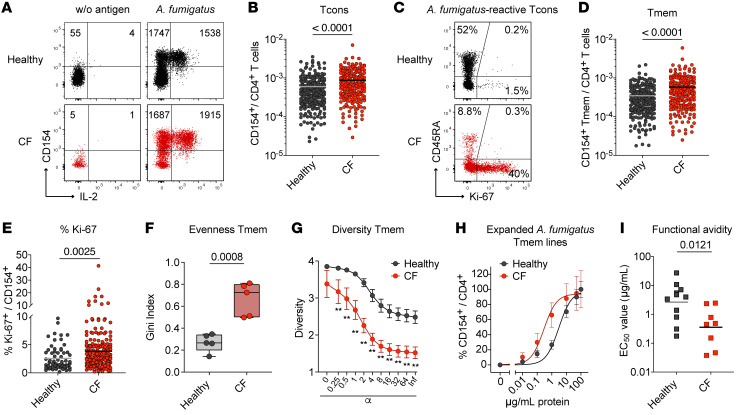
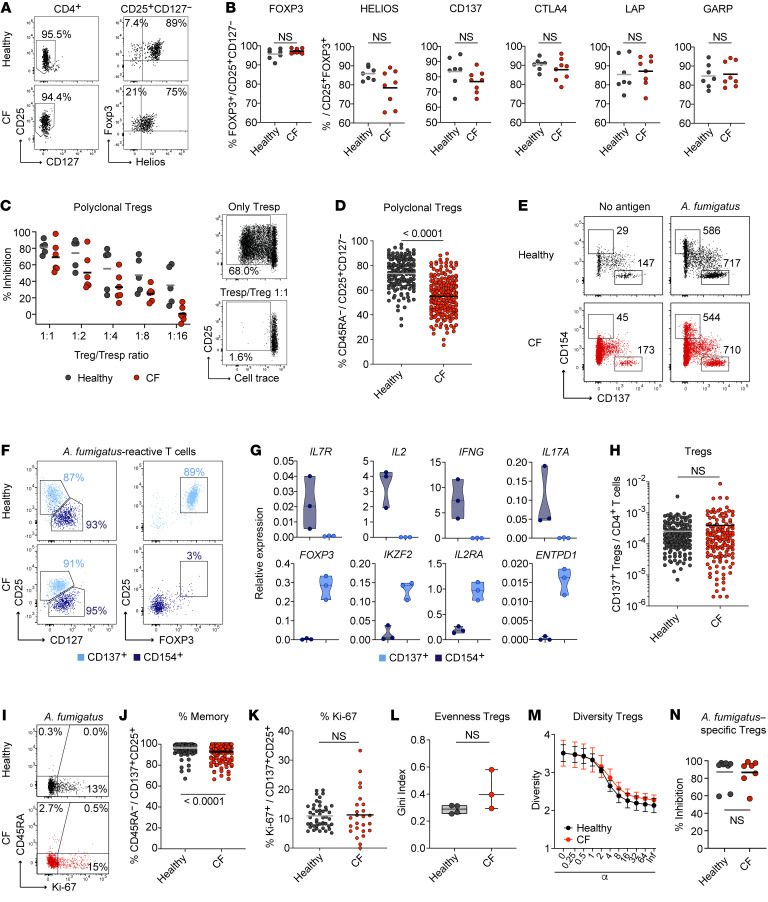
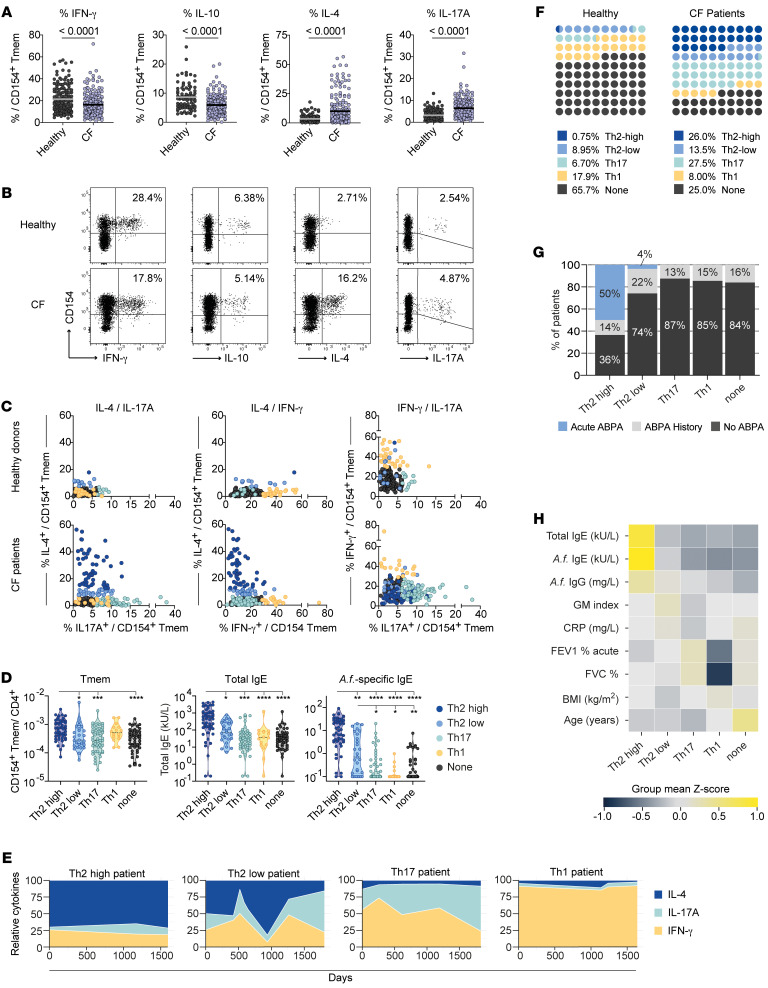
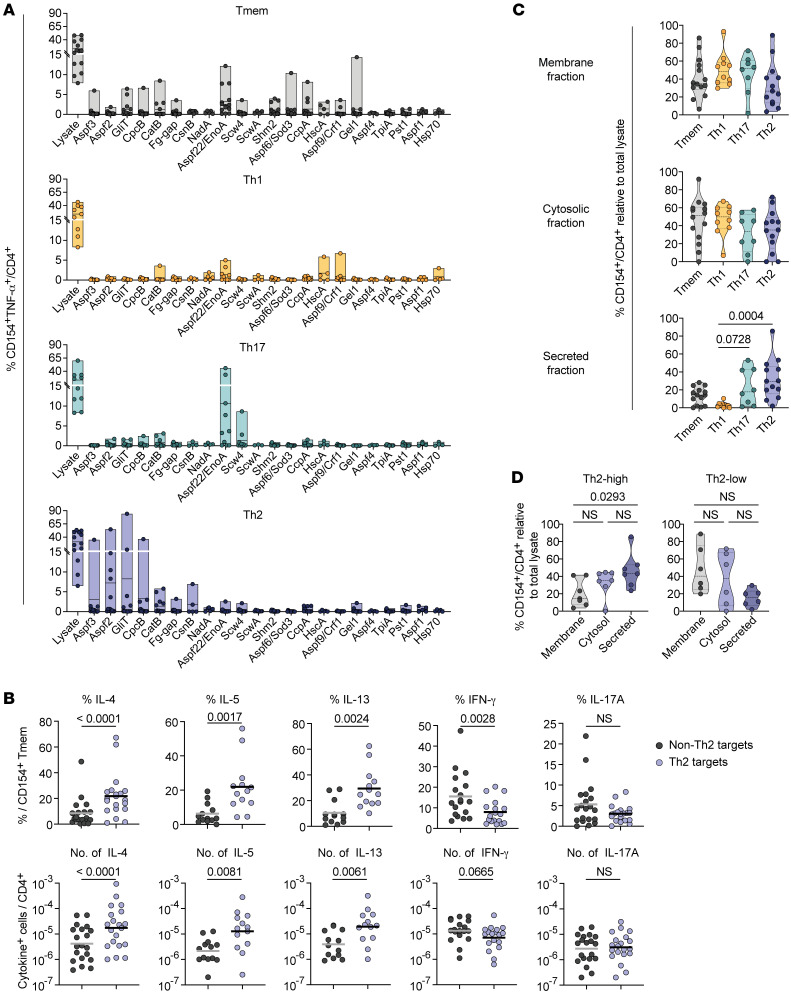
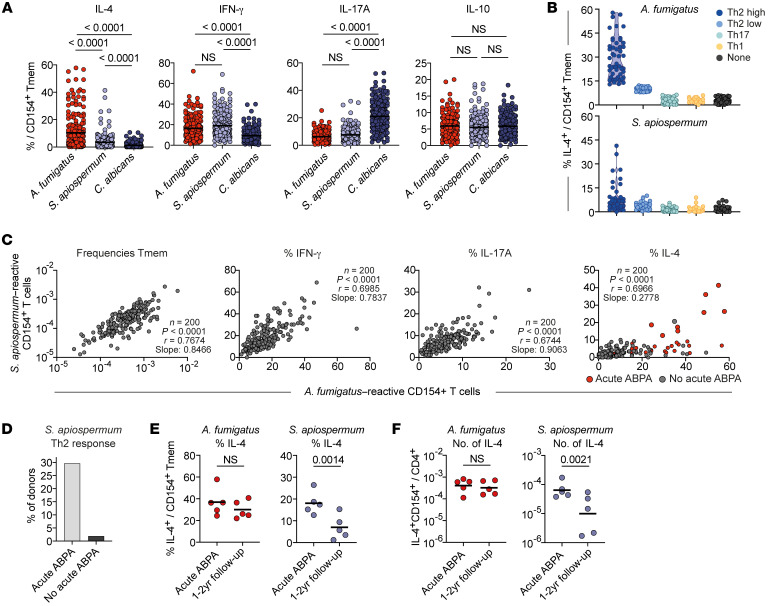
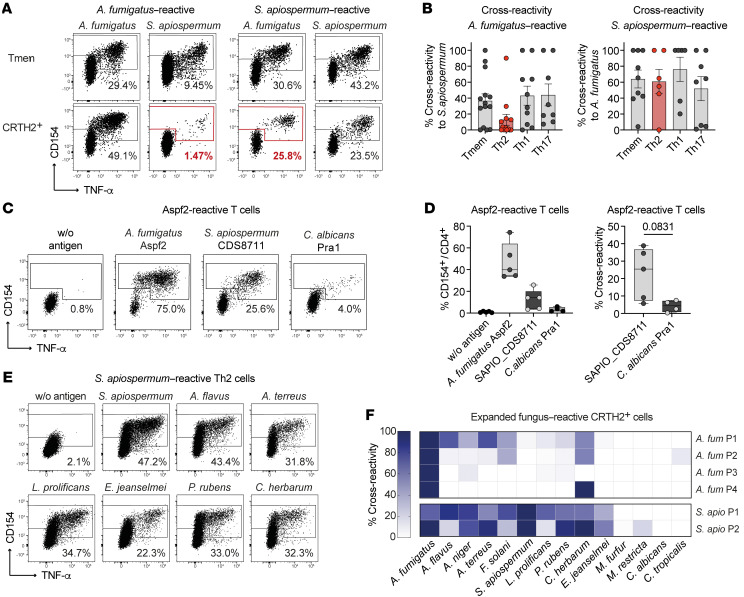
BACKGROUNDThe fungus Aspergillus fumigatus causes a variety of clinical phenotypes in patients with cystic fibrosis (pwCF). Th cells orchestrate immune responses against fungi, but the types of A. fumigatus-specific Th cells in pwCF and their contribution to protective immunity or inflammation remain poorly characterized.METHODSWe used antigen-reactive T cell enrichment (ARTE) to investigate fungus-reactive Th cells in peripheral blood of pwCF and healthy controls.RESULTSWe show that clonally expanded, high-avidity A. fumigatus-specific effector Th cells, which were absent in healthy donors, developed in pwCF. Individual patients were characterized by distinct Th1-, Th2-, or Th17-dominated responses that remained stable over several years. These different Th subsets target different A. fumigatus proteins, indicating that differential antigen uptake and presentation directs Th cell subset development. Patients with allergic bronchopulmonary aspergillosis (ABPA) are characterized by high frequencies of Th2 cells that cross-recognize various filamentous fungi.CONCLUSIONOur data highlight the development of heterogenous Th responses targeting different protein fractions of a single fungal pathogen and identify the development of multispecies cross-reactive Th2 cells as a potential risk factor for ABPA.FUNDINGGerman Research Foundation (DFG), under Germany's Excellence Strategy (EXC 2167-390884018 "Precision Medicine in Chronic Inflammation" and EXC 2051-390713860 "Balance of the Microverse"); Oskar Helene Heim Stiftung; Christiane Herzog Stiftung; Mukoviszidose Institut gGmb; German Cystic Fibrosis Association Mukoviszidose e.V; German Federal Ministry of Education and Science (BMBF) InfectControl 2020 Projects AnDiPath (BMBF 03ZZ0838A+B).

Keywords: Adaptive immunity; Fungal infections; Immunology; Pulmonology.


Figures

Figure 1
Figure 1. A. fumigatus–reactive conventional CD4+ T cell responses in pwCF.
(A) Dot plot examples for the ex vivo detection of A. fumigatus–reactive CD4+ T cells by ARTE. PBMCs (1 × 10⁷) were stimulated with A. fumigatus or left unstimulated. Cell counts before and after magnetic CD154+ enrichment are indicated in the plots. (B) Frequencies of A. fumigatus–reactive CD154+CD4+ T cells in healthy donors (n = 220) and pwCF (n = 200). (C) CD45RA and Ki-67 staining of A. fumigatus–reactive CD154+ T cells. The percentage of marker-positive cells within the CD154+ population is indicated. (D) Frequencies of A. fumigatus–reactive CD154+CD45RAmemory CD4+ T cells (Tmem) in healthy donors (n = 220) and pwCF (n = 200). (E) Ki-67 expression of A. fumigatus–reactive CD154+ T cells (healthy individuals, n = 65; pwCF, n = 200). (F and G) TCR-β sequence analysis of the top 50 expanded A. fumigatus–specific T cell clones from healthy individuals and pwCF (n = 5 for both). (F) Gini index depicting the distribution of TCR sequences (0 is total equality, i.e., all clones have the same proportion; 1 is total inequality, i.e., a population dominated by a single clone). (G) Rényi diversity profiles. Values of α = 0, 1, 2, and infinite, correspond to the richness, Shannon diversity, Simpson diversity, and Berger-Parker index, respectively. The sample with the highest value at α = 0 has the highest richness, but the lower value at α = infinite indicates a higher proportion of the most abundant sequence, i.e., lower population diversity. A sample with a profile that is overall higher than the profiles of other samples is therefore more diverse. (H and I) A. fumigatus–reactive CD154+ Tmem cells from healthy donors (n = 11) and pwCF (n = 8) were FACS purified, expanded, and restimulated in the presence of autologous FastDCs derived from blood monocytes. (H) Dose-response curves of expanded T cell lines, restimulated with decreasing antigen concentrations. (I) EC50 values were calculated from dose-response curves. Each symbol in B, D–F, and I represents 1 donor; horizontal lines indicate the mean in B, D, and E and the geometric mean in I. Box-and-whisker plots display quartiles and range in F. Data indicate the mean ± SEM in G and H. Statistical differences were determined by 2-tailed Mann-Whitney U test in B, D, E, and I; 2-tailed, unpaired t test in F; and Kruskal-Wallis test in G.
Figure 2
Figure 2. A. fumigatus–reactive regulatory CD4+ T cell responses in pwCF.
(A) Dot plot examples of purified CD25+CD127 Tregs from PBMCs of healthy controls or pwCF. (B) Purified CD25+CD127 Tregs were stimulated with PMA/ionomycin and analyzed for the expression of Foxp3, Helios, CD137, CTLA4, LAP, and GARP by flow cytometry. (C) In vitro suppression assay with polyclonal Tregs from healthy controls or pwCF. Ex vivo–isolated Tregs were combined with proliferation dye–labeled allogeneic CD4+ Tresp cells at different Treg to Tresp ratios. Cells were stimulated polyclonally with CD3/CD28 beads. The percentage of inhibition of Tresp proliferation is shown for healthy controls (n = 5) and pwCF (n = 6). Right: Dot plot examples, with the numbers indicating the percentage of Tresp proliferation. (D) Percentage of memory cells within polyclonal CD25+CD127 Tregs from healthy controls (n = 149) or pwCF (n = 200). (E) Representative dot plot examples for the parallel ex vivo detection of A. fumigatus–reactive CD4+ Tcons (CD154+) and Tregs (CD137+) by ARTE. PBMCs (1 × 10⁷) were stimulated with A. fumigatus or left unstimulated, and cell counts before and after combined magnetic CD154+CD137+ enrichment are indicated. (F) Overlayed flow-cytometric analysis of A. fumigatus–specific CD154+ and CD137+ cells. Numbers indicate the percentages among CD137+CD4+ T cells (light blue) and CD154+CD4+ T cells (dark blue). (G) A. fumigatus–reactive CD137+ and CD154+ Tmem cells (n = 3) were purified by FACS and analyzed for gene expression by real-time PCR. Data were normalized to GAPDH gene expression. (H) Frequencies of A. fumigatus–reactive CD137+ Tregs from healthy donors (n = 161) and pwCF (n = 135). (I) CD45RA and Ki-67 staining of A. fumigatus–reactive CD137+ Tregs. The percentage of marker-positive cells within CD137+CD25+ Tregs is indicated. (J) Percentage of memory cells within A. fumigatus–reactive CD137+ Tregs (healthy donors, n = 161; pwCF, n = 135). (K) Ki-67 expression of A. fumigatus–reactive CD137+ Tregs (healthy donors, n = 46; pwCF, n = 25). (L and M) TCR-β sequence analysis of the top 50 expanded A. fumigatus–specific Treg clones from healthy individuals (n = 4) and pwCF (n = 3). (L) Gini index depicting the distribution of TCR sequences. (M) Rényi diversity profiles. (N) In vitro suppression assay with ex vivo–isolated A. fumigatus–reactive Tregs. A. fumigatus–reactive CD137+ Tregs were combined with proliferation dye–labeled allogeneic responder CD4+ T cells (Tresp) at a Treg to Tresp ratio of 1:4. Cells were stimulated polyclonally with CD3/CD28 beads. The percentage of inhibition of Tresp proliferation is shown for healthy controls (n = 8) and pwCF (n = 7). Each symbol in BD, G, H, JL, and N represents 1 donor; horizontal lines indicate the mean in BD, H, J, K, and M. Truncated violin plots with quartiles and range are shown in G. Box-and-whisker plots display the quartiles and range in L. Data indicate the mean ± SEM in M. Statistical differences were determined by 2-tailed Mann-Whitney U test in B, D, H, J, K, and N and by 2-tailed, unpaired t test in L.
Figure 3
Figure 3. Different T cell reactivity pattern against A. fumigatus in pwCF.
(A) Ex vivo cytokine production of A. fumigatus–reactive CD154+ Tmem cells from healthy donors (IFN-γ, n = 158; IL-17A, n = 158; IL-4, n = 134; IL-10, n = 87) and pwCF (n = 200). (B) Representative dot plots for ex vivo cytokine staining of A. fumigatus–stimulated cells following ARTE. The percentage of cytokine-producing cells within CD154+ Tmem cells is indicated. (C) Direct comparison of A. fumigatus–reactive cytokine production for healthy donors (n = 134) and pwCF (n = 200). Cut-off values for cytokine-producing cells within CD154+ Tmem cells were determined by ROC analysis (see Supplemental Figure 2). Donors whose cell percentages exceeded the cut-off are color coded (yellow: IFN-γ ≥29%; light green: IL-17A ≥6.1%; light blue: IL-4lo ≥6.9%; dark blue: IL-4hi ≥12.9%. (D) Frequencies of A. fumigatus–reactive Tmem cells, as well as total and specific IgE levels for pwCF within the different A. fumigatus–specific T cell reactivity groups. (E) Representative plots depicting the stability of the different A. fumigatus–specific cytokine reactivity patterns. A. fumigatus–reactive T cells of pwCF were monitored at least 4 times over a period of up to 4 years. Relative expression of IFN-γ, IL-17A, and IL-4 within the CD154+ Tmem population is shown. (F) Distribution of the different A. fumigatus–specific cytokine reactivity patterns for healthy donors and pwCF. The percentages of donors in each group are indicated. (G) Incidence of ABPA in the different A. fumigatus–specific T cell reactivity groups. The percentages indicate patients with acute ABPA, a history of ABPA, or who never had ABPA at the time the measurement was done. (H) Heatmap depicting the correlation of the different A. fumigatus–reactive T cell groups with clinical parameters. Values were z score normalized for each parameter and are plotted as the mean value for each T cell reactivity group. Each symbol in A, C, and D represents 1 donor; horizontal lines indicate the mean in A. Truncated violin plots with quartiles and range are shown in D. *P < 0.05, **P < 0.01, ***P < 0.001, and ****P < 0.0001, by 2-tailed Mann-Whitney U test (A) and Kruskal-Wallis test with Dunn’s post hoc test (D).
Figure 4
Figure 4. A. fumigatus–reactive Th cell subsets recognize different protein targets.
(A) PBMCs from pwCF (n = 8–14) were stimulated with whole A. fumigatus lysate, and reactive CD154+ Tmem, Th1 (IFN-γ+), Th17 (IL-17A+), or Th2 (CRTH2+) cells were FACS sorted, expanded, and restimulated with a panel of single A. fumigatus proteins. Reactivity is indicated as the percentage of CD154+TNF-α+ within CD4+ T cells. (B) Th2 target proteins (Aspf2, Aspf3, CpcB, CatB, Fg-gap, GliT) and non-Th2 target proteins (Scw4, Aspf22, Pst1, Shm2, CcpA, TpiA, Crf1, Sod3) were pooled and used for ex vivo stimulation of PBMCs from A. fumigatus–sensitized pwCF. Relative cytokine production within reactive CD154+ Tmem cells (upper plots) and absolute frequencies of cytokine producers within CD4+ T cells (lower plots) are shown (IL-4, IFN-γ, IL-17A, n = 20; IL-5, IL-13, n = 13). (C) A. fumigatus–reactive T cell lines were generated as in A and restimulated with different A. fumigatus antigen extracts in the presence of autologous FastDCs derived from blood monocytes. Reactivity in relation to restimulation with the initially used total A. fumigatus lysate is shown. (D) Reactivity of expanded CD154+ Tmem cells from Th2-high (n = 7) or Th2-low (n = 6) patients to the different A. fumigatus protein fractions. Each symbol in AD represents 1 donor; horizontal lines indicate the mean in upper plots and the geometric mean in lower plots of B; truncated violin plots with the quartiles and range are shown in C and D. Statistical differences were determined by 2-tailed, paired Wilcoxon rank test in B. and by Kruskal-Wallis test with Dunn’s post hoc test in C and D.
Figure 5
Figure 5. A. fumigatus is a major fungal Th2 driver in pwCF.
(A) Ex vivo cytokine production of CD154+ Tmem cells with reactivity against different fungal pathogens in pwCF (n = 200). (B) IL-4 expression within A. fumigatus– or S. apiospermum–reactive Tmem cells of pwCF within the different A. fumigatus–defined T cell reactivity groups. (C) Spearman’s correlation between A. fumigatus– and S. apiospermum–reactive T cell frequencies and cytokine production. (D) Percentages of patients with or without acute ABPA among patients with an increased IL-4 response to S. apiospermum. (E and F) Five patients with acute ABPA and an increased Th2 response against S. apiospermum were reanalyzed after 1–2 years. (E) Relative IL-4 production within reactive CD154+ Tmem cells and (F) absolute frequencies of IL-4 producers within CD4+ T cells. Each symbol in AC, E, and F represents 1 donor; horizontal lines indicate the mean in A and E and the geometric mean in F. Truncated violin plots with the quartiles and range are shown in B. Statistical differences were determined by Kruskal-Wallis test with Dunn’s post hoc test in A and by 2-tailed, paired t test in E and F.
Figure 6
Figure 6. A. fumigatus is a major fungal Th2 driver in pwCF.
(A and B) A. fumigatus–reactive (n = 8–14) or S. apiospermum–reactive (n = 6–9) CD154+ Tmem, Th1 (IFN-γ+), Th17 (IL-17A+), or Th2 (CRTH2+) cells from pwCF were FACS sorted, expanded, and restimulated with both fungal extracts. (A) Representative restimulation of expanded T cell lines. Percentages of CD154+TNF-α+ within CD4+ T cells are indicated in the plots. (B) Percentage of cross-reactivity of initially A. fumigatus–stimulated cells to S. apiospermum (left plot) and vice versa (right plot). Each symbol represents 1 donor, and data indicate the mean ± SEM. (C and D) PBMCs from Th2-high pwCF were ex vivo stimulated with A. fumigatus Aspf2. Reactive CD154+ Tmem cells were FACS purified, expanded, and restimulated in the presence of autologous FastDCs with Aspf2 or orthologous proteins from S. apiospermum (UniProtKD A0A084G096) or C. albicans (pH-regulated antigen Pra1 UniProtKB P87020). (C) Dot plot examples of restimulation. Cells were gated on CD4+ T cells, and the percentages of CD154+TNF-α+ T cells are indicated. (D) Percentage of cross-reactivity of Aspf2-reactive cells to the orthologous proteins of S. apiospermum and C. albicans. (E and F) Expanded A. fumigatus–reactive (n = 4) or S. apiospermum–reactive (n = 2) Th2 cells were restimulated with various fungal species. (E) Dot plot examples showing the restimulation of S. apiospermum–reactive Th2 cells with various fungal lysates. The percentages of CD154+ Th cells within CD4+ T cells are indicated in the plots. (F) The percentage of cross-reactivity in relation to total reactivity after restimulation with the specific fungal lysate is shown. Each row of the heatmap indicates 1 patient. Each symbol in B and D represents 1 donor; data indicate the mean ± SEM in B. Box-and-whisker plots display the quartiles and range in D.

Similar articles

Cited by

References

    1. Cowley AC, et al. Aspergillosis and the role of mucins in cystic fibrosis. Pediatr Pulmonol. 2017;52(4):548–555. doi: 10.1002/ppul.23618. - DOI - PMC - PubMed
    1. Park SJ, Mehrad B. Innate immunity to Aspergillus species. Clin Microbiol Rev. 2009;22(4):535–551. doi: 10.1128/CMR.00014-09. - DOI - PMC - PubMed
    1. Bacher P, et al. Regulatory T cell specificity directs tolerance versus allergy against aeroantigens in humans. Cell. 2016;167(4):1067–1078. doi: 10.1016/j.cell.2016.09.050. - DOI - PubMed
    1. Bacher P, et al. Antigen-specific expansion of human regulatory T cells as a major tolerance mechanism against mucosal fungi. Mucosal Immunol. 2014;7(4):916–928. doi: 10.1038/mi.2013.107. - DOI - PubMed
    1. Emerson J, et al. Pseudomonas aeruginosa and other predictors of mortality and morbidity in young children with cystic fibrosis. Pediatr Pulmonol. 2002;34(2):91–100. doi: 10.1002/ppul.10127. - DOI - PubMed

Publication types

Substances