Determinants of gait dystonia severity in cerebral palsy
- PMID: 36701240
- PMCID: PMC10392706
- DOI: 10.1111/dmcn.15524
Determinants of gait dystonia severity in cerebral palsy
Abstract
Aim: To determine the movement features governing expert assessment of gait dystonia severity in individuals with cerebral palsy (CP).
Method: In this prospective cohort study, three movement disorder neurologists graded lower extremity dystonia severity in gait videos of individuals with CP using a 10-point Likert-like scale. Using conventional content analysis, we determined the features experts cited when grading dystonia severity. Then, using open-source pose estimation techniques, we determined gait variable analogs of these expert-cited features correlating with their assessments of dystonia severity.
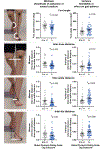
Results: Experts assessed videos from 116 participants (46 with dystonia aged 15 years [SD 3] and 70 without dystonia aged 15 years [SD 2], both groups ranging 10-20 years old and 50% male). Variable limb adduction was most commonly cited by experts when identifying dystonia, comprising 60% of expert statements. Effect on gait (regularity, stability, trajectory, speed) and dystonia amplitude were common features experts used to determine dystonia severity, comprising 19% and 13% of statements respectively. Gait variables assessing adduction variability and amplitude (inter-ankle distance variance and foot adduction amplitude) were significantly correlated with expert assessment of dystonia severity (multiple linear regression, p < 0.001).
Interpretation: Adduction variability and amplitude are quantifiable gait features that correlate with expert-determined gait dystonia severity in individuals with CP. Consideration of these features could help optimize and standardize the clinical assessment of gait dystonia severity in individuals with CP.
© 2023 Mac Keith Press.
Figures


Comment in
-
Future directions for the assessment of gait dystonia in cerebral palsy.Dev Med Child Neurol. 2023 Jul;65(7):865-866. doi: 10.1111/dmcn.15523. Epub 2023 Jan 30. Dev Med Child Neurol. 2023. PMID: 36717760 No abstract available.
References
-
- Eggink H, Kremer D, Brouwer OF, et al. Spasticity, dyskinesia and ataxia in cerebral palsy: Are we sure we can differentiate them? European Journal of Paediatric Neurology 2017; 21: 703–706. - PubMed
-
- Rice J, Skuza P, Baker F, Russo R, Fehlings D. Identification and measurement of dystonia in cerebral palsy. Dev Med Child Neurol 2017; 59: 1249–55. - PubMed
-
- Steeves T, Day L, Dykeman J, Jette N, Pringsheim T. The prevalence of primary dystonia: a systematic review and meta-analysis. Mov Disord 2012; 27: 1789–96. - PubMed
Publication types
MeSH terms
Grants and funding
LinkOut - more resources
Full Text Sources
Medical
Miscellaneous

