. 2023 Jan 26;21(1):e3001969.
doi: 10.1371/journal.pbio.3001969. eCollection 2023 Jan.

FMRP activity and control of Csw/SHP2 translation regulate MAPK-dependent synaptic transmission

Affiliations

FMRP activity and control of Csw/SHP2 translation regulate MAPK-dependent synaptic transmission

Shannon N Leahy et al. PLoS Biol. .

Abstract

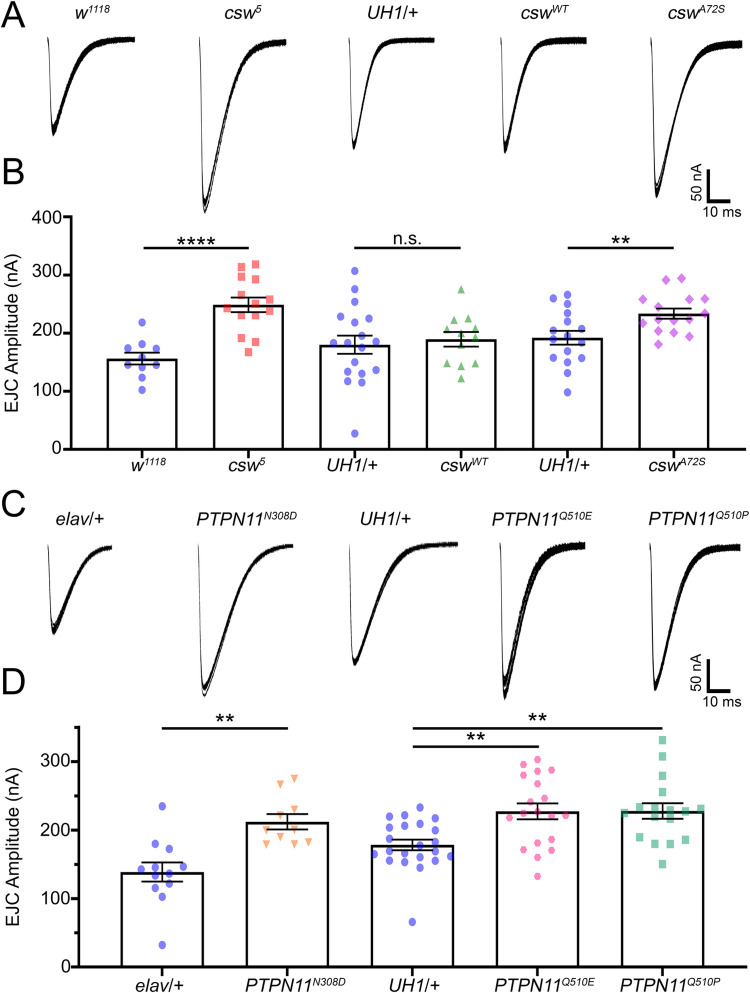
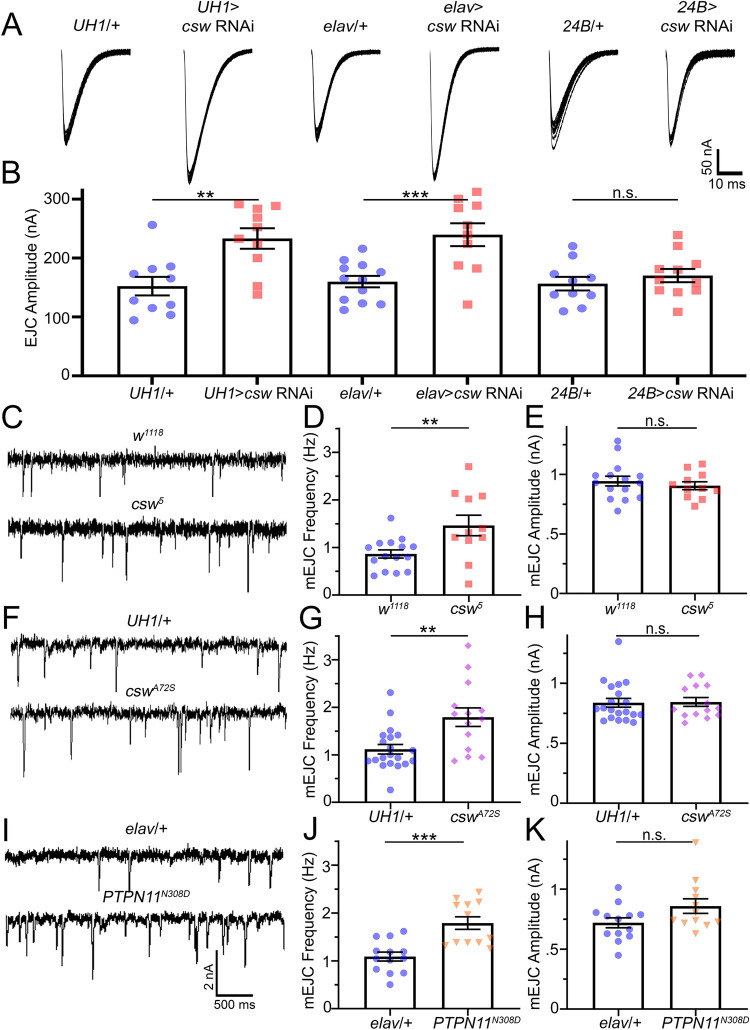
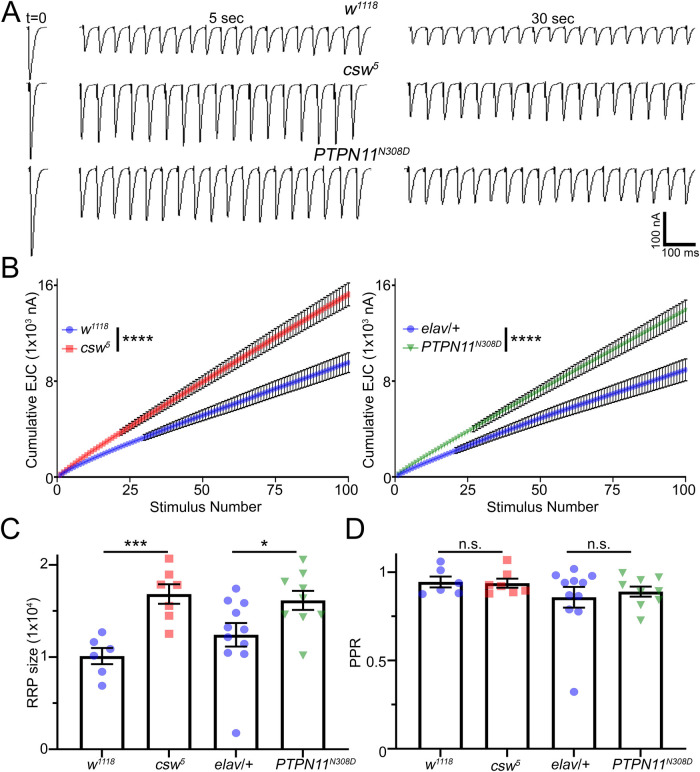
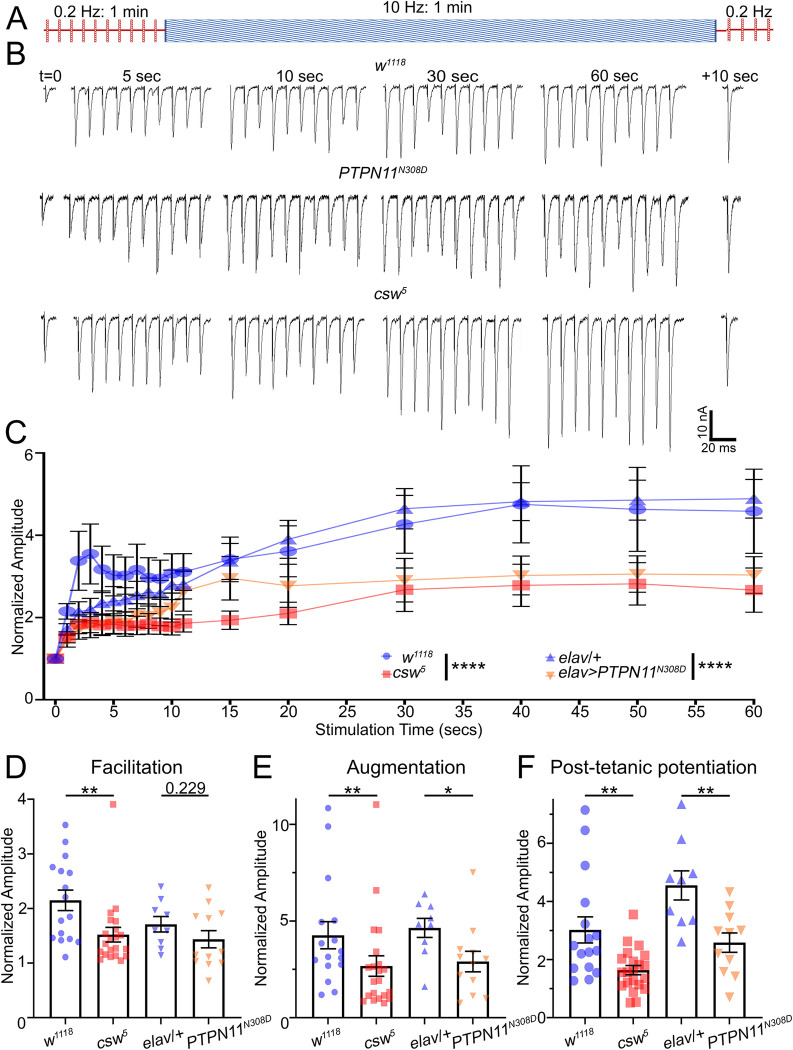
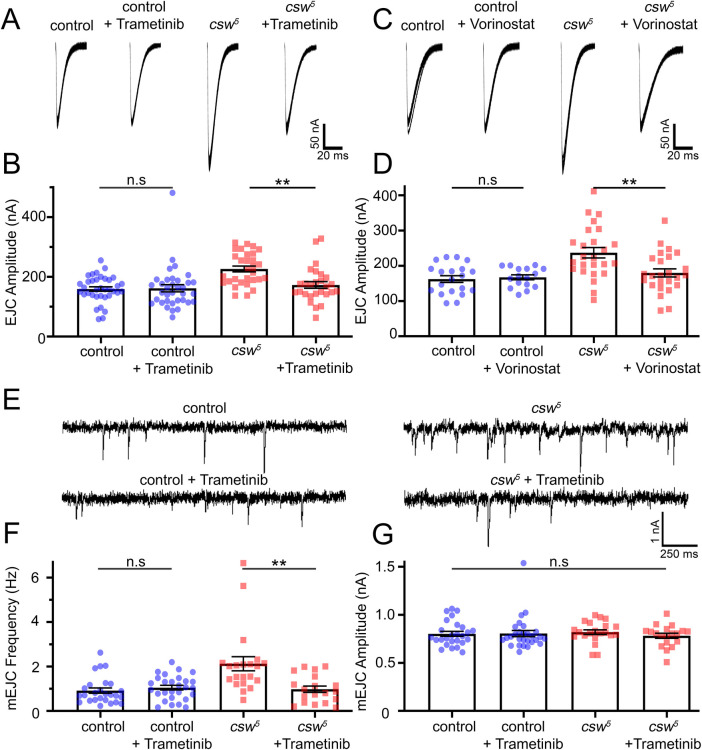
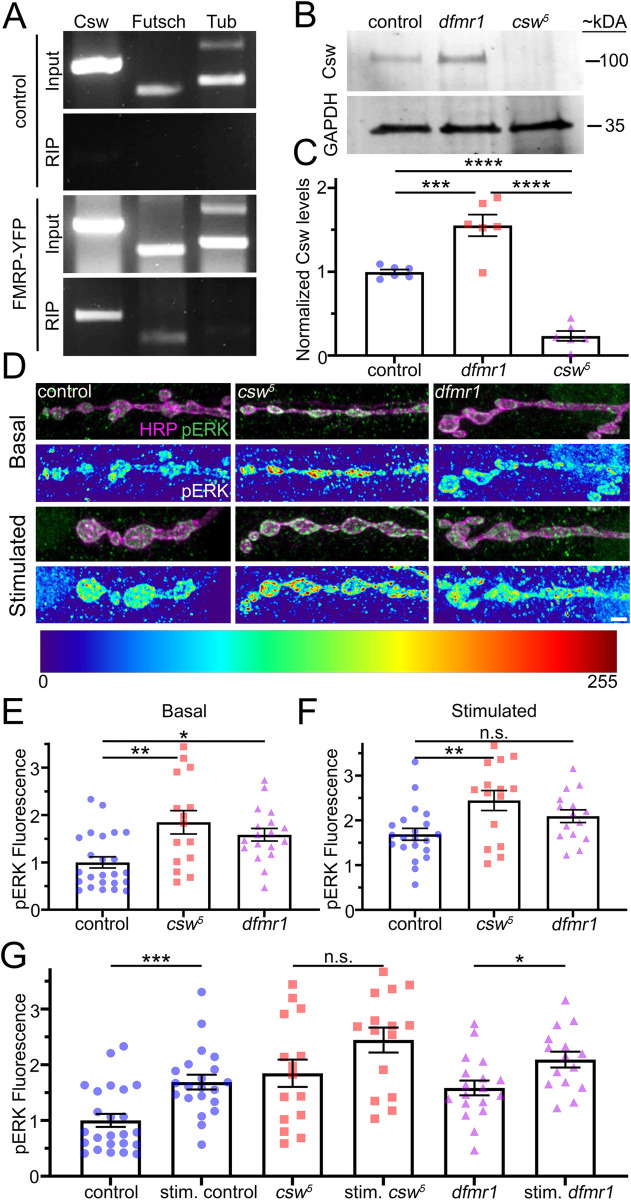
Noonan syndrome (NS) and NS with multiple lentigines (NSML) cognitive dysfunction are linked to SH2 domain-containing protein tyrosine phosphatase-2 (SHP2) gain-of-function (GoF) and loss-of-function (LoF), respectively. In Drosophila disease models, we find both SHP2 mutations from human patients and corkscrew (csw) homolog LoF/GoF elevate glutamatergic transmission. Cell-targeted RNAi and neurotransmitter release analyses reveal a presynaptic requirement. Consistently, all mutants exhibit reduced synaptic depression during high-frequency stimulation. Both LoF and GoF mutants also show impaired synaptic plasticity, including reduced facilitation, augmentation, and post-tetanic potentiation. NS/NSML diseases are characterized by elevated MAPK/ERK signaling, and drugs suppressing this signaling restore normal neurotransmission in mutants. Fragile X syndrome (FXS) is likewise characterized by elevated MAPK/ERK signaling. Fragile X Mental Retardation Protein (FMRP) binds csw mRNA and neuronal Csw protein is elevated in Drosophila fragile X mental retardation 1 (dfmr1) nulls. Moreover, phosphorylated ERK (pERK) is increased in dfmr1 and csw null presynaptic boutons. We find presynaptic pERK activation in response to stimulation is reduced in dfmr1 and csw nulls. Trans-heterozygous csw/+; dfmr1/+ recapitulate elevated presynaptic pERK activation and function, showing FMRP and Csw/SHP2 act within the same signaling pathway. Thus, a FMRP and SHP2 MAPK/ERK regulative mechanism controls basal and activity-dependent neurotransmission strength.


Conflict of interest statement

The authors have declared that no competing interests exist.

Figures

Fig 1
Fig 1. Both loss- and gain-of-function csw/PTPN11 mutants elevate NMJ transmission.
TEVC recordings of nerve-stimulated evoked neurotransmission in both LoF and GoF mutations of Drosophila csw and human PTPN11 mutations from NS/NSML patients. (A) Representative EJC traces for the csw mutant comparisons showing 10 superimposed evoked synaptic responses (1.0 mM Ca2+) from w1118 genetic background control, csw5 null mutant, transgenic driver control (UH1-Gal4/w1118), wild-type csw (UH1-Gal4>cswWT), and cswA72S GoF mutant (UH1-Gal4>cswA72S). (B) Quantification of the mean EJC amplitudes in all 5 genotypes using two-sided t tests. (C) Representative evoked EJC traces for the human patient PTPN11 mutations showing 10 superimposed responses in paired control (elav-Gal4/w1118) and GoF mutant (elav-Gal4>PTPN11N308D; left), and control (UH1-Gal4/w1118) and LoF mutants (UH1-Gal4>PTPN11Q510E and PTPN11Q510P; right). (D) Quantification of the mean EJC amplitudes in all 5 genotypes using two-sided t test, Kruskal–Wallis and Dunn’s multiple comparisons. The scatter plots show all of the individual data points as well as mean ± SEM. N = number of NMJs. Significance shown as: p > 0.05 (not significant, n.s.), p < 0.001 (**) and p < 0.0001 (****). The data underlying this figure can be found in S1 Data. csw, corkscrew; EJC, excitatory junction current; GoF, gain-of-function; LoF, loss-of-function; NMJ, neuromuscular junction; NS, Noonan syndrome; NSML, NS with multiple lentigines; PTPN11, protein tyrosine phosphatase non-receptor type 11; TEVC, two-electrode voltage-clamp.
Fig 2
Fig 2. Targeted neuronal csw knockdown increases presynaptic neurotransmission.
Nerve stimulation–evoked recordings based on csw RNAi expressed ubiquitously (UH1-Gal4) or targeted to neurons (elav-Gal4), or muscles (24B-Gal4). (A) Representative EJC traces showing 10 superimposed responses (1.0 mM Ca+2) from control (UH1-Gal4/TRiP) vs. csw RNAi; control (elav-Gal4/TRiP) vs. csw RNAi; and control (24B-Gal4/TRiP) vs. csw RNAi. (B) Quantification of EJC amplitudes using two-sided t tests. (C) Representative mEJC traces (1.0 mM Ca2+) in genetic background control (w1118, top) and csw5 null (bottom). (D) Quantification of the mEJC frequencies using a two-sided t test. (E) Quantification of the mEJC amplitudes using a two-sided t test. (F) Sample mEJC recordings from the driver control (UH1-Gal4/w1118; top) compared to cswA72S GoF (UH1-Gal4>cswA72S; bottom). (G) Quantification of the mEJC frequencies using a two-sided t test. (H) Quantification of mEJC amplitudes using Mann–Whitney test. (I) Sample mEJC recordings in control (elav-Gal4/w1118; top) compared to PTPN11N308D GoF (elav-Gal4>PTPN11N308D; bottom). (J) Quantification of the mEJC frequency using a Mann–Whitney test. (K) Quantification of mEJC amplitude using a Mann–Whitney test. Scatter plots show all the data points and mean ± SEM. N = number of NMJs. Significance: p > 0.05 (not significant, n.s.), p < 0.05 (*), p < 0.001 (**), and p < 0.0001 (***). The data underlying this figure can be found in S1 Data. csw, corkscrew; EJC, excitatory junction current; mEJC, miniature EJC; NMJ, neuromuscular junction; RNAi, RNA interference.
Fig 3
Fig 3. HFS transmission depression ameliorated in csw nulls.
Prolonged HFS drives progressive synaptic amplitude depression over several minutes of continuous recording at 20 Hz (1mM Ca+2). (A) Representative nerve-stimulated EJC traces at the basal frequency (t = 0) and indicated time points during the HFS train for genetic background control (w1118, top), csw null (csw5, middle), and PTPN11N308D GoF mutant (elav-Gal4>PTPN11N308D; bottom). (B) Quantification of cumulative EJC amplitudes over the first 100 stimulations via nonlinear regression exponential for each pair tested using extra sum-of-squares F tests. (C) Quantification of the RRP of w1118 and csw5 (two-sided t test) and elav-Gal4/w1118 and PTPN11N308D (Mann–Whitney). (D) Quantification of the PPR of w1118 and csw5 (two-sided t test) and elav-Gal4/w1118 and PTPN11N308D (Mann–Whitney). Scatter plots show all data points and mean ± SEM. N = number of NMJs. Significance: p < 0.05 (*), p < 0.001 (**), p < 0.001 (***), and p < 0.0001 (****). The data underlying this figure can be found in S1 Data. csw, corkscrew; EJC, excitatory junction current; HFS, high-frequency stimulation; NMJ, neuromuscular junction; PPR, paired-pulse ratio; RRP, readily releasable pool.
Fig 4
Fig 4. Activity-dependent synaptic plasticity repressed in csw/PTPN11 mutants.
Synaptic plasticity during and following a short-term stimulation train to measure facilitation, augmentation, and PTP. (A) Stimulation paradigm: 1 minute at 0.2 Hz (0.2 mM Ca2+), followed by 1 minute at 10 Hz, and then a return to 0.2 Hz. (B) Sample EJC traces at indicated time points during and following the 10 Hz train for control (w1118, top), GoF PTPN11N308D (elav-Gal4>PTPN11N308D; middle), and csw null (csw5, bottom). (C) Quantification of EJC amplitude during the 10-Hz train normalized to basal EJC amplitude for each genotype. The nonlinear regression exponential for each pair tested using extra sum-of-squares F test. (D-F) Quantification of facilitation (1 second, D) and augmentation (30 seconds, E) during the 10-Hz train, and PTP (10 seconds following train, F) normalized to the basal EJC amplitude for each genotype using Mann–Whitney/two-sided t tests. Scatter plots show all data points and mean ± SEM. N = number of NMJs. Significance: p < 0.05 (*), p < 0.001 (**), and p < 0.0001 (****). The data underlying this figure can be found in S1 Data. csw, corkscrew; EJC, excitatory junction current; GoF, gain-of-function; NMJ, neuromuscular junction; PTP, post-tetanic potentiation; PTPN11, protein tyrosine phosphatase non-receptor type 11.
Fig 5
Fig 5. Reducing pERK signaling restores synaptic function in csw nulls.
TEVC recordings with and without two pERK inhibiting drugs (Trametinib and Vorinostat) comparing the genetic background control (w1118) and csw null mutant (csw5). (A) Representative EJC traces showing 10 superimposed responses (1.0 mM Ca+2) comparing the control (left) and csw5 null mutant (right), with and without Trametinib. (B) Quantification of mean EJC amplitudes for all 4 conditions using Kruskal–Wallis followed by Dunn’s multiple comparisons. (C) Representative EJC traces comparing the control (left) and csw5 null mutant (right), with and without Vorinostat. (D) Quantification of EJC amplitudes for all 4 conditions using one-way ANOVA followed by Tukey’s multiple comparisons. (E) Representative mEJC traces (1.0 mM Ca2+) in the w1118 control (left) and csw5 null mutant (right), with and without Trametinib. (F) Quantification of mEJC frequency in all 4 conditions using a Kruskal–Wallis followed by Dunn’s multiple comparisons. (G) Quantification of mEJC amplitudes using a Kruskal–Wallis. Scatter plots show all the data points and the mean ± SEM. N = number of NMJs. Significance: p > 0.05 (not significant, n.s.) and p < 0.001 (**). The data underlying this figure can be found in S1 Data. EJC, excitatory junction current; mEJC, miniature EJC; NMJ, neuromuscular junction; pERK, phosphorylated ERK; TEVC, two-electrode voltage-clamp.
Fig 6
Fig 6. FMRP binds csw mRNA to elevate neuronal Csw and presynaptic pERK levels.
(A) RIP control (Tubby::GFP, top) and FMRP (FMRP::YFP, bottom), with csw, futsch (positive control), and α-tubulin (negative control) RNAs. (B) Western blot for Csw (100 kDa, top) and GAPDH control (35 kDA, bottom) w1118 control, dfmr150M null, and csw5 null. (C) Quantification of Csw levels normalized to GAPDH using one-way ANOVA followed by Tukey’s multiple comparisons. (D) Representative NMJ images of w1118 control, csw5 null, and dfmr150M null colabeled for pERK (green) and presynaptic membrane marker anti-HRP (magenta). pERK fluorescence shown as a heat map. NMJs shown without stimulation (basal, top) and with 90 mM [K+] HFS (high K+, bottom). Scale bar: 2.5 μm. (E) Quantified normalized basal presynaptic anti-pERK fluorescence for all 3 genotypes using one-way ANOVA and Tukey’s multiple comparisons. (F) Quantified normalized stimulated presynaptic anti-pERK fluorescence using one-way ANOVA and Tukey’s multiple comparisons. (G) Quantification of normalized presynaptic pERK levels in all 3 genotypes under basal and stimulated conditions using two-sided t tests. Scatter plots show all data points and mean ± SEM. N = number of animals (C) or NMJS (E-G). Significance: p > 0.05 (not significant, n.s.), p < 0.05 (*), p < 0.001 (**), p > 0.001 (***), and p < 0.0001 (****). The data underlying this figure can be found in S1 Data. csw, corkscrew; FMRP, Fragile X Mental Retardation Protein; GAPDH, glyceraldehyde 3-phosphate dehydrogenase; HFS, high-frequency stimulation; HRP, horseradish peroxidase; NMJ, neuromuscular junction; pERK, phosphorylated ERK; RIP, RNA-immunoprecipitation.

Similar articles

Cited by

References

    1. Noonan JA. Hypertelorism with Turner phenotype. A new syndrome with associated congenital heart disease. Am J Dis Child. 1968. Oct;116(4):373–80. doi: 10.1001/archpedi.1968.02100020377005 - DOI - PubMed
    1. Gelb BD, Tartaglia M. Noonan syndrome and related disorders: dysregulated RAS-mitogen activated protein kinase signal transduction. Hum Mol Genet. 2006. Oct 15;15:R220–6 doi: 10.1093/hmg/ddl197 - DOI - PubMed
    1. Tartaglia M, Gelb BD, Zenker M. Noonan syndrome and clinically related disorders. Best Pract Res Clin Endocrinol Metab. 2011. Feb;25(1):161–79. doi: 10.1016/j.beem.2010.09.002 - DOI - PMC - PubMed
    1. Barford D, Neel BG. Revealing mechanisms for SH2 domain mediated regulation of the protein tyrosine phosphatase SHP-2. Structure. 1998. Mar 15;6(3):249–54. doi: 10.1016/s0969-2126(98)00027-6 - DOI - PubMed
    1. Hof P, Pluskey S, Dhe-Paganon S, Eck MJ, Shoelson SE. Crystal Structure of the Tyrosine Phosphatase SHP-2. Cell. 1998. Feb 20;92(4):441–50. doi: 10.1016/s0092-8674(00)80938-1 - DOI - PubMed

Publication types

MeSH terms

Substances

LinkOut - more resources