

A linear reciprocal relationship between robustness and plasticity in homeostatic biological networks
- PMID: 36701362
- PMCID: PMC9879506
- DOI: 10.1371/journal.pone.0277181
A linear reciprocal relationship between robustness and plasticity in homeostatic biological networks
Abstract
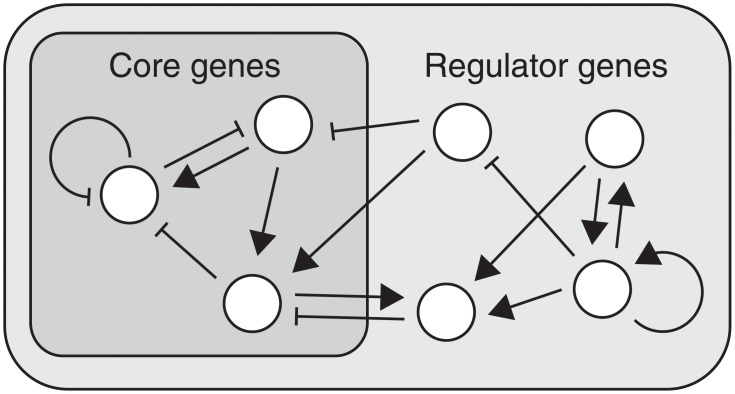
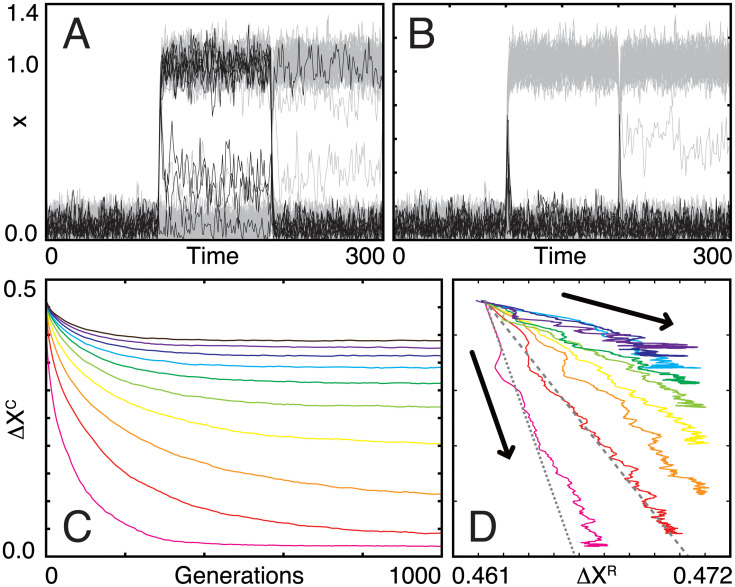
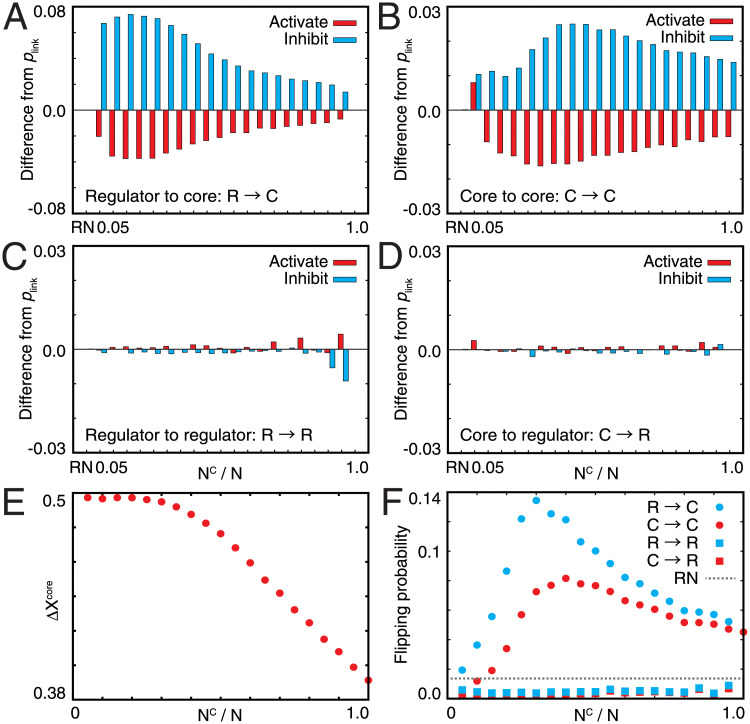
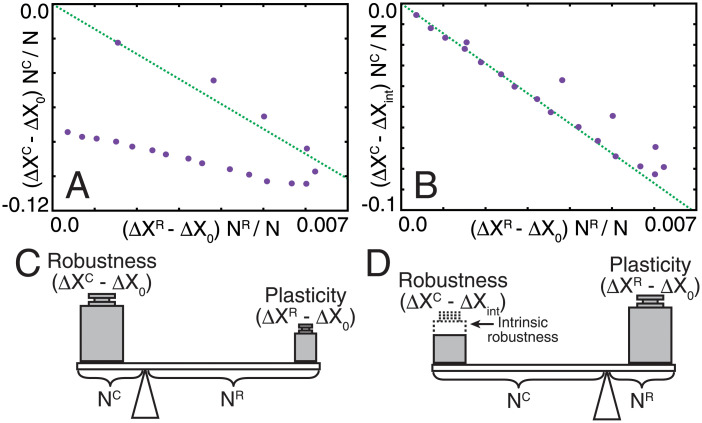
In physics of living systems, a search for relationships of a few macroscopic variables that emerge from many microscopic elements is a central issue. We evolved gene regulatory networks so that the expression of core genes (partial system) is insensitive to environmental changes. Then, we found the expression levels of the remaining genes autonomously increase to provide a plastic (sensitive) response. A feedforward structure from the non-core to core genes evolved autonomously. Negative proportionality was observed between the average changes in core and non-core genes, reflecting reciprocity between the macroscopic robustness of homeostatic genes and plasticity of regulator genes. The proportion coefficient between those genes is represented by their number ratio, as in the "lever principle", whereas the decrease in the ratio results in a transition from perfect to partial adaptation, in which only a portion of the core genes exhibits robustness against environmental changes. This reciprocity between robustness and plasticity was satisfied throughout the evolutionary course, imposing an evolutionary constraint. This result suggests a simple macroscopic law for the adaptation characteristic in evolved complex biological networks.
Copyright: © 2023 Hatakeyama, Kaneko. This is an open access article distributed under the terms of the Creative Commons Attribution License, which permits unrestricted use, distribution, and reproduction in any medium, provided the original author and source are credited.
Conflict of interest statement
The authors have declared that no competing interests exist.
Figures
Similar articles
-
Proportionality between variances in gene expression induced by noise and mutation: consequence of evolutionary robustness.BMC Evol Biol. 2011 Jan 26;11:27. doi: 10.1186/1471-2148-11-27. BMC Evol Biol. 2011. PMID: 21269459 Free PMC article.
-
Phenotypic plasticity and robustness: evolutionary stability theory, gene expression dynamics model, and laboratory experiments.Adv Exp Med Biol. 2012;751:249-78. doi: 10.1007/978-1-4614-3567-9_12. Adv Exp Med Biol. 2012. PMID: 22821462
-
Macroscopic Theory for Evolving Biological Systems Akin to Thermodynamics.Annu Rev Biophys. 2018 May 20;47:273-290. doi: 10.1146/annurev-biophys-070317-033155. Annu Rev Biophys. 2018. PMID: 29792817 Review.
-
Evolution of robustness to damage in artificial 3-dimensional development.Biosystems. 2012 Sep;109(3):498-505. doi: 10.1016/j.biosystems.2012.05.014. Epub 2012 Jun 16. Biosystems. 2012. PMID: 22709976
-
Evolutionary transitions in controls reconcile adaptation with continuity of evolution.Semin Cell Dev Biol. 2019 Apr;88:36-45. doi: 10.1016/j.semcdb.2018.05.014. Epub 2018 May 19. Semin Cell Dev Biol. 2019. PMID: 29778791 Review.
Cited by
-
Single-nuclei multiome ATAC and RNA sequencing reveals the molecular basis of thermal plasticity in Drosophila melanogaster embryos.bioRxiv [Preprint]. 2025 Jan 8:2025.01.08.631745. doi: 10.1101/2025.01.08.631745. bioRxiv. 2025. PMID: 39829925 Free PMC article. Preprint.
References
-
- Wagner A. Robustness and evolvability in living systems. Princeton(NJ): Princeton University Press; 2005.
Publication types
MeSH terms
LinkOut - more resources
Full Text Sources
