Review
. 2023 Feb 22;123(4):1417-1551.
doi: 10.1021/acs.chemrev.2c00534. Epub 2023 Jan 26.

Spin Hyperpolarization in Modern Magnetic Resonance

Affiliations
Review

Spin Hyperpolarization in Modern Magnetic Resonance

James Eills et al. Chem Rev. .

Abstract

Magnetic resonance techniques are successfully utilized in a broad range of scientific disciplines and in various practical applications, with medical magnetic resonance imaging being the most widely known example. Currently, both fundamental and applied magnetic resonance are enjoying a major boost owing to the rapidly developing field of spin hyperpolarization. Hyperpolarization techniques are able to enhance signal intensities in magnetic resonance by several orders of magnitude, and thus to largely overcome its major disadvantage of relatively low sensitivity. This provides new impetus for existing applications of magnetic resonance and opens the gates to exciting new possibilities. In this review, we provide a unified picture of the many methods and techniques that fall under the umbrella term "hyperpolarization" but are currently seldom perceived as integral parts of the same field. Specifically, before delving into the individual techniques, we provide a detailed analysis of the underlying principles of spin hyperpolarization. We attempt to uncover and classify the origins of hyperpolarization, to establish its sources and the specific mechanisms that enable the flow of polarization from a source to the target spins. We then give a more detailed analysis of individual hyperpolarization techniques: the mechanisms by which they work, fundamental and technical requirements, characteristic applications, unresolved issues, and possible future directions. We are seeing a continuous growth of activity in the field of spin hyperpolarization, and we expect the field to flourish as new and improved hyperpolarization techniques are implemented. Some key areas for development are in prolonging polarization lifetimes, making hyperpolarization techniques more generally applicable to chemical/biological systems, reducing the technical and equipment requirements, and creating more efficient excitation and detection schemes. We hope this review will facilitate the sharing of knowledge between subfields within the broad topic of hyperpolarization, to help overcome existing challenges in magnetic resonance and enable novel applications.


Conflict of interest statement

The authors declare the following competing financial interest(s): Eduard Y. Chekmenev has a stake of ownership in XeUS Technologies Ltd.

Figures

Figure 1
Figure 1
Nuclear magnetization M of the object is the net magnetic dipole moment (either of the entire object or of its unit volume) induced by a static magnetic field B0 as a result of the partial orientation of the magnetic moments μ⃗ of nuclei. γ is the gyromagnetic ratio of the spin, h is the Planck constant.
Figure 2
Figure 2
(a) Zeeman energy sublevels of spin-1/2 nuclei with positive γ (e.g., 1H) in a static magnetic field. (b) Thermal equilibrium polarization of 1H spins at 300 K and B0 = 14 T (600 MHz 1H NMR frequency). (c) An ultimate hyperpolarization (phyp ≈ 1), with almost all spins oriented in the same direction with respect to B0, which corresponds to an NMR signal enhancement of 2 × 10⁴ relative to the thermal equilibrium state in (b).
Figure 3
Figure 3
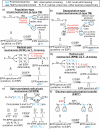
Diagram categorizing hyperpolarization techniques into a hierarchy: (1) the primary source of polarization; (2) the intermediate source which provides a bridge from the primary source to the nuclear spins; (3) the type of coupling that allows polarization transfer to the nuclear spins; (4) the mechanism that allows polarization transfer to occur; and (5) the resulting technique.
Figure 4
Figure 4
Polarization of an ensemble of the named spin-1/2 particles at thermal equilibrium (ptherm) as a function of T/B0. Horizontal scale is additionally provided in temperature units for B0 = 7.05 T (ωn(1H)/2π = 300 MHz, where ωn is the nuclear Larmor frequency).
Figure 5
Figure 5
Illustration of spin state populations (exaggerated) of an ensemble of spin-5/2 nuclei, with black circles representing populations of the mI magnetic sublevels, respectively. Beneath the energy level diagrams, NMR stick spectra simulated using the SpinDynamica software package for Mathematica are shown. The four cases correspond to (a) thermal equilibrium, (b) saturation of just the outer transitions, (c) inversion of the populations for the states involved in the ±3/2 ↔ ±1/2 transitions, and (d) inversion of the populations of the ±5/2 ↔ ±3/2 transitions, followed by inversion of the populations of the ±3/2 ↔ ± 1/2 transitions. The line intensities are shown without taking into account that satellite transitions are usually much broader than the central transition.
Figure 6
Figure 6
(a) Energy level diagram for parahydrogen and orthohydrogen (0–800 cm–1 range). The values of nuclear spin (I), rotational quantum number (J), and degeneracy (xN) are shown for each level. At 20.3 K, the lowest state of p-H2 is populated almost exclusively (pink circles). (b) Energy level diagram for 13CH3F (0–200 cm–1 range) shown on the same vertical scale for comparison. Reproduced from ref (112). Copyright 2017 The Authors. Published by the Royal Society of Chemistry.
Figure 7
Figure 7
Temperature dependence of the equilibrium fraction of para NSIM for several small symmetric molecules: H2 (I = 0), D2 (I = 1), H2O (I = 0), 14N2 (I = 1), 15N2 (I = 0). Note, however, that these dependences were calculated assuming that molecular rotation is not hindered significantly in the entire temperature range presented, which for molecules other than hydrogen isotopologues would require special conditions (e.g., molecular beams, cryogenic matrices, endofullerenes).
Figure 8
Figure 8
Integrated 1H NMR signal intensity as a function of time during an experiment involving two temperature jumps, on a sample of H2O@C60 (molecular structure is shown in the inset). The sample temperature is reported at the top of the graph. Values corresponding to a constant temperature are shown as black dots, while those obtained during a temperature change are reported as red squares; the measurements were performed at time intervals of 180 s. The sequence of colored 1H NMR spectra in the inset were recorded at 5 ± 0.1 K, taken at intervals of 2.25 h after cooling from 60 K. The first spectrum (top) was taken after waiting for 30 min in order to allow thermal equilibration of the equipment. A characteristic spectrum at 32.5 K is also included in the right-hand side of the figure. Reproduced from ref (113) with the permission of AIP Publishing.
Figure 9
Figure 9
Schematics of the experimental setup and the sequence of events during chemical enrichment of ethylene NSIM and their use for NMR signal enhancement. (a) Acetylene is hydrogenated with parahydrogen by passing their mixture heated to 150 °C through the packed bed of Pd/TiO2 solid catalyst. The Z and E labels indicate different mutual positions of the two p-H2-derived H atoms in the ethylene molecules. (b) The product ethylene gas is collected and optionally stored for various time periods in a gastight syringe. (c) The ethylene gas from the syringe is bubbled through a solution of perfluoro(p-tolylsulfenyl) chloride (PTSC) in the NMR tube residing inside a 7 T NMR magnet, thus leading to the formation of the ethylene-PTSC adduct and breaking the symmetry of ethylene. (d) 1H NMR spectra observed immediately after bubbling the produced ethylene through the PTSC solution (top and bottom spectra) and 20 s after interrupting the bubbling (middle spectrum). The bottom spectrum was acquired with double-quantum filtering. Reproduced with permission from ref (63). Copyright 2013 WILEY-VCH Verlag GmbH & Co. KGaA, Weinheim.
Figure 10
Figure 10
Schematics of the experimental setup for NSIM separation using Stark effect. A pulsed molecular beam of water molecules seeded in argon emanates from a room-temperature reservoir through a pulsed gas nozzle and passes an electrostatic deflector. The inhomogeneous electric field inside the deflector (shown in the inset) spatially separates parawater and orthowater molecules. After the deflector, the beam is directed at an ion trap containing a Coulomb crystal of Ca+ and sympathetically cooled N2H+ reactant ions. The products and kinetics of reactive collisions between N2H+ and H2O are probed using time-of-flight mass spectrometry (TOF-MS). Reproduced from ref (109). Copyright 2018 The Authors. Published by Springer Nature under CC BY license.
Figure 11
Figure 11
Brute force approach applied for hyperpolarizing [1-13C]pyruvic acid for solution-state NMR experiments. (a) The experimental apparatus. (b) The sample cup used to hold the pyruvic acid during sample transport. (c) A photograph showing the experimental apparatus, including the 2–4 mT low-field thermal mixing sample-transfer path for 1H → 13C polarization transfer. (d) Hyperpolarized and thermal equilibrium 13C NMR spectra of [1-13C]pyruvic acid showing signal enhancement from brute force polarization. Reproduced with permission from ref (68). Copyright 2015 American Chemical Society.
Figure 12
Figure 12
Level diagram for the coupling of an electron spin S = 1/2 with a nuclear spin I = 1/2 with Boltzmann equilibrium populations of the levels. W1n and W1e are the single-quantum nuclear spin relaxation rate and W2 and W0 the double- and zero-quantum electron–nuclear cross-relaxation rates, respectively. The difference between the two cross-relaxation rates W0 and W2 is the basis of OE-DNP.
Figure 13
Figure 13
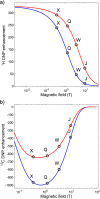
Field dependence of OE-DNP enhancement (calculated here as (II0)/I0 = ε – 1, see eq 5). (a) Calculated 1H enhancement of water protons for a 40 mM aqueous TEMPOL (4-hydroxy-2,2,6,6-tetramethylpiperidin-1-oxyl) solution assuming a diffusion coefficient of D = 6 × 10⁻⁹ m2/s. Two different distances of closest approach were chosen (0.2 nm, red, and 0.4 nm, blue), reflecting the uncertainties caused by the nonspherical electron spin-density distribution of the nitroxide radical. Note that the enhancements arising from dipolar coupling are negative and are shown as absolute values in the diagram. (b) Calculated 13C enhancement for 10 mM TEMPONE (4-oxo-2,2,6,6-tetramethylpiperidine-N-oxyl) in 13C-chloroform including the dipolar contribution from translational motion and a scalar interaction with a spectral density Jec) = Fcexp(−ωeτc)]2 with F = 1.7 × 1024 rad2 s–2 and a collision time τc = 0.5 ps. Calculations were performed for two different diffusion constants (D = 1.4 × 10⁻¹⁰ m2/s, red, and 2.8 × 10⁻¹⁰ m2/s, blue), reflecting different sample temperatures induced by MW heating, and a distance of closest approach of 0.4 nm. For both cases the leakage factor f and the saturation factor s were assumed to have a value of unity. Shown with circles are typically used microwave excitation frequencies (X-band: 0.35 T, Q-band: 1.2 T, W-band: 3.4 T, and J-band: 9.4 T).
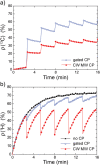
Figure 14
Figure 14
Experimental determination of saturation factor s at 9.4 T by observing the suppression of the water proton chemical shift of an aqueous solution of TEMPOL by MW irradiation (●). The diagram also demonstrates the chemical shift of water sample heated by the applied microwave power (△), which has to be subtracted to obtain the pure suppression of the paramagnetic shift (red ■) which reflects the saturation behavior at microwave powers larger than 200 mW. Reproduced from ref (180) with permission from the Royal Society of Chemistry.
Figure 15
Figure 15
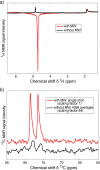
OE-DNP experiments in liquid solutions at 9.2 T. (a) 1H DNP enhancement of an aqueous solution of 24 mM TEMPOL. The sample volume is 90 nL, placed on the flat mirror of a Fabry–Pérot/stripline double-resonance structure. The temperature rise of the sample at 3 W applied microwave power is 30 °C. Shown is the signal without microwaves (black) and the negatively enhanced signal with microwaves (red). The small peak at 2 ppm arises from some liquid outside of the microwave excitation zone. (b) 13C DNP enhancement for 13C-chloroform with 100 mM of dissolved TEMPONE. The sample volume was 35 nL inside a 100 μm diameter capillary placed in the center of a cylindrical/helical double-resonance structure. The increase in sample temperature in this case was about 50 °C above room temperature with 1 W of microwave power. (a) Reprinted with permission from ref (199). Copyright 2015 Elsevier Inc.
Figure 16
Figure 16
OE-DNP enhancement in the liquid phase of lipid bilayers at 9.4 T. (a) Different nitroxide mono- and biradicals mixed with the lipid. (b) Sample preparation and incorporation of the sample in the Fabry-Pérot double-resonance structure. The lipid bilayers are placed and partially aligned on the flat mirror of the Fabry–Pérot DNP double-resonance structure (400 MHz/260 GHz). BMW and BRF are the amplitudes of the oscillating MW and RF magnetic fields, respectively; λMW is the wavelength of microwave radiation; Ct and Cm are tuning and matching capacitors, respectively. (c) 1H DNP enhancements at 9.4 T magnetic field and room temperature of the acyl chain protons of dimyristoylphosphatidylcholine (DMPC) lipid bilayers doped with the different nitroxide mono- and biradicals as DNP agents. The values of ε were recalculated based on the integrated intensities of the 1H NMR signal according to eq 2. Adapted with permission from ref (210). Copyright 2014 American Chemical Society.
Figure 17
Figure 17
Example of application of RTPM-CIDEP-mediated OE-DNP for NMR signal enhancement. (a) Structure of the chromophore and free radical. (b) 1D 1H pulse-acquire NMR spectra of water solvent under dark (laser off) and light (laser on) conditions. Reproduced from ref (214) with permission from the Royal Society of Chemistry.
Figure 18
Figure 18
Principle of DNP-enhanced solid-state MAS NMR spectroscopy. The amplification power of DNP is illustrated for 13C-labeled proline in a bulk water/glycerol (glycerol-d8/D2O/H2O; 60:30:10) frozen solution containing 10 mM AMUPol stable biradical (chemical structure is shown in the figure) as the source of unpaired electrons. The 13C cross-polarization NMR spectra were recorded at 9.4 T (400 MHz proton frequency, 263 GHz microwave frequency) in a 1.3 mm rotor spinning at 40 kHz. The signal enhancement factor ε corresponds to the ratio of resonance intensity with and without microwave irradiation of the sample.
Figure 19
Figure 19
Energy level diagram illustrating DNP via the solid effect (SE). At thermal equilibrium (left), populations are governed by the Boltzmann distribution. Mixing of states in the electron spin subspaces (right) leads to partially allowed double-quantum (DQ) and zero-quantum (ZQ) transitions, and positive and negative enhancements, ε, respectively. The mixing of states is proportional to a constant q, which is inversely proportional to B0. Therefore, the enhancement in the solid effect DNP scales as 1/B02. Adapted with permission from ref (229). Copyright 2013 American Chemical Society.
Figure 20
Figure 20
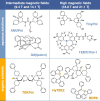
Molecular structure of some of the polarizing agents suitable for DNP MAS NMR at intermediate and high magnetic fields. Blue and orange dots denote the unpaired electrons.
Figure 21
Figure 21
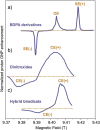
Characteristic proton DNP enhancement profiles as a function of the magnetic field observed for (a) BDPA derivatives, (b) dinitroxides, (c) hybrid biradicals. (a), (b), and (c) correspond to the experimental profiles for 32 mM BDPA in ortho-terphenyl (OTP) (95% OTP-d14, 5% OTP), 15 mM TEKPol biradical in CHCl3/1,1,1,2-tetrabromoethane (TBE)/CD3OD (65/30/5 vol %), and 16 mM HyTEK2 biradical in 1,1,2,2-tetrachloroethane (TCE), respectively. All the data were recorded with a constant microwave frequency of 263 GHz at a temperature of ∼100 K. The enhancements were measured for the NMR signal of the glassy matrix. In (b) and (c), intramolecular CE governs the DNP process and two relatively broad positive and negative lobes are observed. In (a), the SE yields two sharp positive and negative maxima, while the OE gives a positive enhancement in the middle of the field profile. (a) Adapted with permission from ref (231). Copyright 2015 American Chemical Society. (b) Adapted from ref (232) with permission from the Royal Society of Chemistry. (c) Adapted with permission from ref (233). Copyright 2018 American Chemical Society.
Figure 22
Figure 22
Energy diagram illustrating DNP via the cross effect (CE). At equilibrium (left), under the matching condition, there is degeneracy and 1:1 population of the two shaded levels. The EPR spectrum of an ideal biradical for CE (middle) has two narrow lines separated by the nuclear Larmor frequency. Saturation of transitions near the first (second) EPR line gives rise to a positive (negative) DNP enhancement (right). In the kets, the electron spin states are indicated in red and the nuclear spin state in blue. Reprinted with permission from ref (229). Copyright 2013 American Chemical Society.
Figure 23
Figure 23
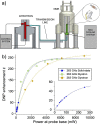
(a) Schematics of a solid-state DNP MAS NMR system with a gyrotron microwave source (gyrotron tube in red), microwave transmission line (cyan) and low-temperature NMR probe (green). (b) Proton DNP enhancement factors measured on a Proline/AMUPol standard sample in a 3.2 mm standard rotor as a function of the MW power for various microwave sources: solid-state source, klystron, and high-power gyrotron. The inset shows the 100 and 250 mW solid-state source data only. (a) Reproduced with permission from ref (244). Copyright 2016 Elsevier. (b) Reprinted with permission from ref (246). Copyright 2019 Elsevier.
Figure 24
Figure 24
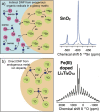
Formulations for DNP MAS NMR of proton-free inorganic solids. (a) The material is prepared by IWI with a radical-containing solution. A CP step transfers the magnetization from hyperpolarized protons in the DNP matrix to 119Sn nuclei at the surface. A mixing time (typically, several hundred seconds) placed between CP and signal acquisition enables the 119Sn hyperpolarization to be transferred from the surface to the bulk of the material by homonuclear 119Sn spin diffusion. Here, powdered SnO2 was impregnated with 16 mM TEKPol in TCE. A factor of 50 gain in overall sensitivity was reported. (b) The powdered solid contains a small quantity of metal ions that act as endogenous polarizing agents. The electron polarization is transferred directly to adjacent 17O nuclei in the absence of spin diffusion. Here, Li4Ti5O12 powders were doped with Fe(III) via solid-state synthesis. A 17O enhancement factor of around 280 was reported for a Fe(III) mole fraction of 0.005, enabling fast acquisition of 17O NMR spectra of the bulk material at natural abundance. (a) Reproduced with permission from ref (285). Copyright 2018 American Chemical Society. (b) Reproduced from ref (287). Copyright 2018 The Authors. Published by American Chemical Society under the CC BY license.
Figure 25
Figure 25
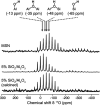
DNP-enhanced, natural-abundance, 17O{1H} PRESTO-QCPMG (phase-shifted recoupling effects a smooth transfer of order: quadrupolar Carr–Purcell–Meiboom–Gill) spectra acquired on various silica and silica–alumina samples (9.4 T, 12.5 kHz spinning frequency). The samples were impregnated with 15 to 30 mM TEKPol solutions. The centers of mass for four different hydroxyl environments are indicated at the top. The MCM-41-type mesoporous silica nanoparticle (MSN) sample presents a broad resonance centered at −65 ppm, as expected. The spectrum acquired on 5% silica–alumina features a dominant peak at around −13 ppm as well as a smaller shoulder at ca. −35 ppm, which were assigned to the μ1- and μ2-aluminols, respectively. After calcination, the μ1-aluminols are removed, and the signal is dominated by the resonance of acidic bridging hydroxyls. Adapted with permission from ref (293). Copyright 2017 Wiley-VCH Verlag GmbH & Co. KGaA, Weinheim.
Figure 26
Figure 26
(a) One-dimensional DNP-SENS CP-CPMG 31P spectra from the given amounts of heptameric oligocytidine strands (dS(C7), C = cytidine) deposited on three different supports. The data were acquired at 9.4 T and the total acquisition time for each experiment ranged between 20 and 28 h. The polarizing agent, TEKPol or TEKPol2 dissolved in TCE, was added by IWI. The numbers indicate the proton DNP enhancement and maximum amount of functionalized DNA that was analyzed. Here, the phosphodiester (P(OR)2O2) groups of DNA strands were replaced by phosphorothioester (P(OR)2OS) functional groups, providing a unique 31P chemical shift signature near 55 ppm. The signal at −5 ppm corresponds to phosphate-like species embedded in the wafers. The fused silica system also exhibits a relatively strong signal around −145 ppm, corresponding to another bulk impurity. The specific surface area of the samples is <0.01 m2/g. (b) Two-dimensional DNP-SENS CP PASS-PIETA (phase adjusted spinning sidebands-phase incremented echo-train acquisition) 31P NMR spectrum from 200 pmol of dS(C7) strands deposited on sapphire. Vertical cross sections give spinning sideband profiles at the given isotropic shift, from which CSA parameters can be extracted. Reproduced with permission from ref (305). Copyright 2019 American Chemical Society.
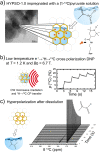
Figure 27
Figure 27
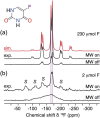
(a) 19F NMR spectra of 5-fluorouracil at 12 kHz spinning frequency, 9.4 T, and 110 K, acquired with (MW on) or without (MW off) microwave irradiation. Sample (a) corresponds to 30 mg of API, which contains 230 μmol of F atoms. Sample (b) is 0.293 mg of API mixed with 30.8 mg of cellulose, which contains 2 μmol of F atoms. Both samples were impregnated with AMUPol in trifluoroethanol-d3. Two crystallographically distinct sites are highlighted in purple and the other resonances in (a) represent spinning sidebands; the red trace corresponds to the simulated spectrum. In (b), the spinning sidebands are labeled with S, and correspond to the solvent (2,2,2-trifluoroethanol-d3) peaks. Reproduced with permission from ref (315). Copyright 2019 Wiley-VCH Verlag GmbH & Co. KGaA, Weinheim.
Figure 28
Figure 28
(a) Z-Slices of confocal microscopy images showing that PyPol radical is well distributed in both nuclear and cytoplasmic compartments of the cell. (b) DNP signal enhancement of approximately 122-fold was measured in 1H-13C CP-MAS experiments at 9.4 T and 8 kHz MAS frequency. (c) Aliphatic region of a 2D 13C-13C proton-driven spin diffusion (PDSD) experiment of ubiquitin in vitro (gray) and in cell (red). This comparison confirms that ubiquitin remains folded after delivery into the cells. Reproduced with permission from ref (321). Copyright 2019 The Authors. Published by Wiley-VCH Verlag GmbH & Co. KGaA.
Figure 29
Figure 29
Radical species demonstrating: (a) SE; (b) CE; and (c) SE + CE, shown with the corresponding EPR spectra and DNP profiles. Adapted from ref (230) with the permission of AIP Publishing.
Figure 30
Figure 30
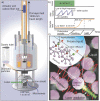
Schematic representation of the dDNP instrumentation used for the first successful dDNP experiments. 1 - polarizer; 2 - vacuum pump; 3 - variable temperature insert; 4 - microwave source; 5 - pressure transducer; 6 - sample port; 7 - microwave container; 8 - sample holder; 9 - sample container; and 10 - dissolution stick. Reproduced with permission from ref (342). Copyright 2003 National Academy of Sciences.
Figure 31
Figure 31
(a) DNP insert, including a waveguide (1a), a 5 mm inner diameter Vespel sample holder (2a), a glass RF coil support together with a doubly tuned NMR RF coil (3a), and a microwave cavity (4a). (b) Resonant RF circuit used for CP, composed of one pair of saddle coils tuned for 1H and one orthogonal pair for 13C, plus two saddle coils for inductive coupling. (c) Dissolution insert with the sample holder for rapid dissolution, with (1c) an outlet for the hyperpolarized solution and (2c) an inlet for the hot dissolution solvent. Adapted with permission from ref (351). Copyright 2013 American Chemical Society.
Figure 32
Figure 32
(a) A CT image of a patient with metastatic prostate cancer showing a relatively osteolytic lesion in left ilium (green arrows), which was infiltrative, causing destruction of the bone cortex and extension into the surrounding soft tissues. (b) T1-weighted (T1w) spoiled gradient-echo MR image of the same lesion. (c) The color-coded map of the pyruvate-to-lactate conversion rate (kPL) overlaid on the MR image, demonstrating the correlation of high kPL values with the osseous lesion on CT and hypointensity on the T1w MR image. The value of kPL was estimated as 0.013 s–1. Reproduced from ref (366). Copyright 2019 The Authors. Published by Springer Nature under CC BY license.
Figure 33
Figure 33
Hyperpolarization of water using DNP with radicals generated by UV light from pyruvic acid (PYR), [2-13C]pyruvic acid (2CPYR), and with a stable radical (TEMPO(L)) before (a) and after dissolution (b). Errors are given as the standard deviation of repeated measurements from distinct samples (n = 3). Adapted from ref (376). Copyright 2020 The Authors. Published by Springer Nature under CC BY license.
Figure 34
Figure 34
Experimental contrast C in T1 (star), T (square) and TLLSS (circle) relaxation time constants for the chemically inequivalent 1H spin pair in the central residue of the polypeptide Gly-Gly-Arg at 1 mM concentration in D2O solution at 500 MHz (11.7 T) and 8 °C as a function of protein–ligand ratio (P:L) (fixed concentration of ligand [L] = 1 mM and a variable trypsin concentration 0.5 μM < [P]0 < 50 μM). Reproduced with permission from ref (394). Copyright 2014 The Authors. Published by Wiley-VCH Verlag GmbH & Co. KGaA.
Figure 35
Figure 35
Positive and negative 1H DNP build-up curves measured at T = 1.2 K and B0 = 6.7 T, with and without frequency modulation, for a sample comprising a 10:40:50 (v/v/v) H2O:D2O:glycerol-d8 mixture with 25 mM of TEMPOL. The optimal microwave frequencies were set for positive or negative DNP (187.85 or 188.3 GHz, respectively), with a microwave power of 87.5 mW. The amplitude of the frequency modulation was set to 100 MHz with a modulation frequency of 10 kHz. An amplitude of 100 MHz was used for frequency modulation. Reprinted from ref (397). Copyright 2014 The Authors. Published by Elsevier B.V.
Figure 36
Figure 36
(a) Build-up of p(13C) polarization during multiple CP contacts applied every 2.5 min with continuous (red) or gated (blue) microwave irradiation at 188.3 GHz (50 MHz frequency modulation amplitude, 10 kHz modulation frequency, 87.5 mW microwave power) for a 3 M sodium [1-13C]acetate with 40 mM TEMPOL at 1.2 K and 6.7 T. (b) DNP build-up of proton polarization p(1H) for the same sample and conditions without any CP (black), or during multiple CP applied every 2.5 min with continuous (red) or gated microwave irradiation (blue). All lines are drawn to guide the eye. Reproduced from ref (335) with permission from the Royal Society of Chemistry.
Figure 37
Figure 37
Relevant portion of the simulated (blue) and experimental (black) 1H echo-detected NMR spectra of water frozen at 1.2 K acquired at 7.05 T as a function of 1H polarization p(1H). The simulated and experimental 1H echo-detected NMR spectra are in agreement for the case of 1H polarization p(1H) = 75%. Adapted from ref (402) with permission from the Royal Society of Chemistry.
Figure 38
Figure 38
Hyperpolarization by dDNP with HYPSO. (a) HYPSO 1.0 is impregnated with a solution of the analyte to be polarized without addition of glass-forming agents. The transmission electron microscopy (TEM) image shows the porous structure of the material. Red dots schematically represent the polarizing agent. (b) 1H DNP performed on 20 mg of HYPSO 1.0 material (88 μmol/g) impregnated with 36 μL of a 3 M solution of [1-13C]pyruvate in D2O. The 1H polarization builds up with a time constant τDNP(1H)=119 ± 1.5 s, and by applying 1H to 13C CP, a polarization of p(13C) > 20% is reached in 17 min. (c) The sample is dissolved and expelled from HYPSO 1.0 by injecting 5 mL of superheated D2O and is transferred to a 300 MHz NMR spectrometer. A series of 13C NMR spectra of [1-13C]pyruvate are acquired (one spectrum is collected every 5 s). The liquid-state polarization obtained, p(13C) = 25.3%, corresponds to an enhancement of ε > 32,000 compared with Boltzmann equilibrium at 300 K and 7 T. The polarization decays with T1(13C) = 49.4 ± 0.4 s, which is typical for a pure D2O solution of [1-13C]pyruvate without any free radicals. Adapted with permission from ref (408).
Figure 39
Figure 39
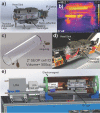
Impregnating radical-containing porous matrices with molecules of interest and storing such materials at moderate magnetic fields allows transportation of hyperpolarized media using permanent magnet systems. (a) 6.7 T wide bore magnet and 1.2 K cryostat (polarizer); (b) dDNP probe; (c) transfer stick; (d) liquid helium transport dewar; (e) magnetic insert. Reproduced from ref (46). Copyright 2017 The Authors. Published by Springer Nature under CC BY license.
Figure 40
Figure 40
Overview of major CIDEP mechanisms. Legend: R - doublet radicals; P - precursor; ESP - electron spin polarization; X - other species; RX - covalently bound RX pair. [R X] - spin-correlated R..X radical pair; S0 - species populating the ground-state singlet; S1 - species populating an excited-state singlet; T1 - species populating the T1 excited triplet state; D, T, Q: doublet, triplet, quartet electron spin states, respectively; T+, T0, T - substates of triplet electron spin states in the laboratory frame; ZFS - zero-field splitting; HFI - hyperfine interaction; LAC - level anticrossing; A - electron–nucleus hyperfine coupling; J - exchange coupling of electron spins in a radical pair or a biradical.
Figure 41
Figure 41
Overview of (a) radical-triplet pair mechanism (RTPM) and (b) reverse quartet mechanism (RQM) of CIDEP. Legend: ZFS - zero-field splitting; HFI - hyperfine interaction; LAC - level anticrossing; ISC - intersystem crossing.
Figure 42
Figure 42
(a) Schematic illustration of experimental apparatus employed to monitor CIDEP effects by TR-EPR. A short laser pulse generates transient paramagnetic species for EPR detection. The time between laser irradiation and data collection is then tracked. (b) Data acquisition scheme for a typical CW-TR-EPR experiment. The MW irradiation is continuous and the EPR signal is recorded upon comparing MW absorption before and after laser irradiation. (c) Data collection scheme for a typical FT-TR-EPR experiment. No CW MW irradiation is present, and MW pulses serve the purpose of producing an observable signal.
Figure 43
Figure 43
Examples of X-band EPR spectra exhibiting CIDEP effects: (a) acetone/isopropyl alcohol/water (1:1:1) photoexcited at 308 nm; (b) benzophenone (100 mM) in isopropyl alcohol photoexcited at 355 nm; (c) tetraphenyl porphyrin (TPP; 0.1 M) and benzoquinone (10 mM) in 3:1 chloroform/methanol photoexcited at 460 nm; (d) benzil (1 mM) in frozen toluene photoexcited at 308 nm. The triangle denotes the half-field (double quantum) transitions characteristic of a triplet-state molecule. Reproduced with permission from ref (439). Copyright 2013 Elsevier.
Figure 44
Figure 44
Representative example of RQM-mediated CIDEP at various temperatures and in different solvents. Spectra shown with thick and thin lines correspond to data acquired 0.3 and 1.5 μs after laser irradiation, respectively. The rather complex spectral patterns arise from the mutual coupling of the two paramagnetic species. Reproduced with permission from ref (436). Copyright 2005 American Chemical Society.
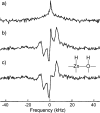
Figure 45
Figure 45
(a) Overview of the radical pair mechanism of photo-CIDNP. This simple scheme assumes a cyclic process. Note that F-pairs may also give rise to additional hyperpolarization (not shown in the image above). (b) Electron spin energies of a radical pair as a function of distance between radical pair components.
Figure 46
Figure 46
EPR stick-spectrum of a radical pair consisting of two radicals R1 and R2, with R1 carrying a single spin-1/2 nucleus with the hyperfine coupling constant A. Larger difference in the resonance frequencies of the two radicals results in a faster singlet–triplet interconversion, which in the illustrated case corresponds to RP with the nucleus in the α spin state.
Figure 47
Figure 47
Representative example of photo-CIDNP proceeding via a noncyclic process. (a) The photolysis reaction scheme for p-acetylbenzyl dimethyl phosphite (1) in solution. (b,c) 31P CIDNP NMR spectra recorded during the photolysis of deoxygenated 0.1 M benzene-d6 solutions of 1 in the presence of benzyl bromide as a radical scavenger, at high (101.26 MHz, 5.88 T) and low (32.44 MHz, 1.88 T) magnetic fields. Note the sign change of the NMR signal of cage-escape product 10 from absorptive to emissive character at high and low field, respectively, signifying the switch from S-T0 to S-T mixing in the geminate radical pair 3[2, 3]. Adapted with permission from ref (463). Copyright 1996 American Chemical Society.
Figure 48
Figure 48
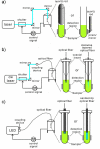
Overview of common photo-CIDNP instrumentation. (a) Experimental setup employing a laser source in conjunction with a quartz rod. (b) Apparatus based on a laser as a light source and optical fiber for light delivery inside the NMR spectrometer. (c) Setup employing a LED light source and an optical fiber.
Figure 49
Figure 49
Expected magnetic field (B0) dependence of photo-CIDNP hyperpolarization of the 13Cα nucleus of tryptophan (Trp), assuming an isolated 13Cα (dashed line), a 13Cα within an otherwise unlabeled Trp (dotted line) and a 13Cα within a uniformly 13C-enriched Trp (solid line). Simulations were carried out for the Trp amino acid as the molecule of interest and for fluorescein as the photosensitizer dye, according to known equations and procedures. Parameters used: translational diffusion coefficients DFl = 4.25 × 10⁻⁶ cm2/s,DTrp = 5.40 × 10⁻⁶ cm2/s, van der Waals radii RFl = 0.44 nm and RTrp = 0.38 nm, hyperfine coupling constant of 13CαA = 0.5643 mT. Hyperfine coupling constants of other Trp radical nuclei were as reported. The computed polarizations were normalized relative to the maximum achievable polarization of each species at optimal B0. The hyperfine coupling constants of the fluorescein hydrogens were not taken into account.
Figure 50
Figure 50
Chemical structure of common photosensitizer dyes employed in photo-CIDNP and LC-photo-CIDNP.
Figure 51
Figure 51
Overview of degradation pathways of dye and molecule of interest during photo-CIDNP. (a) Degradation of dye and molecule of interest mediated by singlet oxygen. (b) Degradation of FMN dye mediated by its diradical form generated as a photo-CIDNP byproduct. (c) Degradation of the molecule of interest (Trp or His) mediated by the radicals that are typically transiently generated during photo-CIDNP in solution.
Figure 52
Figure 52
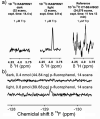
Overview of the sensitivity advantages of LC-photo-CIDNP for Trp and p-fluorophenol in solution. (a) Comparison between the sensitivity of LED-driven 1H-detected 13C LC-photo-CIDNP and the reference 1H-13C CT-SE-HSQC experiment. The number of scans of the reference HSQC experiment was adjusted to achieve SNR similar to LC-photo-CIDNP. Note that, due to the intense residual solvent signal, strong baseline distortions are observed in the Hα region. The noise level away (ca. 7–8 ppm) from the residual solvent signal was used to estimate SNR. A 208-fold sensitivity enhancement relative to reference HSQC was observed. (b) Sensitivity of microvolume (1 μL samples) 19F photo-CIDNP performed on p-fluorophenol. (a) Adapted from ref (472) with the permission of AIP Publishing. (b) Reproduced from ref (43). Copyright 2018 The Authors. Published by Springer Nature under CC BY license.
Figure 53
Figure 53
Ratio of photo-CIDNP enhancements for Trp obtained with two different photosensitizer dyes, namely fluorescein (FL) and flavin mononucleotide (FMN). The notation of infinity indicates that signal from FMN-mediated photo-CIDNP was below detection limit for 5 μM Trp. Adapted with permission from ref (503). Copyright 2016 American Chemical Society.
Figure 54
Figure 54
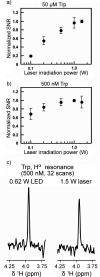
Dependence of photo-CIDNP SNR on the power of optical irradiation at low sample concentrations. All data pertain to tryptophan (Trp) in aqueous solution at room temperature and pH 7.0. (a) 50 μM Trp. (b) 500 nM Trp with optical irradiation by a 1.5 W argon ion laser at 488 nm. (c) Comparison between the SNR of LC-photo-CIDNP experiments employing a 1.5 W laser and a 0.62 W LED, respectively. (a,b) Adapted with permission from ref (475). (c) Adapted from ref (472) with the permission of AIP Publishing.
Figure 55
Figure 55
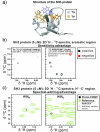
(a) 3D structure of SH3 protein. (b,c) 2D spectra of SH3 protein acquired with conventional NMR and LC-photo-CIDNP. Data were collected in aqueous solution at pH 7.2 and 24 °C. In (b), comparison between NMR spectra of 5 μM SH3 protein acquired via 2D 1H-13C SOFAST-HMQC and 2D 1H-13C LC-photo-CIDNP (13C PREPRINT) under dark and light conditions. The same total experimental time applies to all three experiments. In (c), spectral overlap between 2D LC-photo-CIDNP spectrum of 5 μM SH3 protein (13C PREPRINT pulse sequence) and reference 1H-13C CT-SE-HSQC spectra highlights the spectral editing capabilities of LC-photo-CIDNP in the Hα-Cα region. Adapted with permission from ref (475).
Figure 56
Figure 56
(a) The reaction scheme of p-benzoquinone (BQ) photolysis in solution. RH is a hydrogen atom donor (e.g., a solvent molecule); BQH is the transient semiquinone radical. (b) The dependence of benzoquinone 1H NMR signal on the magnetic field B0 during its photolysis in CD3CN with a UV lamp. The electron spin transitions are irradiated in an auxiliary electromagnet at 310 MHz (B1 = 0.1 mT) while the sample is continuously flowing from the reaction cell to an NMR tube in the probe of a 200 MHz NMR spectrometer. The signal of BQ is extracted from the spectrum and is shown centered at the corresponding B0 value. The signal labeled “dark” is acquired in thermal equilibrium; the one labeled “B1 = 0” is the signal showing CIDNP effect (without MW). Reprinted with permission from ref (537). Copyright 1989 Elsevier B.V.
Figure 57
Figure 57
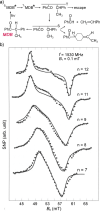
(a) The reaction scheme of α-methyldeoxybenzoin (MDB) photolysis. (b) SNP spectra detected at 1530 MHz MW frequency via carbonyl 13C NMR signal of MDB during its photolysis in aqueous micellar solutions (detergent molecule CH3(CH2)n−1SO4Na; n = 7, 8, 9, 11, 12). Solid lines show results of model calculations. Republished from ref (533) with permission of Walter de Gruyter and Co.
Figure 58
Figure 58
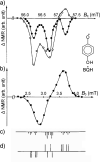
(a,b) The B0 dependence of benzoquinone NMR signal upon its photolysis and MW irradiation at (a) 1590 MHz and (b) 94.5 MHz; B1 = 0.01 mT (solid circles) or 0.1 mT (open circles). (c) The predicted DNP stick-spectrum for semiquinone radical (BQH). (d) The predicted SNP stick-spectrum for RP containing BQH radical. Reprinted with permission from ref (546). Copyright 1986 Elsevier B.V.
Figure 59
Figure 59
Dependence of DNP effects on B0 detected by monitoring the 1H NMR signal of dimethylaniline (DMA) aromatic protons upon photolysis of anthracene–DMA solutions using MW irradiation at 310 MHz. (a) The effect of DMA concentration at B1 = 0.3 mT (top: [DMA] = 0.5 M; middle: [DMA] = 0.22 M; bottom: [DMA] = 0.17 M). (b) The effect of MW field amplitude B1 at [DMA] = 0.8 M (top: B1 = 0.3 mT; middle: B1 = 0.7 mT; bottom: B1 = 1.2 mT). Reprinted with permission from ref (89), Springer Nature Customer Service Centre GmbH. Copyright 1990 Springer Nature.
Figure 60
Figure 60
TR-EPR spectra and DNP effects detected upon photolysis of di-t-butyl ketone ((CH3)3C)2CO in benzene. (a) X-band (9.4 GHz) TR-EPR spectrum of t-butyl radical (CH3)3C integrated from 0.5 to 1.5 μs after the laser flash. (b) L-band (1.9 GHz) TR-EPR spectrum integrated from 1.5 to 2 μs. (c) X-band (9.33 GHz) and (d) L-band (1.53 GHz) DNP effects detected by monitoring the 1H NMR signal of the recombination product 2,2,3,3-tetramethylbutane (CH3)3C–C(CH3)3 with B1 = 0.2 mT. Reprinted with permission from ref (548). Copyright 1999 American Chemical Society.
Figure 61
Figure 61
Setup for sample illumination under MAS NMR conditions. A 1000-W xenon lamp is used as a light source. A water filter and Schott glass filters remove infrared and ultraviolet radiation. A fiber bundle guides the light into the MAS NMR probe. The sample is located within a sapphire rotor and is laterally illuminated. Interference with the MAS frequency optical sensor has to be avoided.
Figure 62
Figure 62
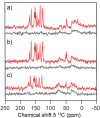
13C MAS NMR spectra of selectively 13C-labeled (a) photosystem II particle preparation, the so-called BBY preparation, (b) thylakoid membranes, and (c) entire plants of the aquatic plant Spirodela oligorrhiza, obtained under continuous illumination (red traces); also shown are the corresponding spectra obtained under dark conditions (gray traces). All samples were selectively labeled by feeding with 4-13C1-aminolevulinic acid (4-ALA). All spectra were obtained at a magnetic field of 4.7 T and a temperature of 235 K with a MAS frequency of 8 kHz and a recycle delay of 4 s. Reprinted from ref (565). Copyright 2018 The Authors. Published by Springer Nature under CC BY license.
Figure 63
Figure 63
Experimental field dependence of the solid-state photo-CIDNP effect in the photosynthetic reaction center of the purple bacterium Rhodobacter sphaeroides R26. The field dependence of the effect for selected carbons 13C of the “special pair” donor cofactors PL and PM as well as of the bacteriopheophytin acceptor Φ is shown. The notation “PL13”, e.g., refers to carbon 13 on cofactor PL according to the IUPAC numbering. Reprinted from ref (562) with the permission of AIP.
Figure 64
Figure 64
Solid-state photo-CIDNP effect in the photosynthetic reaction center of the purple bacterium Rhodobacter sphaeroides R26. The 13C MAS NMR spectra are obtained at (a) 2.4 T (100 MHz 1H frequency), and (b) 1.4 T (60 MHz 1H frequency). Photo-CIDNP MAS NMR spectra (red traces) are acquired under continuous illumination with a white light of xenon lamp and without proton decoupling. The corresponding spectra obtained without illumination are shown for comparison (black traces). Enhancement factors are (a) 20,000 and (b) 80,000. Adapted with permission from ref (569). Copyright 2012 American Chemical Society.
Figure 65
Figure 65
Crystal structure of the flavoprotein phototropin-LOV1 wild type in the dark with 0.19 nm resolution (Protein Data Bank reference: 1N9L). The edge-to-edge distance between the flavin mononucleotide (FMN) cofactor and tryptophan (Trp) is around 1.1 nm. Note that electron transfer from tryptophan (at position 98) to FMN after photoexcitation occurs only when the conserved cysteine close to FMN is mutated to serine or alanine. The IUPAC numbering of FMN and tryptophan is included. Reprinted from ref (568). Copyright 2019 The Authors. Published by Springer Nature under CC BY license.
Figure 66
Figure 66
Photocycle of quinone-blocked bacterial reaction center of Rhodobacter sphaeroides. Upon photon absorption, the primary electron donor P, bacteriochlorophyll dimer (the “special pair”) is excited to its first excited electronic singlet state. In the excited state, fast electron transfer to the bacteriopheophytin acceptor Φ forms the spin-correlated RP in its singlet state. Since the forward reaction is prevented, the RP can recombine to its electronic ground state. Alternatively, in a coherent interconversion of the electron spin multiplicity, the triplet state is formed. The triplet state of the RP can either convert back to the singlet state or form a donor triplet state, from which a slow back-reaction to the ground-state is possible. The kinetics of this process is given for wild type (WT) and for R26 reaction centers. R26 is a mutant without the carotenoid cofactor.
Figure 67
Figure 67
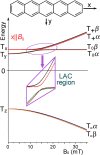
Jablonski diagram for pentacene. S0 is the ground electronic state. Excited singlet states Sn can be reached by photoexcitaiton at an appropriate wavelength; other radiative transitions are not shown. Shaded patterns schematically show vibrational energy sublevels. Isoenergetic ISC processes populate and depopulate the three spin sublevels Tx, Ty, Tz of the molecular triplet states Tn at different rates. IC - internal conversion; VR - vibrational relaxation.
Figure 68
Figure 68
Energy levels for triplet pentacene with its molecular x axis oriented parallel to magnetic field B0 are shown schematically (only one nuclear spin is taken into account).
Figure 69
Figure 69
Crystal structure of pure naphthalene is monoclinic with a unit cell with axes a ≈ 0.81 nm, b ≈ 0.59 nm, c ≈ 0.86 nm, and β = 124.4°. The a–b plane is the cleavage plane. Two naphthalene molecules can be replaced at two different positions in the crystal by one pentacene molecule whose x-axis lies in the ac plane at an angle of 10° to the c-axis. Reprinted with permission from ref (592). Copyright 2013 Elsevier.
Figure 70
Figure 70
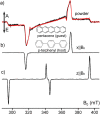
(a) An experimental time-resolved EPR spectrum (black trace) of a powder sample of pentacene in p-terphenyl host at room temperature after photoexcitation at 590 nm, and its simulation (red trace). A - enhanced absorption, E - emission. (b,c) Corresponding EPR spectra of a single crystal for x||B0 (b) and z||B0 (c) orientations. Two pairs of EPR lines observed in (c) correspond to two different lattice sites occupied by pentacene in the host crystal. Spectra (a–c) are not shown on the same vertical scale. (a) Adapted with permission from ref (601). Copyright 2016 American Chemical Society. (b,c) Reprinted from ref (602) with the permission of AIP Publishing.
Figure 71
Figure 71
Enhanced 1H NMR signals of a naphthalene crystal doped with pentacene-d14 taken at different times during the ISE polarization build-up at 0.3 T and T ∼ 100 K. Reprinted from ref (592), Copyright (2013), with permission from Elsevier.
Figure 72
Figure 72
(a) Effect of deuteration of components on polarization for pentacene in p-terphenyl; experiments at RT and B0 = 0.4 T. (b) Effect of matrix deuteration on the polarization buildup times (357 s vs 7890 s) for pentacene in a naphthalene crystal; note the difference in time scales in the graph. Experiments were performed at 105 K and B0 = 0.3187 T. (a) Reproduced with permission from ref (610). (b) Adapted with permission from ref (607) and ref (609). Copyright 2004 The Physical Society of Japan.
Figure 73
Figure 73
Dissolution tDNP performed by injecting a hot aqueous solution to the sample tube with a polarized pentacene/benzoic acid sample. The injection was performed 20 s after polarizing the powdered sample by tDNP for 10 min. The 1H magnetization was measured with 15° flip-angle pulses repeatedly at intervals of 1 s; t = 0 corresponds to the end of tDNP procedure. Reprinted with permission from ref (619). Copyright 2018 American Chemical Society.
Figure 74
Figure 74
1H NMR spectra (0.676 T) of an aqueous dispersion of nanocrystals (NC) of p-terphenyl doped with 0.5 mol % pentacene at thermal equilibrium (0 s) and during tDNP process at RT. CTAB - cetyltrimethylammonium bromide surfactant. Reproduced from ref (594) with permission from the Royal Society of Chemistry.
Figure 75
Figure 75
(a) The NV center consists of a nitrogen atom and a vacancy substituting for two adjacent carbon atoms in the diamond lattice. The NV axis may lie along any of the four main diagonals of the crystal, accounting for the total of eight possible orientations of the center. The molecular symmetry of the center is C3v. (b) Lowest electronic energy levels of the negatively charged NV center. The colored solid double-sided arrows indicate zero-phonon lines. Spin selectivity of the ISC transitions results in preferential optical pumping of the NV center into the mS = 0 ground state. Reprinted with permission from ref (630), Springer Nature Customer Service Centre GmbH. Copyright 2017 Springer Cham.
Figure 76
Figure 76
Hyperpolarization of 13C nuclei in nanodiamond with high-field NMR detection. Hyperpolarization occurs at a low (fringe) magnetic field, after which the sample is shuttled into the high-field NMR spectrometer for detection. Reprinted from ref (645). Copyright 2018 The Authors. Published by AAAS under CC BY-NC 4.0 license.
Figure 77
Figure 77
Concept of polarization transfer from hyperpolarized bulk diamond to a fluidic analyte. Adapted with permission from ref (653). Copyright 2014 American Chemical Society.
Figure 78
Figure 78
(a) Molecular hydrogen can be enriched in the para nuclear spin isomer by passing it over a magnetic material, e.g., FeO(OH), at cryogenic temperatures. (b) The para enrichment fraction as a function of temperature. (c) Parahydrogen can be chemically reacted with another molecule in solution to produce a hyperpolarized product molecule, and RF pulses or magnetic field manipulations can be used to transfer the hyperpolarization to chosen nuclear spins in the molecule. Note that ortho- and parahydrogen molecules are often depicted as having parallel and antiparallel orientations of their nuclear spins, respectively, which is a pictorial oversimplification of their true (triplet and singlet, respectively) nuclear spin states. Adapted with permission from ref (661). Copyright 2015 WILEY-VCH Verlag GmbH & Co. KGaA, Weinheim.
Figure 79
Figure 79
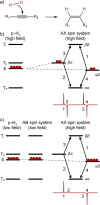
(a) A catalytic reaction of an unsaturated substrate with parahydrogen produces a product molecule in which the protons have a chemical shift difference. (b) In a PASADENA experiment the reaction is performed at a high field, and so the transformation of p-H2 into a weakly coupled (AX) spin system is nonadiabatic. This leads to a characteristic antiphase PASADENA peak pattern shown on the right. (c) In an ALTADENA experiment the reaction is performed at a low field, and the sample is then transported to a high field. The transformation of the p-H2-derived strongly coupled (AB) spin system of the product into an AX spin system is often adiabatic and leads to an ALTADENA peak pattern (shown for a RF pulse with a flip angle α ≪ π/2).
Figure 80
Figure 80
Illustration of the side arm hydrogenation (SAH) procedure to produce hyperpolarized R13COOH (the “target”) molecule. The RCOOH is initially chemically modified to incorporate a side arm that can be hydrogenated with parahydrogen. After hydrogenation, the polarization is transferred to the 13C nucleus of the target. An aqueous base is added to the solution to cleave off the side arm, and the target ends up in the aqueous phase, with the other molecules from the reaction remaining in the organic phase. Adapted with permission from ref (709). Copyright 2021 Elsevier B.V.
Figure 81
Figure 81
Use of PHIP to determine the enantioselectivity of asymmetric hydrogenation reactions, made possible by the fact that the hyperpolarized protons are distinguishable from thermally polarized protons. The PHIP-polarized molecules (labeled “hy”) are distinguishable in 1H NMR spectra since they are diastereomeric, but once relaxed they are chiral enantiomers and indistinguishable. Adapted from ref (722) with the permission of AIP Publishing.
Figure 82
Figure 82
Hyperpolarization and purification (via precipitation) of [1-13C]fumarate. (a) Catalytic trans hydrogenation of a [1-13C]acetylene dicarboxylate precursor with parahydrogen over the Ru-based catalyst to generate [1-13C]fumarate with enhanced proton singlet spin order, followed by a magnetic field cycle to transform this singlet order into 13C magnetization. (b) The apparatus used for the experiment. A zoom of the chemical reactor is shown on the left, including a sparger to dissolve p-H2 into solution more effectively during bubbling. The magnetic shield and electromagnetic coils are used for the magnetic field cycle. On the right, the precipitation stage is shown; a Halbach permanent magnet array provides a field in which the precipitation is carried out. (c) [1-13C]Fumarate concentration and polarization for different p-H2 bubbling durations. (d) Molar polarization (i.e., the product of [1-13C]fumarate polarization and concentration) for different bubbling durations. Adapted with permission from ref (678).
Figure 83
Figure 83
(a,b) ODIP experiments can be carried out to yield PASADENA (a) and ALTADENA (b) 2H NMR spectra; the spectral pattern dependence on excitation pulse flip angle is shown. (c) 2H NMR spectra of styrene-d2 after chemical reaction of a precursor molecule (phenylacetylene) at high field with o-D2. The resulting PASADENA spectrum is shown below, and a thermal equilibrium spectrum obtained with NS = 32 transients and vertically expanded by a factor of 4 is shown above. The two deuterium atoms and the corresponding NMR signals are labeled DA and DB. Also shown are the signal enhancements ε evaluated for the two multiplets. Adapted from ref (732) with the permission of AIP Publishing.
Figure 84
Figure 84
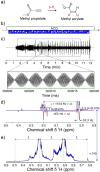
(a,b) The chemical reaction that forms the basis of the PHIP RASER and the experimental protocol. A 100 mM solution of methyl propiolate in acetone-d6 was used; p-H2 was bubbled into the solution at 0.2 bar gauge pressure continually for the duration of the experiment, such that hyperpolarized methyl acrylate was generated throughout. (c) The NMR signal acquired during the experiment. (d) A Fourier transform of the RASER signal (blue trace) and comparison with PASADENA signals from the same chemical system (red trace). ζ is the frequency difference between RASER lines. (e) An expansion of the NMR spectrum in (d). ACQ = NMR signal acquisition. Reproduced with permission from ref (744). Copyright 2020 The Authors. Published by Wiley-VCH Verlag GmbH & Co. KGaA.
Figure 85
Figure 85
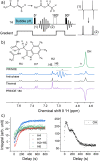
A PRINOE experiment in which 100 mM ethyl acetate-d6 is polarized via PHIP and then used to hyperpolarize 100 mM N-acetyl-l-tryptophan in [D4]MeOH. (a) A simplified scheme showing the principle of the PRINOE experiment. Parahydrogen reacts with vinyl acetate-d6 at a high field to form ethyl acetate-d6, with a gradient applied to suppress radiation damping. The proton spin order on ethyl acetate-d6 is I1zI2z, which would give rise to an antiphase peak pattern illustrated in (1). A 5° flip-angle pulse is applied to initiate radiation damping, which leads to I1z + I2z spin order which exhibits an absorptive peak pattern illustrated in (2). Since the hyperpolarized spin order of the source molecule now carries a net magnetic moment, it can lead to NMR signal enhancement of a target molecule in solution via the intermolecular NOE effect. (b) Molecular structure of the target N-acetyl-l-tryptophan, and the resulting NMR spectra from performing the PRINOE experiment without and with a 180° flip-angle pulse applied during the pulse sequence. (c) The PRINOE-enhanced signals from N-acetyl-l-tryptophan acquired using 5° flip-angle pulses every 2 s. Adapted with permission from ref (749). Copyright 2021 The Authors. Published by Wiley-VCH GmbH.
Figure 86
Figure 86
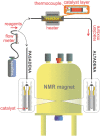
Experimental setup and procedure for HET-PHIP in gas–solid processes. The reagent gas flow controlled by a flow meter is supplied either to the packed-bed reactor positioned in the Earth’s field and then to the empty sample tube inside the NMR magnet (right branch, ALTADENA experiment), or directly into the sample tube with the catalyst inside the NMR magnet (left branch, PASADENA experiment). Reproduced with permission from ref (754). Copyright 2018 American Chemical Society.
Figure 87
Figure 87
Experimental setup and procedure for HET-PHIP in gas–liquid–solid processes. The liquid is drawn into the syringe from the left liquid reservoir and the three-way valve is then switched to allow the liquid to flow through the tube-in-tube device for membrane dissolution of p-H2 and then into the heated catalyst cartridge. After that, the liquid continues to flow into the magnet for detection and is then collected in a separate reservoir. Adapted with permission from ref (755). Copyright 2021 Wiley-VCH GmbH.
Figure 88
Figure 88
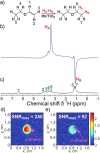
(a) The scheme of pairwise addition of p-H2 to ethyl vinyl ether (EVE) with the formation of hyperpolarized diethyl ether (DE) over Rh/TiO2 catalyst. (b) 1H NMR spectrum of gaseous hyperpolarized DE acquired while the gas mixture was flowing at 4.3 mL/s gas flow rate. (c) 1H NMR spectrum of thermally polarized gaseous DE scaled by a factor of 16. The spectra were acquired with eight signal accumulations. Hydrogenation of EVE with 6.5-fold excess of p-H2 was performed at 200 °C and 2.7 bar. Signal enhancement calculated using the signal of DE CH3 group was ε = 570, which corresponds to phyp(1H) = 1.3%. (d,e) 1H FLASH (fast low-angle shot) MRI of diethyl ether vapor in a 5 mm NMR tube (axial view): (d) continuously flowing (5.1 mL/s gas flow rate) hyperpolarized DE and (e) thermally polarized DE under stopped-flow conditions. The gas pressure was 3.9 bar. The images were acquired at 9.4 T. Frequency offset was adjusted to the signal of CH3 group of DE. The FLASH imaging parameters: flip angle, 6°; number of averages, 2; acquisition time, 120 ms; matrix size, 128 × 16 (zero-filled to 128 × 128), field of view (FOV), 1.7 cm × 1.7 cm; spatial resolution, 0.1 mm × 1.1 mm. Reproduced with permission from ref (760). Copyright 2020 Wiley-VCH GmbH.
Figure 89
Figure 89
(a,b) Single-scan 13C{2H} spectra for the 13C-hyperpolarized compounds in the production of (a) alanine-1-13C and (b) glycine-1-13C. Spectra collected before ester cleavage (blue traces) were acquired with a 18° flip-angle pulse, whereas spectra after cleavage (red traces) were collected with a 90° flip-angle pulse. (c) The reference 13C NMR spectrum of pyruvate-1-13C in thermal equilibrium is shown for comparison. Reproduced with permission from ref (766). Copyright 2019 Wiley-VCH Verlag GmbH & Co. KGaA, Weinheim.
Figure 90
Figure 90
(a) Reaction scheme of 1,3-butadiene hydrogenation. (b) 1H NMR spectra acquired during 1,3-butadiene hydrogenation with normal hydrogen (blue trace) and parahydrogen (red trace) over a Rh/TiO2 catalyst prepared from rhodium nitrate and calcined at 600 °C. Reproduced from ref (770) with permission from the Royal Society of Chemistry.
Figure 91
Figure 91
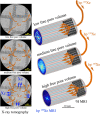
(a) Schematics of the remote detection MRI experiment. Catalyst bed (reactor) is placed inside the encoding RF coil which, in combination with the gradient coils, is used to perform spatial encoding of the 1H NMR signal of the continuously flowing gaseous mixture of p-H2 and propylene. The 1H NMR signal detection is performed with a detection RF coil located downstream. (b–d) Remote detection time-of-flight images encoded in the yz plane for Rh/SiO2 catalyst beds (b) 800 μm in diameter and 5 mm long (R-800-5); (c) 405 μm in diameter and 14 mm long (R-405-14); (d) 150 μm in diameter and 15 mm long (R-150-15). The images visualize the 1H NMR signal of hyperpolarized propane. The experiments were performed at 60 °C. Gas travel times between the encoding and detecting RF coils are indicated in the panels in milliseconds. The leftmost images are obtained by coadding all images obtained for various travel times. The catalyst bed regions are outlined with white dashed lines. The complete data set for each catalyst bed was acquired in 13 min with a time resolution of 12 ms and a spatial resolution of 160–250 μm in the y direction and 0.62–2.2 mm in the z direction. Reproduced with permission from ref (779). Copyright 2012 WILEY-VCH Verlag GmbH & Co. KGaA, Weinheim.
Figure 92
Figure 92
(a–c) 1H NMR spectra of thermally polarized (n-H2, top) and hyperpolarized (p-H2, bottom) samples in the hydrogenation of propylene to propane over catalysts (10 mg) comprising (a) 8 ppm Pt on CeO2 octahedra (Oct-8 ppm), (b) 10 ppm Pt on CeO2 cubes (Cub-10 ppm), and (c) 16 ppm Pt on CeO2 octahedra (Oct-16 ppm) at 300 °C. The flow rates were 365/30/105 mL/min N2/H2/propene. All spectra are shown on the same vertical scale. The reaction scheme is shown above the spectra. Adapted with permission from ref (782). Copyright 2020 Wiley-VCH GmbH.
Figure 93
Figure 93
1H NMR spectra of thermally polarized (top) and hyperpolarized (bottom) reactor effluent obtained using 10 mg of (a) Pt@mSiO2, (b) Pt3Sn@mSiO2, and (c) PtSn@mSiO2 at 300 °C. The reactant flow rates were 120 mL/min H2, 210 mL/min propylene, and 70 mL/min N2. All spectra are displayed on the same vertical scale. Reproduced with permission from ref (783). Copyright 2017 Wiley-VCH Verlag GmbH & Co. KGaA, Weinheim.
Figure 94
Figure 94
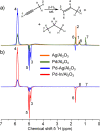
(a) 1H NMR ALTADENA spectra acquired during propyne hydrogenation with parahydrogen over Ag/Al2O3 (orange trace), Pd/Al2O3 (green trace), and Pd-Ag/Al2O3 (blue trace) catalysts. The reaction temperature was 200 °C, and the total gas flow rate was 3.8 mL/s. All spectra were acquired with eight signal accumulations and are presented on the same vertical scale. (b) Comparison of Pd-Ag/Al2O3 (blue trace; the same spectrum as in (a)) and Pd-In/Al2O3 (red trace) catalysts. Reaction scheme of propyne hydrogenation is shown above the spectra. Reproduced from ref (785). Copyright 2021 The Authors.
Figure 95
Figure 95
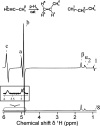
1H NMR spectra detected during the hydrogenation of propyne with p-H2 at 120 °C over an immobilized Ir metal complex synthesized from [Ir(COD) Cl]2 (COD = 1,5-cyclooctadiene) by covalently binding an Ir metal center of the complex to PPh2– functional groups of the linker chains on the surface of functionalized silica gel. The spectrum detected in a PASADENA experiment (top trace; 16 signal accumulations) shows characteristic enhanced antiphase multiplets. 1H NMR spectrum at thermal equilibrium (bottom trace) was recorded for the same reaction mixture after relaxation of the hyperpolarized products with 128 accumulations. The spectra are scaled accordingly and are presented on the same vertical scale; the inset shows the vertically expanded part of the spectrum acquired at thermal equilibrium to make signals of the product propylene visible. The reaction scheme is shown in the top part of the figure. Adapted from ref (789) with permission from the Royal Society of Chemistry.
Figure 96
Figure 96
(a) 1H NMR spectrum acquired immediately after a nominal 50 ms burst of n-H2 delivered to polycrystalline ZnO. (b) Spectrum taken under the same conditions as in (a) but using p-H2 instead of n-H2. Strong PASADENA enhancement is seen for sites not detected in the n-H2 experiment. (c) Pure PASADENA spectrum obtained by taking the weighted difference of (a) and (b). The inset depicts the suggested structure of the detected surface species. Reproduced with permission from ref (795). Copyright 2001 American Chemical Society.
Figure 97
Figure 97
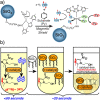
Overall schematic representation of SABRE: simultaneous chemical exchange of parahydrogen and to-be-hyperpolarized substrate (sub) leads to formation of “free” hyperpolarized substrate. Note that the axial ligand positions are not exchangeable. Once the catalyst is activated using parahydrogen and substrate, the hexacoordinate complex facilitates polarization transfer in the equatorial plane. The AA′BB′ spin system and relevant spin–spin couplings of the four ligands in the equatorial plane are shown at the bottom (note that spins A and A′ are chemically equivalent, and so are spins B and B′; the magnetic equivalence is broken by the difference in the corresponding A–B spin–spin couplings: JAB and J′AB). The corresponding spin–spin couplings with axial ligands are negligible. The N-heterocyclic carbene ligand, IMes, is shown explicitly in the precatalyst structure at the top.
Figure 98
Figure 98
(a) Schematic representation of SABRE polarization transfer via 1H-1H spin-relays in a millitesla magnetic field to enable spontaneous polarization transfer from p-H2-derived hydrides through all proton sites of pyridine substrate molecule via 3- and 4-bond 1H-1H spin–spin couplings. (b) Schematic representation of SABRE-SHEATH polarization transfer via 15N–15N spin-relays in a microtesla magnetic field to enable spontaneous polarization transfer of p-H2-derived hyperpolarization through all 15N sites of [15N3]metronidazole molecule via 2-bond 15N–15N spin–spin couplings. In (a,b), not all ligands are shown to simplify the structures (cf. Figure 97). (a) Adapted with permission from ref (805). Copyright 2021 Wiley-VCH GmbH.
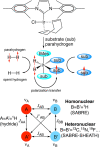
Figure 99
Figure 99
(a) Schematic diagram of the automated hyperpolarized sample preparation process featuring an external reaction cell, an NMR flow probe, and a B0 polarization coil. (b,c) 1H NMR signal response profiles of pyridine measured as a function of the external polarization field for (b) the hydrogen atom in the para position of the pyridine ring, which shows longitudinal magnetization, and (c) longitudinal two-spin order terms spanning the three sites. Reproduced with permission from ref (802). Copyright 2011 American Chemical Society.
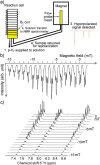
Figure 100
Figure 100
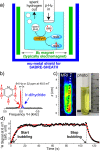
(a) Typical experimental setup showing delivery of p-H2 gas to the sample (the bubbles delivered by a catheter as shown, or sample shaking). The exchange at the catalyst leads to production of spent H2 (i.e., H2 with a reduced p-H2 enrichment level) exiting the solution (the nominal conversion of the para state, denoted as ↑↓, to the “spent” state in the figure is shown to emphasize that parahydrogen excess in solution is depleted upon the exchange; note, however, that an excess ortho state cannot be created via this process). An electromagnet is typically employed to create a static magnetic field for optimum polarization transfer via SABRE; a magnetic shield is required for SABRE-SHEATH experiments in microtesla magnetic fields. The produced hyperpolarization can be detected in situ or ex situ at higher magnetic fields using sample transfer. (b) In situ NMR spectroscopy of proton-hyperpolarized pyridine by SABRE at 48.5 mT. (c) Corresponding MR image (acquired at 48.5 mT) and sample photograph, demonstrating that the entire sample is indeed hyperpolarized. (d) In situ monitoring of SABRE process polarization build-up and decay corresponding to starting and stopping of p-H2 delivery (via bubbling) performed at 6 mT. (b–d) Adapted with permission from ref (833). Copyright 2014 WILEY-VCH Verlag GmbH & Co. KGaA, Weinheim.
Figure 101
Figure 101
(a) Photograph of the micro-SABRE platform mounted on the head of the NMR probe (left), and schematic drawing displaying the main components of the micro-NMR platform (right). Red lines indicate gas flow paths, blue lines are fluidic flow paths. The meandering channel gas–liquid contactor visible at the upper extremity of the platform is depicted in (d). (b) An overview of the main components of the experimental layout. The gas and solution are pneumatically transported through the NMR probe mounted in an 11.74 T NMR magnet, where the custom probehead insert performs the SABRE experiment. Parahydrogen gas flow is regulated outside of the NMR probe to ensure proper pressure equilibration throughout the system. The sample solutions are injected with a standard syringe pump; any excess fluid running out of the detection area is collected in a spill-out chamber inside the NMR probe body. The area of the Helmholtz pair is 1.13 mm2, the detection volume enclosed by the coil is 0.56 μL. (c) Schematic representation of the SABRE process. A p-H2 molecule coordinates to an iridium-centered catalyst. Each hydride then has a distinct, enhanced signal in the 1H NMR spectrum. In the presence of a coordinated substrate, the chemical shift of the hydride is slightly modified. Simultaneously, spin-order is transferred through the coupling network from the p-H2 to the target molecule. A hyperpolarized substrate and a used p-H2 molecule are released from the complex. (d) Schematic diagram of the gas–liquid contact channel. (e) Schematic drawing of the meandering channel for improved contact area. On the gas side, the total channel length is 180 mm while the enclosed volume is 4.8 μL. On the gas side, the fluidic path is 120 mm long and the channel volume is 20.2 μL. The total area available for gas exchange is 45 mm2. Reproduced from ref (839) with permission from the Royal Society of Chemistry.
Figure 102
Figure 102
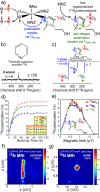
15N SABRE-SHEATH studies of [15N3]metronidazole. (a) Schematic representation of SABRE-SHEATH chemical exchange process and spin-relayed polarization transfer. (b) 15N NMR spectrum of thermally polarized signal reference compound (neat pyridine-15N) at 1.4 T; the sample is employed as an external polarization reference to measure polarization levels in (c). (c) 15N NMR spectrum of hyperpolarized [15N3]metronidazole (MNZ-15N3) hyperpolarized via SABRE-SHEATH and recorded at 1.4 T. (d) 15N polarization buildup of [15N3]metronidazole during SABRE-SHEATH process at ∼0.6 μT. (e) SABRE-SHEATH field optimization. (f,g) 15N MR images of hyperpolarized [15N3]metronidazole. (a,e) Adapted with permission from ref (840). Copyright 2021 John Wiley & Sons, Ltd. (b–d, f, g) Adapted from ref (841) with permission from the Royal Society of Chemistry.
Figure 103
Figure 103
Two approaches for preparation of catalyst-free SABRE-hyperpolarized solutions. (a) Schematic representation of heterogeneous (HET) 15N SABRE-SHEATH process to produce 15N-hyperpolarized pyridine (Py). (b) Schematic representation of SABRE hyperpolarization of metronidazole drug followed by catalyst capture by functionalized silica beads resulting in transparent catalyst-free solution of hyperpolarized metronidazole. (a) Adapted with permission from ref (850). Copyright 2017 Wiley-VCH Verlag GmbH & Co. KGaA, Weinheim. (b) Reproduced with permission from ref (851). Copyright 2018 American Chemical Society.
Figure 104
Figure 104
(a) Schematic representation of 15N SABRE-SHEATH hyperpolarization of [15N2]imidazole with pKa of ∼7.0. Note the change in chemical shift of hyperpolarized 15N resonance in a broad dynamic range as a function of pH shown on the right: pH 12.0 (red), 8.0 (orange), 7.0 (black), 6.2 (green), and 4.6 (blue). (b) Metabolism of nitroimidazole compounds on the example of nimorazole in hypoxic environment; color-coded values of 15N chemical shifts (in ppm) were computed for aqueous media using Gaussian’09 ab initio calculations. (a) Reproduced with permission from ref (870). Copyright 2016 American Chemical Society. (b) Reproduced with permission from ref (842). Copyright 2020 Wiley-VCH GmbH.
Figure 105
Figure 105
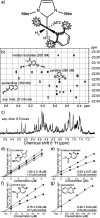
(a) Schematic representation of the asymmetric [Ir(IMes)(H)2(MTZ)2(sub)]Cl complex for a pyridine-like substrate (sub) in the presence of a large excess of 1-methyl-1,2,3-triazole (MTZ) as cosubstrate. Only hydride HA, in the trans position with respect to the substrate, displays an appreciable scalar coupling interaction with substrate protons HM. (b) A 2D 1H-1H correlation spectrum between enhanced hydrides and aromatic protons of a mixture of 13 SABRE substrates with concentrations between 250 nM and 2 mM. The spectrum was recorded in 23 min at 258 °C in the presence of 2 mM metal complex, 30 mM MTZ, and 5 bar of 51%-enriched p-H2. (c) 1D spectrum of the same substrates mixture, in the absence of metal complex, MTZ, and p-H2. This spectrum was acquired with 32,768 scans in 9.5 h using a 30° flip-angle pulse and a recovery delay of 1 s. All spectra were acquired at 500 MHz 1H resonance frequency. (d–g) Standard addition curves for (−)-cotinine (d), methyl nicotinate (e), nicotinic acid (f), and quinazoline (g). The symbols used in the graphs refer to different protons, as indicated next to the molecular structures. Note that each (−)-cotinine proton results in two resonances when bound to iridium because of formation of diastereomeric complexes. Reproduced with permission from ref (847). Copyright 2015 WILEY-VCH Verlag GmbH & Co. KGaA, Weinheim.
Figure 106
Figure 106
Energy level structure of the methyl rotor. The tunnel splitting is given by ℏωt(i) where i indicates the librational state. The energy levels are labeled by their spatial symmetry, and the Zeeman interaction splits the rotational energy levels. Proton–proton dipolar coupling shifts the A states (δ). The dashed lines represent rapid transitions that do not require a change of symmetry species, and the solid lines represent slow transitions between A and E rotational states. H and J indicate A/E transitions that involve states in the A manifold shifted down or up in energy by the dipolar interaction, respectively. Reproduced with permission from ref (115). Copyright 1999 Elsevier Science B.V.
Figure 107
Figure 107
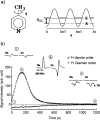
Haupt effect in a solid sample of γ-picoline. (a) Molecular structure of γ-picoline with a simplified diagram showing the potential energy of the CH3 group, with the lowest librational levels shown, and the A/E tunnel splitting labeled ℏωt. (b) The dipolar and Zeeman signals arising from the sample after a temperature jump from 4 to 55 K are shown in the plot. Spectra were acquired by applying 0.05° flip-angle pulses, and the plotted points were obtained by integrating the real and imaginary components of the spectra, respectively. This is possible because the signal originating from dipolar order after applying a single RF pulse is 90° out of phase with respect to the signal originating from Zeeman order. The A/E transitions initially lead to a build-up of dipolar order, which subsequently decays due to spin relaxation. The Zeeman order is not affected by the temperature jump, beyond reequilibrating at a lower polarization level at the higher temperature. Representative spectra at three time points are shown in the insets. Reproduced from ref (903) with the permission of AIP Publishing.
Figure 108
Figure 108
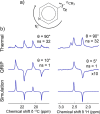
(a) A molecule of γ-picoline shown with the methyl rotational correlation time τR and the overall molecular tumbling correlation time τC labeled. (b) 1H and 13C spectra of the methyl moiety showing the dQRIP effect in comparison with thermal equilibrium signals acquired at 9.4 T. The spectral lines enhanced by dQRIP show a characteristic mixed absorption/emission line shape, which is simulated beneath. The RF pulse flip angle (θ) and number of transients (ns) are shown by each experimental spectrum. Adapted with permission from ref (905). Copyright 2013 American Chemical Society.
Figure 109
Figure 109
SEOP is a two-step process. Angular momentum from circularly polarized light (σ+ or σ photon) is transferred to the electron spin during absorption by the rubidium electronic structure in the optical pumping process that leads to electron spin polarization. Spin exchange transfers the electron spin hyperpolarization to the nuclear spin of a noble gas (here, the isotope 129Xe with spin I = 1/2).
Figure 110
Figure 110
Concept of optical pumping using the D1 transition, with ΔmJ = −1 transitions illustrated here. Note that the conservation of angular momentum dictates the selection rules for circular photon absorption to be either ΔmJ = −1 or +1, depending on circularity of the photons (σ+ or σ) and the direction of the magnetic field (i.e., parallel or antiparallel to the laser beam). The D1 transition wavelength for Rb is 794.7 nm. Although optical pumping shown here transfers the electrons into the mS = −1/2 sublevel of the excited state (P-term), collisional mixing in the excited state and relaxation in both sublevels mixes the spin states again. Nevertheless, due to continuous optical pumping, the +1/2 sublevel gets depleted while the −1/2 sublevel gets increasingly populated.
Figure 111
Figure 111
5s rubidium electron wave function ψ(R) during interaction with a xenon atom. Note the large nonzero value at the location of the xenon nucleus. Adapted with permission from ref (930). Copyright 1997 American Physical Society.
Figure 112
Figure 112
Processes that lead to Fermi contact interaction (see Figure 111) and therefore may result in spin exchange. (a) Binary collisions are not very effective but there are many such events in the gas phase. Furthermore, binary collisions may cause spin exchange even in the presence of a strong magnetic field as the short duration of the coupling leads to a relaxation-like transfer process rather than coherent coupling. (b) Three-body collisions may lead to a short-lived van der Waals complex with high probability of spin exchange during the lifetime τ of the complex.
Figure 113
Figure 113
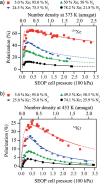
Nuclear spin polarization of 129Xe (a) and 83Kr (b) as a function of SEOP cell pressure for various mixtures. The polarization values are the maximum polarization at a given noble gas density after the steady state has been reached. Reproduced from ref (925). Copyright 2011 The Authors. Published by PLOS.
Figure 114
Figure 114
Consequences of the sign of the gyromagnetic ratio. NMR spectra of thermally polarized 129Xe (a) and 131Xe (c) are shown after individual zero-order phase correction. NMR spectra of hyperpolarized 129Xe (b), with the inset showing noise level after 300× magnification, and 131Xe (d) after SEOP of the transition ΔmJ = −1 and application of the same zero-order phase correction as for the thermal spectrum of the respective isotope. For visualization of the underlying process, the associated energy levels and their populations at high-temperature thermal equilibrium (a and c) and after optical pumping using the transition ΔmJ = −1 (b and d) are also shown. Note that the triplet observed for 131Xe in the gas phase is a consequence of quadrupolar couplings. Adapted from ref (918). Copyright 2011 The Authors. Published by Elsevier under CC BY 3.0 license.
Figure 115
Figure 115
Commercial Polarean 9820-A polarizer as an example of a SEOP system operating in a continuous-flow mode. (a) SEOP cell visualizing the continuous-flow concept. Lean Xe SEOP gas mixture flows through a heated presaturation chamber to take on Rb vapor before entering the actual SEOP cell that is irradiated by the 795 nm laser beam. (b) The location of the SEOP cell within magnetic field produced by four coils. (c) After SEOP in the cell, the hyperpolarized 129Xe enters a borosilicate cryotrap kept at the liquid nitrogen temperature of 77 K, where it is cryo-separated from helium and molecular nitrogen buffer gases that pass through the trap without condensation. Reprinted with permission from ref (934). Copyright 2020 Elsevier.
Figure 116
Figure 116
Thermal management system containing the SEOP cell (a) and plain SEOP cell (c) of the commercial XeUS GEN-3 polarizer as an example of a batch mode SEOP system. The aluminum heating jacket and heat sink shown in (a) result in localized temperature distribution as depicted in the thermal image (b). (e) Overall assembly of laser diode array (LDA), solenoid coil for the magnetic field and SEOP cell and thermal management system. Reproduced with permission from ref (958). Copyright 2020 American Chemical Society.
Figure 117
Figure 117
129Xe as a biomarker for gas exchange in the lung. (a) Xenon gas in the alveolus resonates at 0 ppm and, after dissolving into the parenchymal tissue barrier (TP, 195 ppm resonance), will transfer to the red blood cells (RBC), where it resonates around 215 ppm. (b) Example of 129Xe NMR spectra obtained from a healthy volunteer (black line) and a patient with IPF (blue line) where a reduction of the RBC peak compared to the TP peak is visible. Adapted from ref (980). Copyright 2021 The authors. Published by Elsevier under CC BY 4.0 license.
Figure 118
Figure 118
Early example of ratio maps from chemical-shift-selective hyperpolarized 129Xe MRI of a patient with moderate COPD. Reproduced with permission from ref (997). Copyright 2013 Wiley Periodicals, Inc.
Figure 119
Figure 119
Concept of in vivo molecular imaging with a nonfunctionalized molecular cage used for HyperCEST. (a) Hyperpolarized 129Xe is generated through SEOP. (b) A solution containing the molecular cage, i.e., cucurbit[6]uril (CB6), is injected intravenously into the tail vein. (c) After injection of the CB6 and its distribution throughout the bloodstream, a mixture of 80% xenon/20% oxygen is used for mechanical ventilation of a rat. (d) Due to rapid exchange of xenon in the dissolved phase (for example in the blood plasma) with the molecular cage system, the interaction of the hyperpolarized 129Xe with CB6 is detected indirectly by the decay of the signal of freely dissolved hyperpolarized 129Xe at 0 ppm when the HyperCEST presaturation pulse is applied at the chemical shift frequency of the Xe–CB6 complex at about −70 ppm. (e) Molecular imaging of the CB6 presence is enabled by the presaturation pulse at −70 ppm that reduces the pool of hyperpolarized xenon (depicted in blue, but only in the presence of CB6 cages. This is compared to a control experiment with a presaturation pulse applied at +70 ppm, for example, that does not cause depolarization. Adapted from ref (1012). Copyright 2017 The Authors. Published by Springer Nature under CC BY license.
Figure 120
Figure 120
Hyperpolarized 129Xe MRI, 2H MRI, and X-ray tomography incorporated in a schematic representation of a diesel particulate filter (DPF) catalytic converter. Grayscale images (right side) inform about water (D2O) distribution across the whole monolith cross-section using 2H MRI. Hyperpolarized (hp) 129Xe MRI (color maps) reveals the spatial extent of permeation of xenon away from the central channel at different water saturations (free pore volumes) but also depict hyperpolarized 129Xe depolarization at the highest free pore volume that indicates accessibility to paramagnetic catalytic sites. Arrows drawn on the synchrotron-based X-ray tomography images inform about the noble gas pathways at various free pore volume levels that lead to depolarization (blue arrows) when the smallest pores of the catalytically active washcoat, located in the central regions of the monolith walls, become accessible. Adapted with permission from ref (1017). Copyright 2020 Elsevier B.V.
Figure 121
Figure 121
(a) Hyperpolarized 83Kr SQUARE T1n map of control lung and (b) of emphysema model lung. The frequency of the T1n, i.e., the pixel (voxel) count with a particular T1n value, is shown as the histograms next to the SQUARE maps (labels ’f’ and “sl” refer to the fast and slow components of the bimodal fitting of the distributions, respectively; EV = expected value). There is a clear shift of the T1n relaxation times distribution in the histogram of the disease model toward longer times. The inset shows the four parameters that can be extracted from bimodal Gaussian fitting of the histograms: the most probable (or expected) value T1EV(f) of the fast Gaussian component in the bimodal distribution; the expected value of the slow component T1EV(sl); and the full width at half-maximum of the fast and slow components, FWHM (T1(f)) and FWHM (T1(sl)), respectively. The two parameters, T1EV(f) and T1EV(sl), enabled a statistically significant distinction between the emphysema model and the control lungs. Adapted from ref (1018). Copyright 2015 The Authors. Published by the Royal Society.
Figure 122
Figure 122
Optical pumping in bulk GaAs as a precursor to the use of nuclei to control local fields. NMR signal intensity is plotted versus the wavelength of light used to excite the bulk semiconductor. The gray band represents the optical band gap of GaAs at the sample temperature, 10 K. The inset at lower right shows a sample data set for 71Ga NMR as a function of σ+ (green) and σ (black) photon energy. Here the NMR lines are arranged in order of optical excitation energies. Reprinted with permission from ref (31). Copyright 2010 Elsevier.
Figure 123
Figure 123
Map of the distribution of nuclear polarization, and thus local fields, in GaAs. Nuclear magnetization diffuses from “shallow defects” to bulk spins while nuclei near “deep defects” remain virtually unpolarized (blue areas). The red dots at the center of the blue circles represent the small fraction of nuclear spins near deep defects directly polarized via OPNMR. Reprinted with permission from ref (1044). Copyright 2013 American Physical Society.
Figure 124
Figure 124
Schematic depicting a 1D NMR image of the spatially dependent nuclear polarization in GaAs. The “depletion zone” represents a region in the wafer where the occupancy of shallow donor sites is limited due to their ionization from surface electric fields. In the “hyperfine zone” the resulting signal is “negative” via hyperfine cross-relaxation with photoexcited electrons captured at defect sites, and the “quadrupolar” zone represents the region in the wafer where optical absorption has reduced the light intensity to the point where shallow donor occupancy is once again limited, leading to nuclear spin thermalization (positive) owing to relaxation from fluctuating electric fields. This spatial patterning of nuclear magnetization emerges with no lithographic techniques nor magnetic materials. Adapted by permission from ref (96), Springer Nature Customer Service Centre GmbH. Copyright 2012 Springer Nature.
Figure 125
Figure 125
(a) Energy level diagram for the two spin-1/2 particles (an electron and a 31P nucleus) at the phosphorus dopant site in crystalline silicon at a given orientation of the crystal in the field. The energy levels are not drawn to scale as the gyromagnetic ratio of the 31P nucleus is ∼1600 times smaller than that of the electron. The conditional NOT gate is shown in red: the 31P spin is “flipped” only when the electron spin is in the β state. (b) The phosphorus dopant in crystalline silicon (in pink). The Bohr radius of the donor electron associated with this defect is stylized with the shaded sphere; this Bohr radius is about 12 times the carbon–carbon bond length.
Figure 126
Figure 126
(a) Manifestation of EPR-detected single phosphorus spin resonance. The coupling J splits the EPR transition, yet because the single-spin transistor detection of the EPR signal occurs faster that the nuclear spin flip time, either the blue or green spectrum is detected, but not both. (b) Rapid jumps between the blue and green frequencies yields the fraction of electron spins in one state. Measurements over long periods of time show episodic “jumps” to the other EPR frequency, indicating the nuclear spin has flipped. (c) Binning these flips yields the 31P NMR spectrum. Adapted with permission from ref (1051), Springer Nature Customer Service Centre GmbH. Copyright 2013 Springer Nature.
Figure 127
Figure 127
NMR spectroscopy as manifest in ultracold arrays of alkaline earth metal atoms arranged in space with optical tweezers. (a) Jablonski diagram for the ground and excited states of a typical metal atom where the total angular momentum F⃗ = I⃗ + L⃗ + S⃗, with I, L, and S being the nuclear spin, orbital, and electron spin angular momenta. (b) Stylized arrangement of lenses, objective, detector, and spatial array of atoms. (c) Echo coherence (“magnetization”) between the nuclear spin sublevels as a function of delay time showing effective spin relaxation times of ∼40 s. See text for details. Adapted from ref (1053). Copyright 2022 The Authors. Published by Springer Nature under CC BY license.

References

    1. Moser E.; Laistler E.; Schmitt F.; Kontaxis G. Ultra-High Field NMR and MRI - the Role of Magnet Technology to Increase Sensitivity and Specificity. Frontiers in Physics 2017, 5, 33. 10.3389/fphy.2017.00033. - DOI
    1. Gloggler S.; Blumich B.; Appelt S. NMR Spectroscopy for Chemical Analysis at Low Magnetic Fields. Top. Curr. Chem. 2011, 335, 1–22. 10.1007/128_2011_304. - DOI - PubMed
    1. Blanchard J. W.; Budker D.; Trabesinger A. Lower Than Low: Perspectives on Zero- to Ultralow-Field Nuclear Magnetic Resonance. J. Magn. Reson. 2021, 323, 106886. 10.1016/j.jmr.2020.106886. - DOI - PubMed
    1. Burueva D. B.; Eills J.; Blanchard J. W.; Garcon A.; Picazo-Frutos R.; Kovtunov K. V.; Koptyug I. V.; Budker D. Chemical Reaction Monitoring Using Zero-Field Nuclear Magnetic Resonance Enables Study of Heterogeneous Samples in Metal Containers. Angew. Chem., Int. Ed. 2020, 59, 17026–17032. 10.1002/anie.202006266. - DOI - PMC - PubMed
    1. Blanchard J. W.; Sjolander T. F.; King J. P.; Ledbetter M. P.; Levine E. H.; Bajaj V. S.; Budker D.; Pines A. Measurement of Untruncated Nuclear Spin Interactions via Zero- to Ultralow-Field Nuclear Magnetic Resonance. Phys. Rev. B 2015, 92, 220202. 10.1103/PhysRevB.92.220202. - DOI