Review
. 2023 Apr 1:269:119898.
doi: 10.1016/j.neuroimage.2023.119898. Epub 2023 Jan 24.

Applications of generative adversarial networks in neuroimaging and clinical neuroscience

Affiliations
Review

Applications of generative adversarial networks in neuroimaging and clinical neuroscience

Rongguang Wang et al. Neuroimage. .

Abstract

Generative adversarial networks (GANs) are one powerful type of deep learning models that have been successfully utilized in numerous fields. They belong to the broader family of generative methods, which learn to generate realistic data with a probabilistic model by learning distributions from real samples. In the clinical context, GANs have shown enhanced capabilities in capturing spatially complex, nonlinear, and potentially subtle disease effects compared to traditional generative methods. This review critically appraises the existing literature on the applications of GANs in imaging studies of various neurological conditions, including Alzheimer's disease, brain tumors, brain aging, and multiple sclerosis. We provide an intuitive explanation of various GAN methods for each application and further discuss the main challenges, open questions, and promising future directions of leveraging GANs in neuroimaging. We aim to bridge the gap between advanced deep learning methods and neurology research by highlighting how GANs can be leveraged to support clinical decision making and contribute to a better understanding of the structural and functional patterns of brain diseases.

Keywords: GAN; Generative adversarial network; Neuroimaging; Pathology; Review.


Conflict of interest statement

Declaration of Competing Interest The authors report no competing interest.

Figures

Fig. 1.
Fig. 1.
Semantics of the original GAN and its extensions. (A) Original GAN architecture where z, x and y denote random noise, generated image, and real image. G and D represent generator and discriminator separately. Wasserstein GAN, deep convolutional GAN, and self-attention GAN share the same structure of the original GAN but use a different loss function, convolutional block and self-attention module, respectively. (B) Progressive growing GAN architecture. The resolution of each generated image x1,x2,. .., xn and real image y1, y2,. .., yn is increasing from left to right. The number of layers within each generator G1, G2,. .., Gn and discriminator D1, D2,. .., Dn is also growing accordingly. (C) Conditional GAN architecture where z, y, x, x denote random noise, extra label/information, real data, and generated data, respectively. Concatenation of random noise z and label y are input to the generator and concatenation of label y and generated/real data are input to the discriminator. (D) Cycle-GAN structure where x1, y2 denote umpired data from two different modalities, and x2, y1 denote generated data for the corresponding modality. G1 transform data from modality X to Y, and G2 transforms inversely. Generated data y1 is reconstructed back to input x1 through G2 and same for generated data x2. (E) Info-GAN structure, where z, c, x, x denote random noise, informative part of latent variable, real data, and generated data. Concatenation of z and c are input to the generator. Informative latent c are reconstructed through an encoder E from generated data x = G(z, c). (F) MUNIT GAN structure where x1, y2, x2, y1 denote unpaired data and generated data from two different modalities, X and Y. cx1, cy2, sx1, sy2 denote content and style variables derived from data from two modalities, respectively. Data x1 is firstly decoded into content cx1 and style variable sx1 respectively. Then, the content variable cx1 is concatenated with a style variable from the Y modality to generate data y1 through the generator G1. Concatenation of cx1 and sx1 are used as input for reconstruct x1 through G2. Same process also applies to the reverse direction. Images are taken and adapted from Goodfellow et al. (2014), Karras et al. (2018), Chen et al. (2016), Mirza and Osindero (2014), Zhu et al. (2017), Huang et al. (2018).
Fig. 2.
Fig. 2.
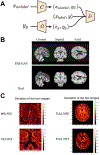
GAN applications in disease classification with single- and multi-modal imaging. (A) Schematic of THS-GAN for Alzheimer’s disease and mild cognitive impairment classifications. (B) Comparison of synthesized brain MR images from THS-GAN and real T1-weighted scans with coronal, sagittal, and axial views for different training epochs. (C) Deviation between real image and synthetic images generated by Rev-GAN. In the deviation image, the yellow color represents large differences, and the dark colors denote small deviations. Images are taken and adapted from Lin et al. (2021), Yu et al. (2021).
Fig. 3.
Fig. 3.
GAN applications in neuroimaging-based anomaly detection. (A) Schema of AnoGAN. Training is performed on health subjects to learn z, a latent space representing the data distribution. Inference is performed by sampling from z to generate image x, such that the difference between x and the anomalous image xa is minimized. (B) Illustration of the latent space distribution produced by AnoGAN. Images are taken and adapted from Schlegl et al. (2017).
Fig. 4.
Fig. 4.
GAN applications in modeling healthy brain aging. (A) Schematic of the conditional GAN model for modeling the brain aging process across the whole lifespan. xi : generator input; 0 : target age vector; ad : age difference between current age ai and target age a0; x^0: generator output; v1, v2, v1, v2: latent embedding. Generator synthesizes brain image of target age and health state, and judge network gives a discrimination score of whether the image given to the discriminator is real or fake. LID, Lrec, LGAN refer to identity loss, reconstruction loss and adversarial loss, respectively. (B) Examples of healthy brain aging modeling using the GAN described in (A). Bottom panel shows the images synthesized at different target ages a0, and the top panel shows the absolute difference between input image xi and synthesized image x^0. (C) Schematic of the perceptual adversarial network (PGAN). (D) Multi-modal perceptual adversarial network (MPGAN) architecture. x, xT1, xT2: input 3D MR volume; G(x), GT1 (xT1, xT2), GT2 (xT1, xT2): generated output; y, yT1, yT2: real 3D MR volume; D, DT1, DT2: discriminator networks; ϕ: feature extraction network; LVR, LP, Ladv refer to voxel-wise reconstruction loss, perceptual loss, and adversarial loss. Images are taken and adapted from Xia et al. (2021), Peng et al. (2021).
Fig. 5.
Fig. 5.
GAN applications in generating disease progression scans from a single time point. (A) Schematic of DANI net. The input to DANI net is a T1 MR image from subject p at age θ with diagnosis d. The output of the decoder is a set of longitudinal scans. Several loss functions (reconstruction loss Lrec, biological constraints Lbio, discriminator losses LDz and LDb) are combined together to train DANI net using a single time point of subject p. (B) Longitudinal MRIs synthesized using 4D-DANI-Net for a 69 years old cognitive normal subject from three orientations. The blue box indicates the input MRI and other images are synthesized MR scans from the model. Two magnified regions are illustrated at the bottom panel. Images are taken and adapted from Ravi et al. (2019).
Fig. 6.
Fig. 6.
GAN applications in disease subtypes discovery (four-dimensional coordinate system developed by SMILE-GAN). (A) Voxel-wise statistical comparison (onesided t-test) between cognitive normal subjects and subjects that predominantly belong to each of the four Alzheimer’s disease neuroanatomical patterns. (B) Visualization of subjects that belong to the four subtype clusters in a diamond plot. Images are taken and adapted from Yang et al. (2021).
Fig. 7.
Fig. 7.
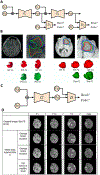
GAN applications in brain lesion (white matter hyperintensities and multiple sclerosis) evolution prediction. (A) Schematic of the GAN for white matter hyperintensities evolution prediction. (B) Disease evolution map examples produced by GAN and the derived irregularity map from two time points. (C) Two-stage conditional GAN for [11 C] PIB PET images generation from multi-sequence MR images for myelin content in multiple sclerosis dynamic prediction. (D) Examples of myelin content changes indicating demyelination (red color) and remyelination (blue color) from both GAN outputs and real PET images. Images are taken and adapted from Wei et al. (2020), Rachmadi et al. (2020).
Fig. 8.
Fig. 8.
GAN applications in brain tumor growth prediction. (A) GP-GAN architecture for glioma growth prediction. xgi : generated image at time point i; Gi : generator at time point i; Di: discriminator at time point i. (B) Growth prediction for subjects with low-grade glioma (left) and high-grade glioma (right) at different time points via GP-GAN. GT: ground truth; Pre: prediction. (C) Schematic of SMIG model. The model is trained to 1) generate an abnormal brain based on a healthy brain from ADNI dataset and tumor volume from TCIA; 2) change tumor location. xR : image represents a healthy brain or tumor in real location; xV : tumor volume provided by TCIA; xG: generated image; G: generator; D: discriminator. (D) SMIG model applications on single patient images from BraTS dataset. Images are taken and adapted from Elazab et al. (2020), Kamli et al. (2020).

Similar articles

Cited by

References

    1. Abrol A, Fu Z, Salman M, et al., 2021. Deep learning encodes robust discriminative neuroimaging representations to outperform standard machine learning. Nat. Commun 12 (1). doi: 10.1038/s41467-020-20655-6. - DOI - PMC - PubMed
    1. Angeli S, Emblem KE, Due-Tonnessen P, Stylianopoulos T, 2018. Towards patient-specific modeling of brain tumor growth and formation of secondary nodes guided by DTI-MRI. NeuroImage Clin 20, 664–673. doi: 10.1016/j.nicl.2018.08.032. - DOI - PMC - PubMed
    1. Arjovsky M, Chintala S, Bottou L, 2017. Wasserstein generative adversarial networks. In: Proceedings of the 34th International Conference on Machine Learning PMLR.
    1. Arvanitakis Z, Shah RC, Bennett DA., 2019. Diagnosis and management of dementia: review. JAMA 322 (16), 1589. doi: 10.1001/jama.2019.4782. - DOI - PMC - PubMed
    1. Bakas S, Reyes M, Jakab A, Bauer S, Rempfler M, Crimi A, Jambawalikar SR (2018). Identifying the best machine learning algorithms for brain tumor segmentation, progression assessment, and overall survival prediction in the BRATS challenge. arXiv preprint arXiv: 1811.02629

Publication types