

Hippocampal glucocorticoid receptors modulate status epilepticus severity
- PMID: 36702319
- PMCID: PMC10055427
- DOI: 10.1016/j.nbd.2023.106014
Hippocampal glucocorticoid receptors modulate status epilepticus severity
Abstract
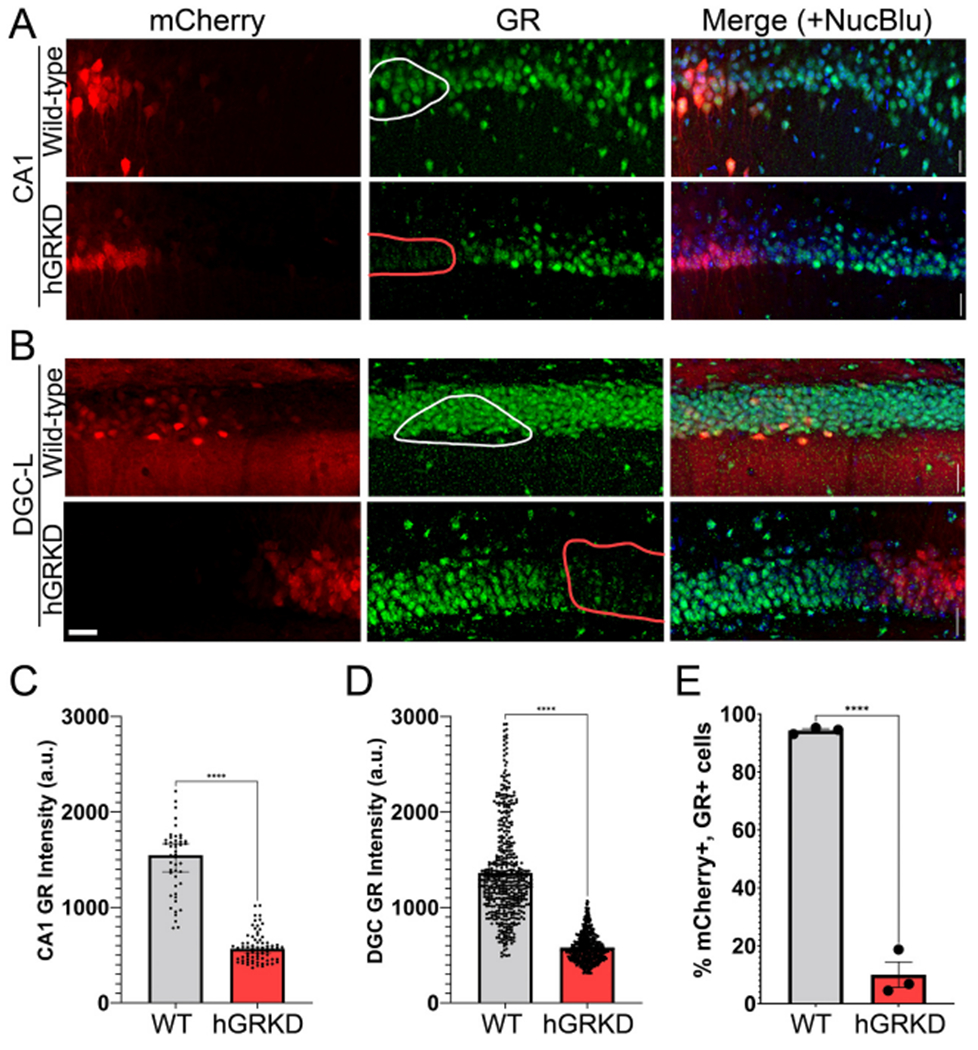
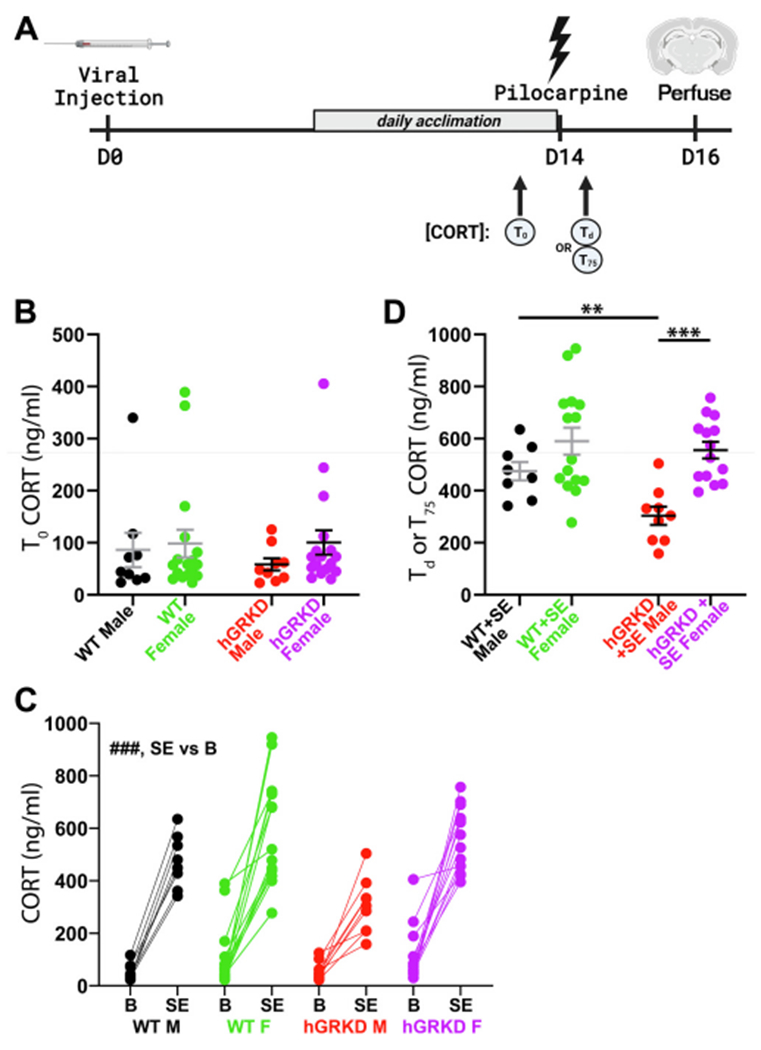
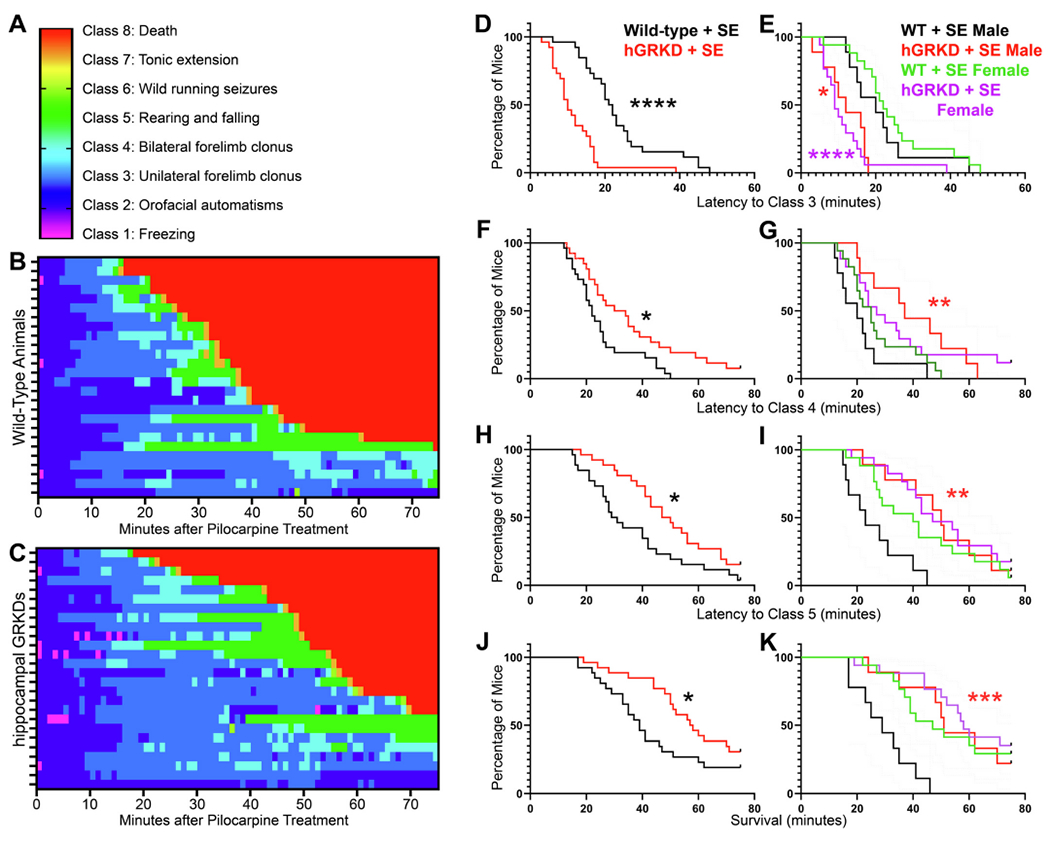
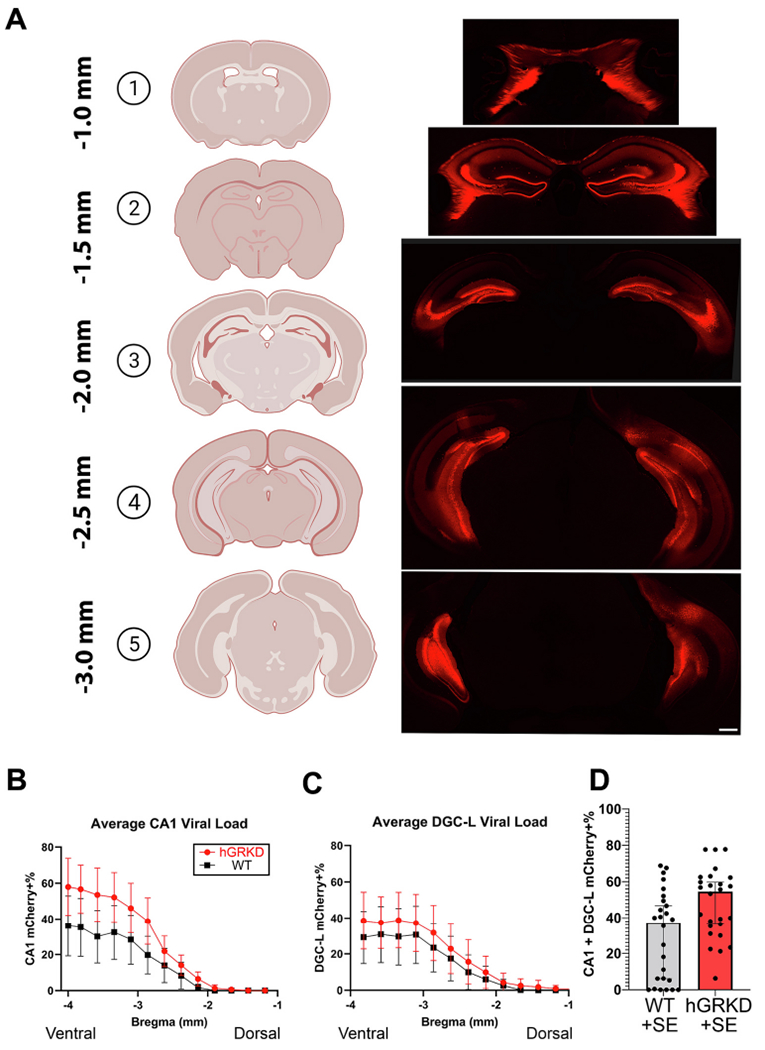
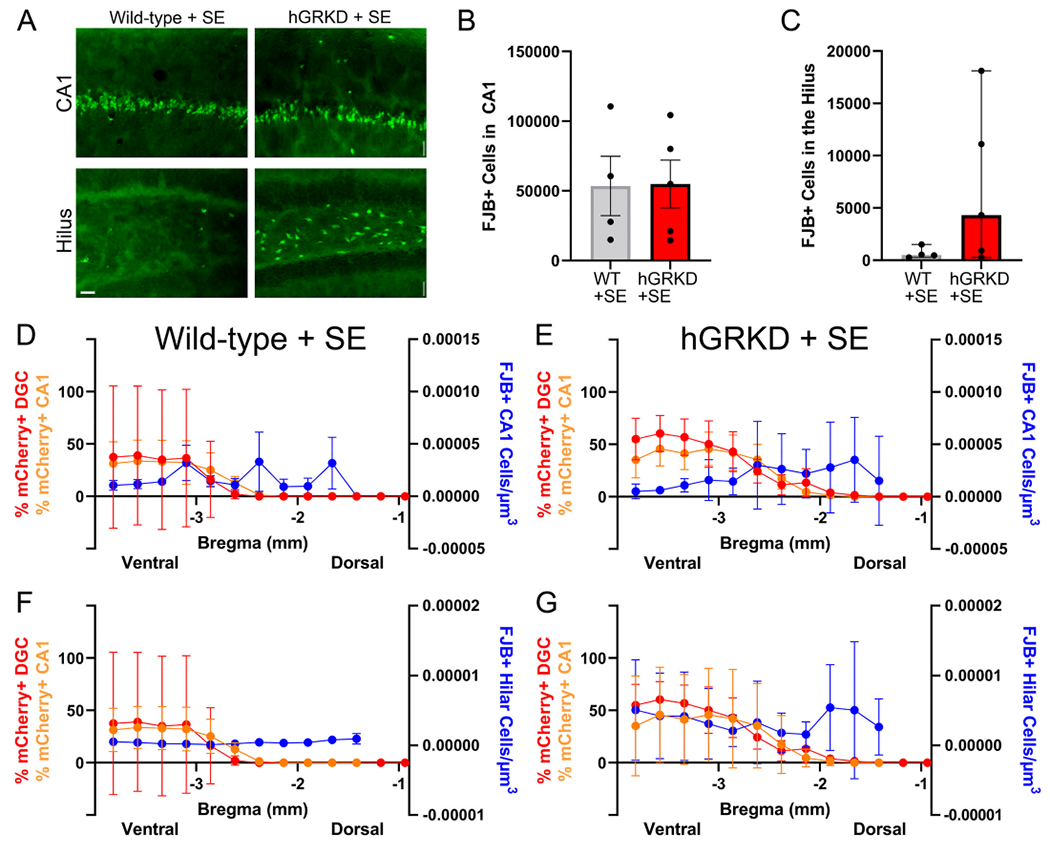
Status epilepticus (SE) is a life-threatening medical emergency with significant morbidity and mortality. SE is associated with a robust and sustained increase in serum glucocorticoids, reaching concentrations sufficient to activate the dense population of glucocorticoid receptors (GRs) expressed among hippocampal excitatory neurons. Glucocorticoid exposure can increase hippocampal neuron excitability; however, whether activation of hippocampal GRs during SE exacerbates seizure severity remains unknown. To test this, a viral strategy was used to delete GRs from a subset of hippocampal excitatory neurons in adult male and female mice, producing hippocampal GR knockdown mice. Two weeks after GR knockdown, mice were challenged with the convulsant drug pilocarpine to induce SE. GR knockdown had opposing effects on early vs late seizure behaviors, with sex influencing responses. For both male and female mice, the onset of mild behavioral seizures was accelerated by GR knockdown. In contrast, GR knockdown delayed the onset of more severe convulsive seizures and death in male mice. Concordantly, GR knockdown also blunted the SE-induced rise in serum corticosterone in male mice. GR knockdown did not alter survival times or serum corticosterone in females. To assess whether loss of GR affected susceptibility to SE-induced cell death, within-animal analyses were conducted comparing local GR knockdown rates to local cell loss. GR knockdown did not affect the degree of localized neuronal loss, suggesting cell-intrinsic GR signaling neither protects nor sensitizes neurons to acute SE-induced death. Overall, the findings reveal that hippocampal GRs exert an anti-convulsant role in both males and females in the early stages of SE, followed by a switch to a pro-convulsive role for males only. Findings reveal an unexpected complexity in the interaction between hippocampal GR activation and the progression of SE.
Keywords: Dentate gyrus; Epilepsy; Fluoro-Jade B; Hypothalamic-pituitary adrenal axis; Pilocarpine; Seizure threshold; Sex differences.
Copyright © 2023 The Authors. Published by Elsevier Inc. All rights reserved.
Conflict of interest statement
Declaration of Competing Interest The authors have no relevant conflicts of interest to disclose.
Figures
Similar articles
-
The glucocorticoid receptor specific modulator CORT108297 reduces brain pathology following status epilepticus.Exp Neurol. 2021 Jul;341:113703. doi: 10.1016/j.expneurol.2021.113703. Epub 2021 Mar 18. Exp Neurol. 2021. PMID: 33745919 Free PMC article.
-
Effect of neonatal isolation on outcome following neonatal seizures in rats--the role of corticosterone.Epilepsy Res. 2006 Feb;68(2):123-36. doi: 10.1016/j.eplepsyres.2005.10.005. Epub 2005 Nov 28. Epilepsy Res. 2006. PMID: 16316743
-
Brain corticosteroid receptor balance in health and disease.Endocr Rev. 1998 Jun;19(3):269-301. doi: 10.1210/edrv.19.3.0331. Endocr Rev. 1998. PMID: 9626555 Review.
-
Inhibition of sodium glucose cotransporters following status epilepticus induced by intrahippocampal pilocarpine affects neurodegeneration process in hippocampus.Epilepsy Behav. 2016 Aug;61:258-268. doi: 10.1016/j.yebeh.2016.05.026. Epub 2016 Jul 16. Epilepsy Behav. 2016. PMID: 27429292
-
Neuroendocrine Function After Hypothalamic Depletion of Glucocorticoid Receptors in Male and Female Mice.Endocrinology. 2015 Aug;156(8):2843-53. doi: 10.1210/en.2015-1276. Epub 2015 Jun 5. Endocrinology. 2015. PMID: 26046806 Free PMC article.
Cited by
-
Emotional comorbidities in epilepsy result from seizure-induced corticosterone activity.Neurobiol Stress. 2024 Oct 11;33:100678. doi: 10.1016/j.ynstr.2024.100678. eCollection 2024 Nov. Neurobiol Stress. 2024. PMID: 39497812 Free PMC article.
-
The Promise and Practicality of Addressing Sex as a Biological Variable and the Ovarian Cycle in Preclinical Epilepsy Research.Epilepsy Curr. 2024 Jul 25;24(4):274-279. doi: 10.1177/15357597241261463. eCollection 2024 Jul-Aug. Epilepsy Curr. 2024. PMID: 39309055 Free PMC article.
-
Metal-Induced Genotoxic Events: Possible Distinction Between Sporadic and Familial ALS.Toxics. 2025 Jun 12;13(6):493. doi: 10.3390/toxics13060493. Toxics. 2025. PMID: 40559965 Free PMC article. Review.
-
Benzyl isothiocyanate ameliorates cognitive function in mice of chronic temporal lobe epilepsy.Front Neurol. 2024 Apr 23;15:1330102. doi: 10.3389/fneur.2024.1330102. eCollection 2024. Front Neurol. 2024. PMID: 38715687 Free PMC article.
References
-
- Ahima RS, Harlan RE, 1990. Charting of type II glucocorticoid receptor-like immunoreactivity in the rat central nervous system. Neuroscience 39, 579–604. - PubMed
-
- Ahima RS, Lawson AN, Osei SY, Harlan RE, 1992. Sexual dimorphism in regulation of type II corticosteroid receptor immunoreactivity in the rat hippocampus. Endocrinology 131, 1409–1416. - PubMed
-
- Azmitia EC, Mcewen BS, 1974. Adrenalcortical influence on rat brain tryptophan hydroxylase activity. Brain Res. 78, 291–302. - PubMed
Publication types
MeSH terms
Substances
Grants and funding
LinkOut - more resources
Full Text Sources
Molecular Biology Databases
