

Obesity partially potentiates dimethylbenz[a]anthracene-exposed ovotoxicity by altering the DNA damage repair response in mice†
- PMID: 36702632
- PMCID: PMC10106840
- DOI: 10.1093/biolre/ioac218
Obesity partially potentiates dimethylbenz[a]anthracene-exposed ovotoxicity by altering the DNA damage repair response in mice†
Abstract
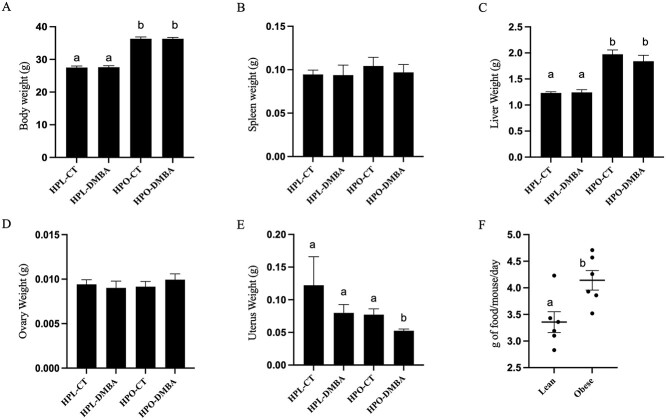
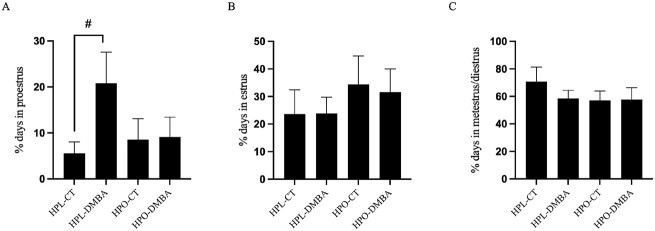
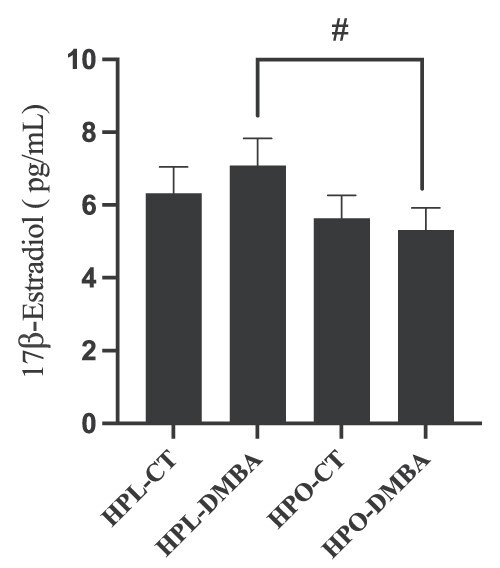
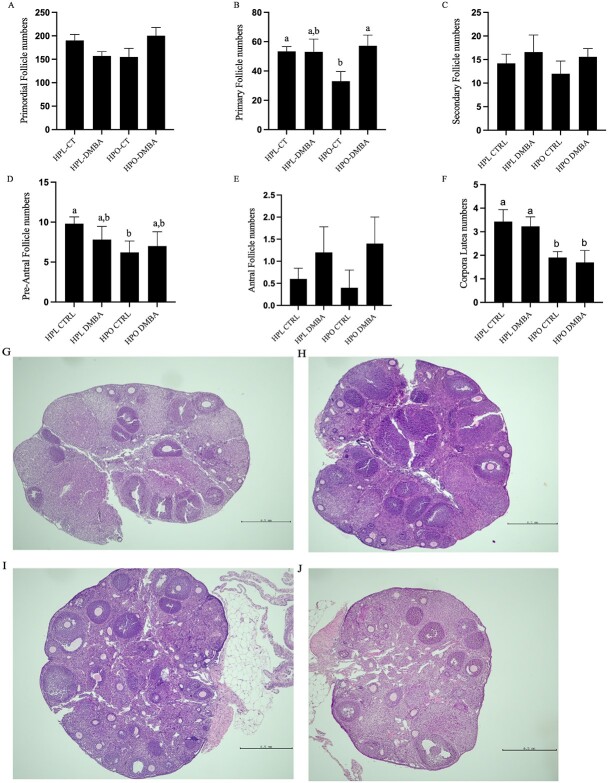
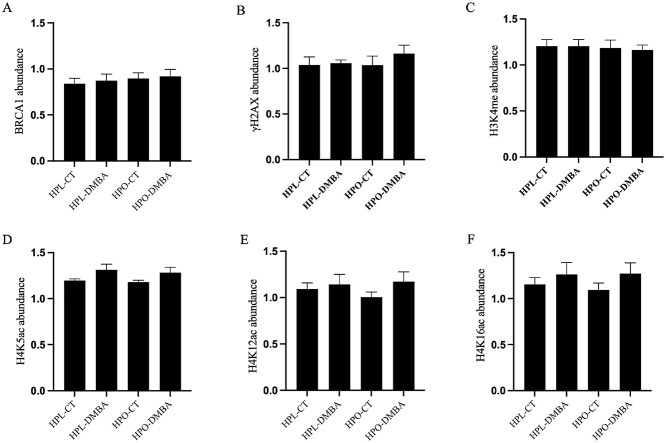
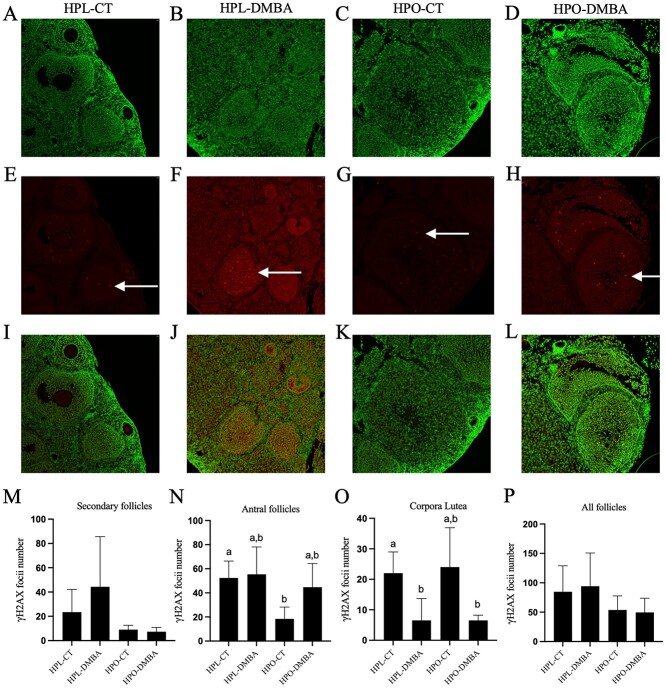
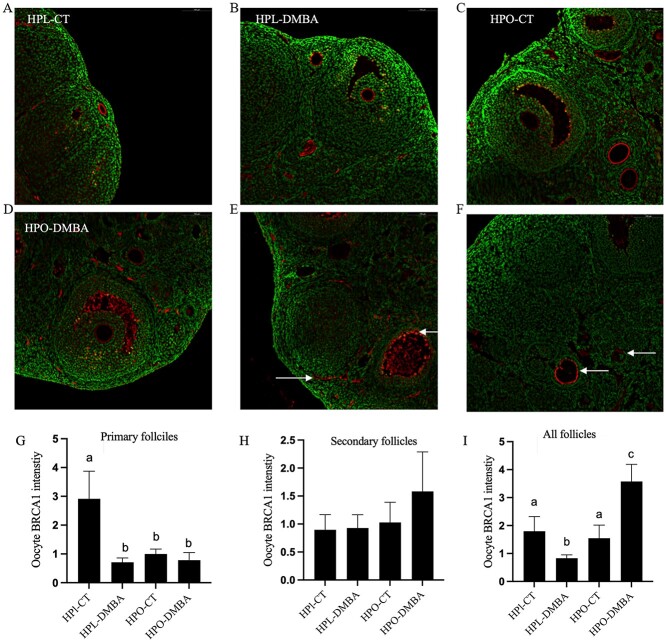
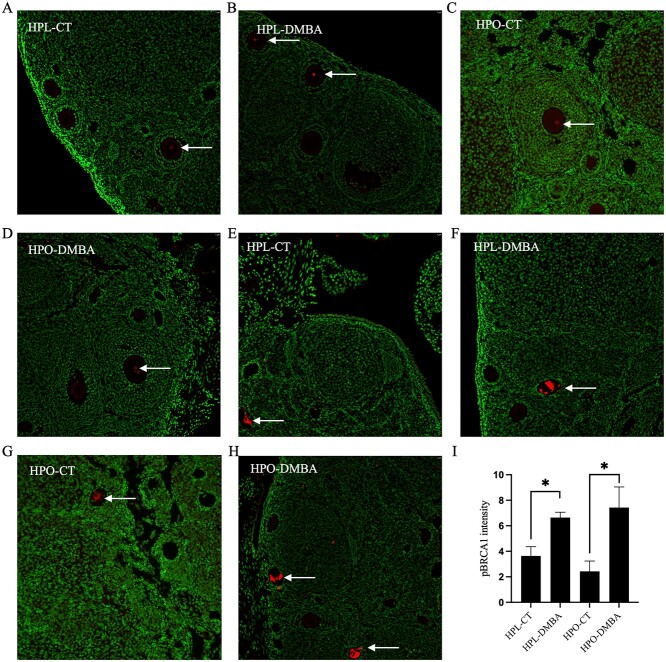
Obesity adversely affects reproduction, impairing oocyte quality, fecundity, conception, and implantation. The ovotoxicant, dimethylbenz[a]anthracene, is biotransformed into a genotoxic metabolite to which the ovary responds by activating the ataxia telangiectasia mutated DNA repair pathway. Basal ovarian DNA damage coupled with a blunted response to genotoxicant exposure occurs in obese females, leading to the hypothesis that obesity potentiates ovotoxicity through ineffective DNA damage repair. Female KK.Cg-a/a (lean) and KK.Cg-Ay/J (obese) mice received corn oil or dimethylbenz[a]anthracene (1 mg/kg) at 9 weeks of age for 7 days via intraperitoneal injection (n = 10/treatment). Obesity increased liver weight (P < 0.001) and reduced (P < 0.05) primary, preantral, and corpora lutea number. In lean mice, dimethylbenz[a]anthracene exposure tended (P < 0.1) to increase proestrus duration and reduced (P = 0.07) primordial follicle number. Dimethylbenz[a]anthracene exposure decreased (P < 0.05) uterine weight and increased (P < 0.05) primary follicle number in obese mice. Total ovarian abundance of BRCA1, γH2AX, H3K4me, H4K5ac, H4K12ac, and H4K16ac (P > 0.05) was unchanged by obesity or dimethylbenz[a]anthracene exposure. Immunofluorescence staining demonstrated decreased (P < 0.05) abundance of γH2AX foci in antral follicles of obese mice. In primary follicle oocytes, BRCA1 protein was reduced (P < 0.05) by dimethylbenz[a]anthracene exposure in lean mice. Obesity also decreased (P < 0.05) BRCA1 protein in primary follicle oocytes. These findings support both a follicle stage-specific ovarian response to dimethylbenz[a]anthracene exposure and an impact of obesity on this ovarian response.
Keywords: BRCA1; DMBA; DNA repair; obesity; ovary.
© The Author(s) 2023. Published by Oxford University Press behalf of Society for the Study of Reproduction.
Conflict of interest statement
The authors have declared that no conflict of interest exists.
Figures
Similar articles
-
Trajectory of primordial follicle depletion is accelerated in obese mice in response to 7,12-dimethylbenz[a]anthracene exposure†.Biol Reprod. 2024 Aug 15;111(2):483-495. doi: 10.1093/biolre/ioae059. Biol Reprod. 2024. PMID: 38625059 Free PMC article.
-
Enhanced susceptibility of ovaries from obese mice to 7,12-dimethylbenz[a]anthracene-induced DNA damage.Toxicol Appl Pharmacol. 2014 Dec 1;281(2):203-10. doi: 10.1016/j.taap.2014.10.004. Epub 2014 Oct 22. Toxicol Appl Pharmacol. 2014. PMID: 25448685 Free PMC article.
-
Pre-pubertal obesity compromises ovarian oxidative stress, DNA repair and chemical biotransformation.Toxicol Appl Pharmacol. 2024 Aug;489:116981. doi: 10.1016/j.taap.2024.116981. Epub 2024 Jun 3. Toxicol Appl Pharmacol. 2024. PMID: 38838792
-
BRCA-related ATM-mediated DNA double-strand break repair and ovarian aging.Hum Reprod Update. 2020 Jan 1;26(1):43-57. doi: 10.1093/humupd/dmz043. Hum Reprod Update. 2020. PMID: 31822904 Free PMC article. Review.
-
Impact of environmental exposures on ovarian function and role of xenobiotic metabolism during ovotoxicity.Toxicol Appl Pharmacol. 2012 Jun 15;261(3):227-35. doi: 10.1016/j.taap.2012.04.009. Epub 2012 Apr 13. Toxicol Appl Pharmacol. 2012. PMID: 22531813 Free PMC article. Review.
Cited by
-
Altered histone abundance as a mode of ovotoxicity during 7,12-dimethylbenz[a]anthracene exposure with additive influence of obesity†.Biol Reprod. 2024 Feb 10;110(2):419-429. doi: 10.1093/biolre/ioad140. Biol Reprod. 2024. PMID: 37856498 Free PMC article.
-
Trajectory of primordial follicle depletion is accelerated in obese mice in response to 7,12-dimethylbenz[a]anthracene exposure†.Biol Reprod. 2024 Aug 15;111(2):483-495. doi: 10.1093/biolre/ioae059. Biol Reprod. 2024. PMID: 38625059 Free PMC article.
-
Diet-induced obesity alters the ovarian chemical biotransformation and oxidative stress response proteins both basally and in response to 7,12-dimethylbenz[a]anthracene exposure.Toxicol Sci. 2025 Mar 1;204(1):9-19. doi: 10.1093/toxsci/kfae150. Toxicol Sci. 2025. PMID: 39910959 Free PMC article.
-
High fat diet-induced obesity and gestational DMBA exposure alter folliculogenesis and the proteome of the maternal ovary†.Biol Reprod. 2024 Aug 15;111(2):496-511. doi: 10.1093/biolre/ioae070. Biol Reprod. 2024. PMID: 38813940 Free PMC article.
References
-
- Hoyer PB, Keating AF. Xenobiotic effects in the ovary: temporary versus permanent infertility. Expert Opin Drug Metab Toxicol 2014; 10:511–523. - PubMed
-
- Hart RJ. Physiological aspects of female fertility: role of the environment, modern lifestyle, and genetics. Physiol Rev 2016; 96:873–909. - PubMed
-
- Joffe M. Infertility and environmental pollutants. Br Med Bull 2003; 68:47–70. - PubMed
-
- Ciecierska M, Obiedziński MW. Polycyclic aromatic hydrocarbons in the bakery chain. Food Chem 2013; 141:1–9. - PubMed
-
- Greendale GA, Lee NP, Arriola ER. The menopause. The Lancet 1999; 353:571–580. - PubMed
Publication types
MeSH terms
Substances
Grants and funding
LinkOut - more resources
Full Text Sources
Research Materials
Miscellaneous
