

Activation of PDGF Signaling in the Adult Muscle Stem Cell Niche in Patients With Type 2 Diabetes Mellitus
- PMID: 36702759
- PMCID: PMC10348470
- DOI: 10.1210/clinem/dgad041
Activation of PDGF Signaling in the Adult Muscle Stem Cell Niche in Patients With Type 2 Diabetes Mellitus
Abstract
Context: Type 2 diabetes mellitus (T2D) negatively affects muscle mass and function throughout life. Whether adult muscle stem cells contribute to the decrease in muscle health is not clear and insights into the stem cell niche are difficult to obtain.
Objective: To establish the upstream signaling pathway of microRNA (miR)-501, a marker of activated myogenic progenitor cells, and interrogate this pathway in muscle biopsies from patients with T2D.
Methods: Analysis of primary muscle cell cultures from mice and 4 normoglycemic humans and muscle biopsies from 7 patients with T2D and 7 normoglycemic controls using gene expression, information on histone methylation, peptide screening, and promoter assays.
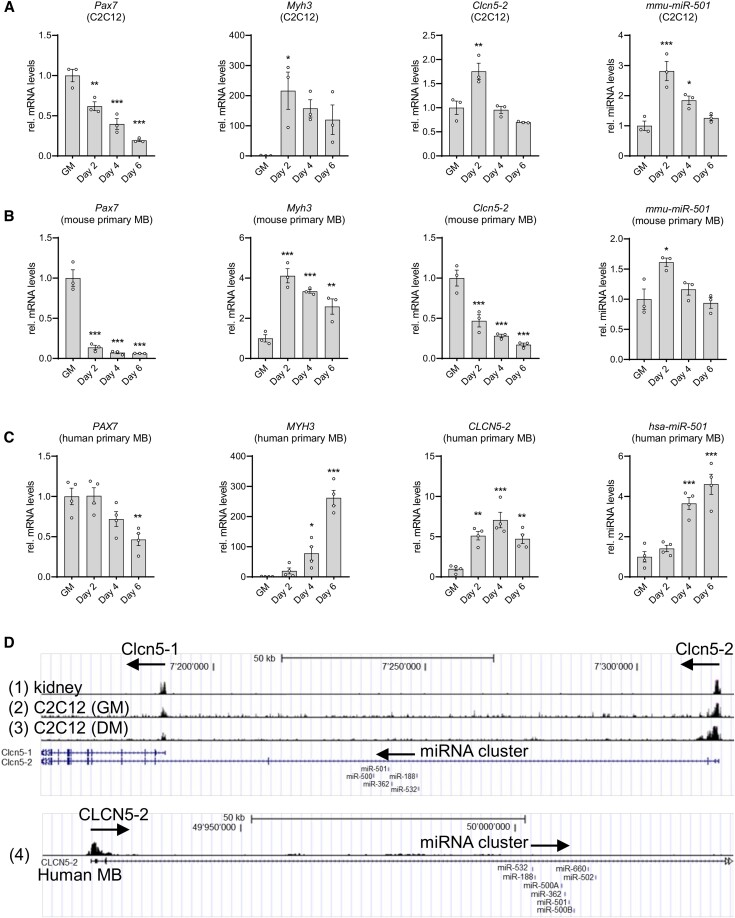
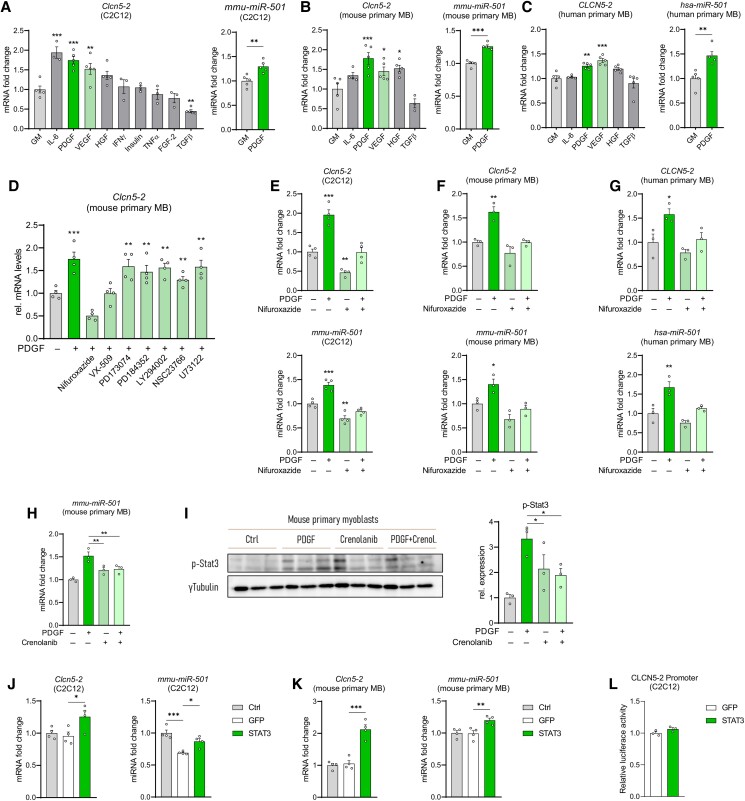
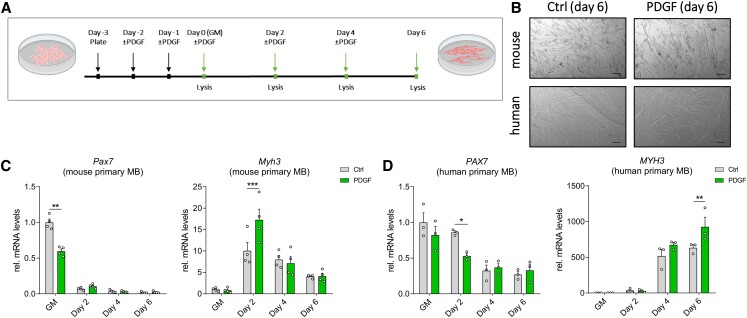
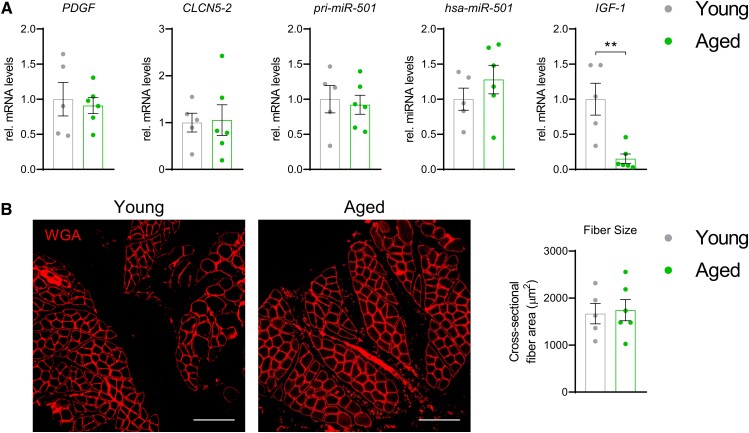
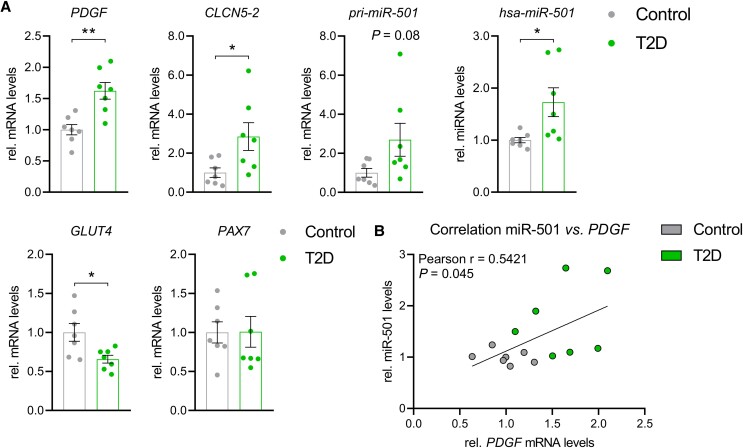
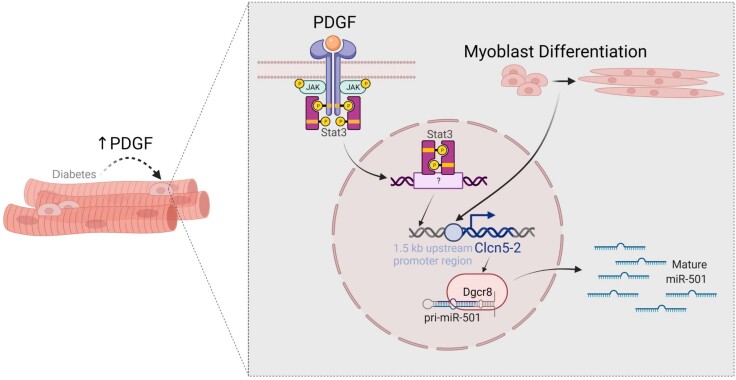
Results: miR-501 shares the promoter of its host gene, isoform 2 of chloride voltage-gated channel 5 (CLCN5-2), and miR-501 expression increases during muscle cell differentiation. We identify platelet-derived growth factor (PDGF) as an upstream regulator of CLCN5-2 and miR-501 via Janus kinase/signal transducer and activator of transcription. Skeletal muscle biopsies from patients with T2D revealed upregulation of PDGF (1.62-fold, P = .002), CLCN5-2 (2.85-fold, P = .03), and miR-501 (1.73-fold, P = .02) compared with normoglycemic controls. In addition, we observed a positive correlation of PDGF and miR-501 in human skeletal muscle (r = 0.542, P = .045, n = 14).
Conclusions: We conclude that paracrine signaling in the adult muscle stem cells niche is activated in T2D. Expression analysis of the PDGF-miR-501 signaling pathway could represent a powerful tool to classify patients in clinical trials that aim to improve muscle health and glucose homeostasis in patients with diabetes.
Keywords: PDGF; microRNA; skeletal muscle; type 2 diabetes mellitus.
© The Author(s) 2023. Published by Oxford University Press on behalf of the Endocrine Society.
Figures
Similar articles
-
A requirement for fibroblast growth factor in regulation of skeletal muscle growth and differentiation cannot be replaced by activation of platelet-derived growth factor signaling pathways.Mol Cell Biol. 1995 Jun;15(6):3238-46. doi: 10.1128/MCB.15.6.3238. Mol Cell Biol. 1995. PMID: 7760819 Free PMC article.
-
Platelet-derived growth factor-BB enhances MSC-mediated cardioprotection via suppression of miR-320 expression.Am J Physiol Heart Circ Physiol. 2015 May 1;308(9):H980-9. doi: 10.1152/ajpheart.00737.2014. Epub 2015 Feb 27. Am J Physiol Heart Circ Physiol. 2015. PMID: 25724494
-
Overexpression of microRNA-375 impedes platelet-derived growth factor-induced proliferation and migration of human fetal airway smooth muscle cells by targeting Janus kinase 2.Biomed Pharmacother. 2018 Feb;98:69-75. doi: 10.1016/j.biopha.2017.12.012. Epub 2017 Dec 12. Biomed Pharmacother. 2018. PMID: 29245068
-
TGF-β Induction of miR-143/145 Is Associated to Exercise Response by Influencing Differentiation and Insulin Signaling Molecules in Human Skeletal Muscle.Cells. 2021 Dec 7;10(12):3443. doi: 10.3390/cells10123443. Cells. 2021. PMID: 34943951 Free PMC article.
-
Regulation of the MIR155 host gene in physiological and pathological processes.Gene. 2013 Dec 10;532(1):1-12. doi: 10.1016/j.gene.2012.12.009. Epub 2012 Dec 14. Gene. 2013. PMID: 23246696 Review.
References
-
- Goodpaster BH, Thaete FL, Kelley DE. Thigh adipose tissue distribution is associated with insulin resistance in obesity and in type 2 diabetes mellitus. Am J Clin Nutr. 2000;71(4):885‐892. - PubMed
-
- Moore CW, Allen MD, Kimpinski K, Doherty TJ, Rice CL. Reduced skeletal muscle quantity and quality in patients with diabetic polyneuropathy assessed by magnetic resonance imaging. Muscle Nerve. 2016;53(5):726‐732. - PubMed
-
- Rasmussen DGK, Hansen TW, von Scholten BJ, et al. Higher collagen VI formation is associated with all-cause mortality in patients with type 2 diabetes and microalbuminuria. Diabetes Care. 2018;41(7):1493‐1500. - PubMed
Publication types
MeSH terms
Substances
Grants and funding
LinkOut - more resources
Full Text Sources
Medical
Research Materials
