. 2023 Jan 26;14(1):61.
doi: 10.1038/s41419-023-05592-8.

Inhibition of autophagy and MEK promotes ferroptosis in Lkb1-deficient Kras-driven lung tumors

Affiliations

Inhibition of autophagy and MEK promotes ferroptosis in Lkb1-deficient Kras-driven lung tumors

Vrushank Bhatt et al. Cell Death Dis. .

Abstract

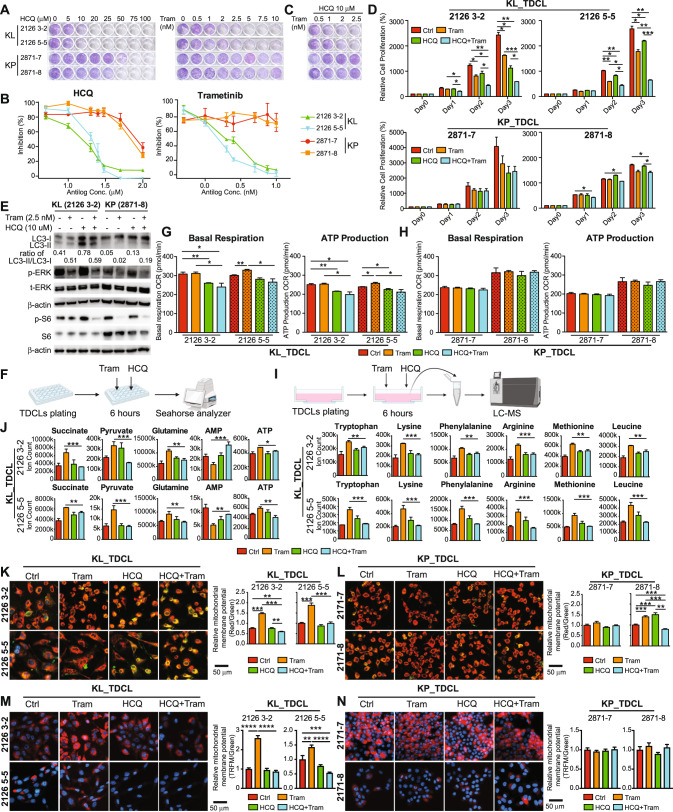
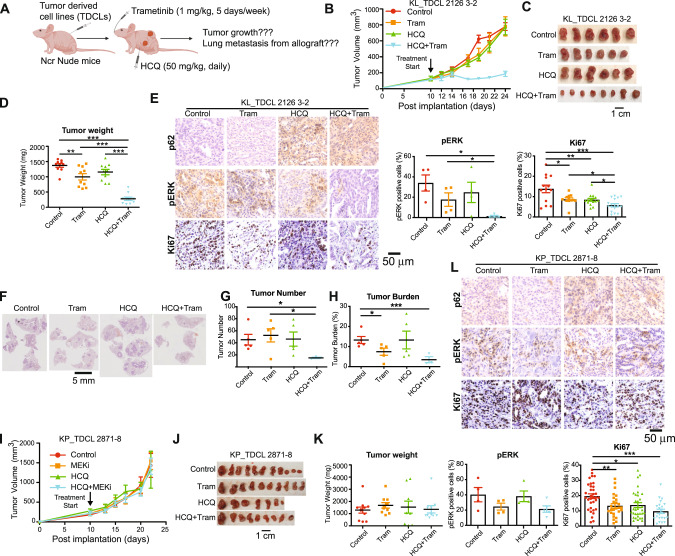
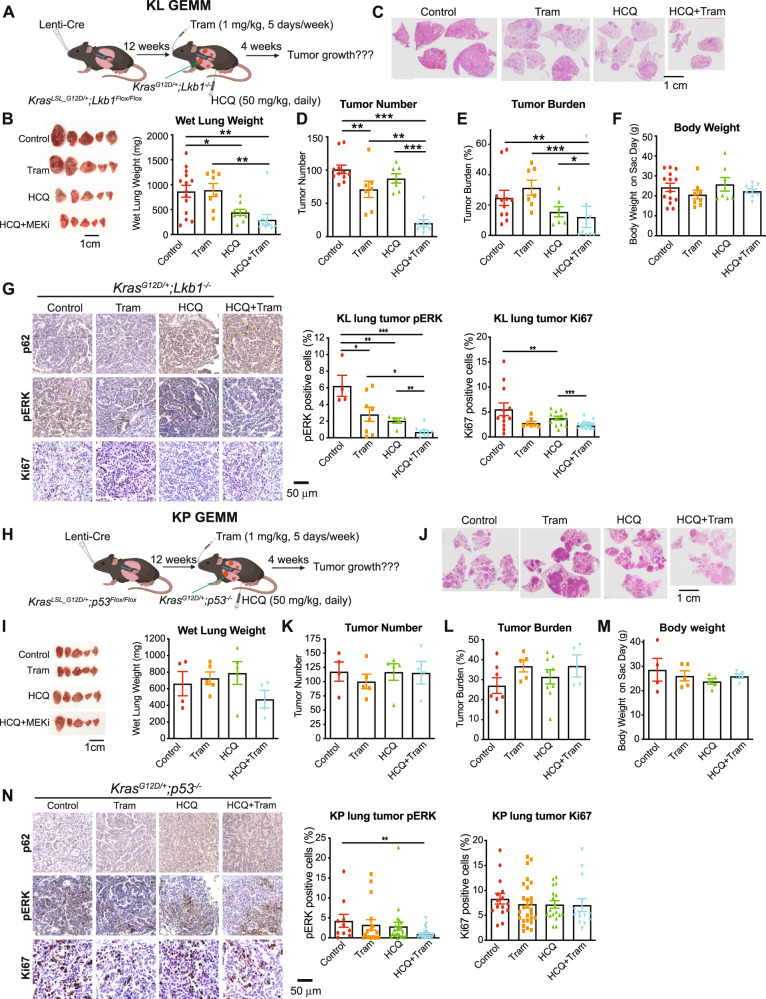
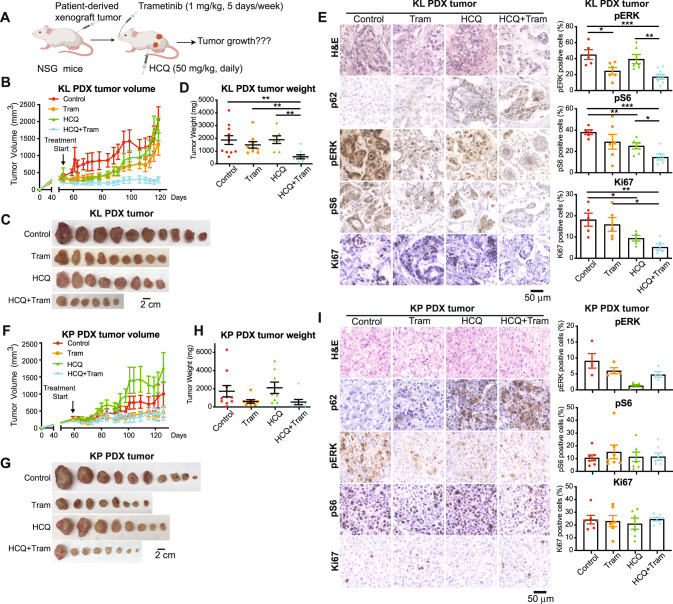
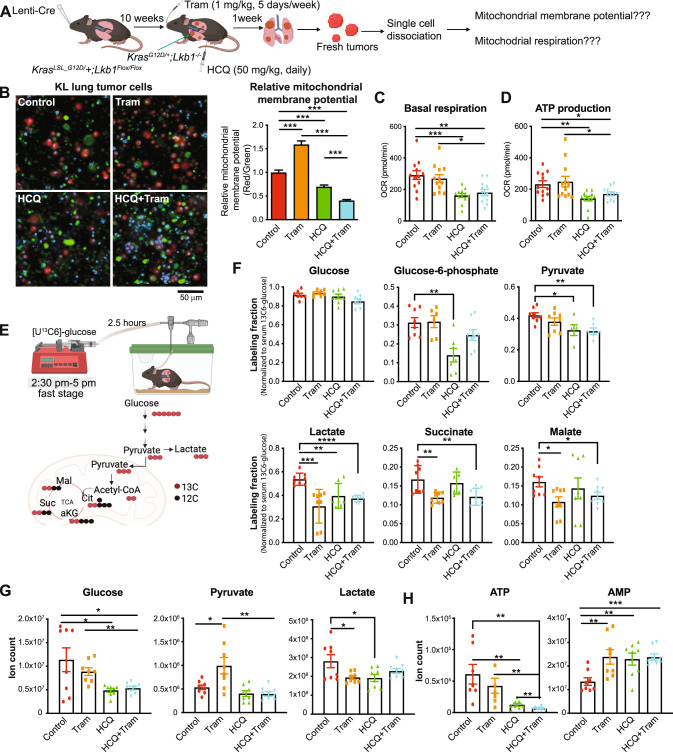
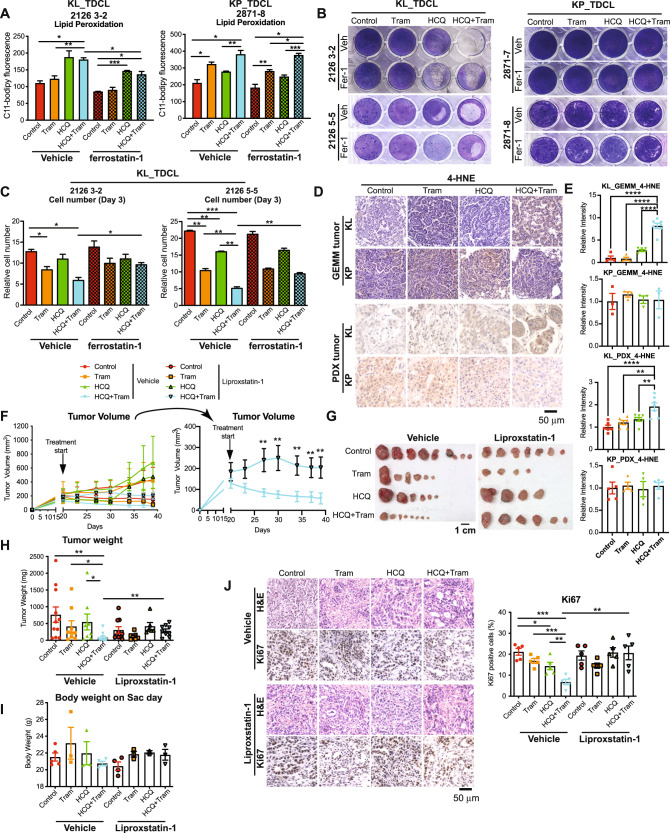
LKB1 and KRAS are the third most frequent co-mutations detected in non-small cell lung cancer (NSCLC) and cause aggressive tumor growth. Unfortunately, treatment with RAS-RAF-MEK-ERK pathway inhibitors has minimal therapeutic efficacy in LKB1-mutant KRAS-driven NSCLC. Autophagy, an intracellular nutrient scavenging pathway, compensates for Lkb1 loss to support Kras-driven lung tumor growth. Here we preclinically evaluate the possibility of autophagy inhibition together with MEK inhibition as a treatment for Kras-driven lung tumors. We found that the combination of the autophagy inhibitor hydroxychloroquine (HCQ) and the MEK inhibitor Trametinib displays synergistic anti-proliferative activity in KrasG12D/+;Lkb1-/- (KL) lung cancer cells, but not in KrasG12D/+;p53-/- (KP) lung cancer cells. In vivo studies using tumor allografts, genetically engineered mouse models (GEMMs) and patient-derived xenografts (PDXs) showed anti-tumor activity of the combination of HCQ and Trametinib on KL but not KP tumors. We further found that the combination treatment significantly reduced mitochondrial membrane potential, basal respiration, and ATP production, while also increasing lipid peroxidation, indicative of ferroptosis, in KL tumor-derived cell lines (TDCLs) and KL tumors compared to treatment with single agents. Moreover, the reduced tumor growth by the combination treatment was rescued by ferroptosis inhibitor. Taken together, we demonstrate that autophagy upregulation in KL tumors causes resistance to Trametinib by inhibiting ferroptosis. Therefore, a combination of autophagy and MEK inhibition could be a novel therapeutic strategy to specifically treat NSCLC bearing co-mutations of LKB1 and KRAS.


Conflict of interest statement

EW is a stockholder in Forma Therapeutics and a founder of Vescor Therapeutics. Other authors have no conflict of interest to declare.

Figures

Fig. 1
Fig. 1. Inhibition of autophagy by HCQ resulted in KL TDCL, but not KP TDCL, to be sensitive to MEK inhibitor Trametinib.
A Clonogenic survival assay of KL (clone 2126 3-2 and clone 2126 5-5) and KP (clone 2871-7 and clone 2871-8) TDCLs treated with HCQ or Trametinib individually at indicated concentrations. B Cell growth inhibition curve of KL (clone 2126 3-2 and clone 2126 5-5) and KP (clone 2871-7 and clone 2871-8) TDCLs treated with HCQ or Trametinib individually at indicated concentrations in Table 1. C Clonogenic survival assay of KL (clone 2126 3-2 and clone 2126 5-5) and KP (clone 2871-7 and clone 2871-8) TDCLs treated with the combination of HCQ and Trametinib at indicated concentrations. D Relative proliferation of KL (clone 2126 3-2 and clone 2126 5-5) and KP (clone 2871-7 and clone 2871-8) TDCLs treated with vehicle control, HCQ (10 μM), Trametinib (2.5 nM) and the combination. E Western blot for LC3, pERK, total ERK, pS6, total S6 and β-actin of KL and KP TDCLs treated with vehicle control, HCQ (10 μM), Trametinib (2.5 nM) and the combination for 6 h. F Scheme of the KL or KP TDCLs for measuring oxygen consumption rate (OCR) using Seahorse XFe24 analyzer. G Basal respiration and ATP production of KL TDCLs (clone 2126 3-2 and clone 2126 5-5 (with black squares)) after 6 h’ treatment with vehicle control, HCQ (10 μM), Trametinib (2.5 nM) and the combination. H Basal respiration and ATP production of KP TDCLs (clone 2871-1 and clone 2871-8 (with black squares)) after 6 h’ treatment with vehicle control, HCQ (10 μM), Trametinib (2.5 nM) and the combination. I Scheme of the metabolomics analysis via LC-MS of KL TDCLs after 6 h’ treatment. J The levels of metabolites of KL (clone 2126 3-2 and clone 2126 5-5) TDCLs after 6 h’ treatment with vehicle control, HCQ (10 μM), Trametinib (2.5 nM) and the combination. K Left: Overlapping images of KL (clone 2126 3-2 and clone 2126 5-5) TDCLs treated with vehicle control, HCQ (10 μM), Trametinib (2.5 nM) and the combination for 6 h and stained with MitoTracker Red CMXRos for mitochondrial membrane potential and MitoTracker Green FM for mitochondrial mass. Blue: Hoechst 33342 for nuclear staining. Right: graph of the relative mitochondrial membrane potential of KL TDCLs quantified by the ratio of red fluorescence intensity and green fluorescence intensity. L Left: Overlapping images of KP TDCLs (clone 2871-7 and clone 2871-8) treated with vehicle control, HCQ (10 μM), Trametinib (2.5 nM) and the combination for 6 h and stained with MitoTracker Red CMXRos for mitochondrial membrane potential and MitoTracker Green FM for mitochondria mass. Blue: Hoechst 33342 for nuclear staining. Right: graph of relative mitochondrial membrane potential of KP TDCLs quantified by the ratio of red fluorescence intensity and green fluorescence intensity. M Left: Overlapping images of KL (clone 2126 3-2 and clone 2126 5-5) TDCLs treated with vehicle control, HCQ (10 μM), Trametinib (2.5 nM) and the combination for 6 h and stained with TMRM (red fluorescence) for mitochondrial membrane potential. Blue: Hoechst 33342 for nuclear staining. Right: graph of the relative mitochondrial membrane potential of KL TDCLs quantified by the ratio of red fluorescence intensity and total cell numbers. N Left: Overlapping images of KP (clone 2871-1 and clone 2871-8) TDCLs treated with vehicle control, HCQ (10 μM), Trametinib (2.5 nM) and the combination for 6 h and stained with TMRM (red fluorescence) for mitochondrial membrane potential. Blue: Hoechst 33342 for nuclear staining. Right: graph of the relative mitochondrial membrane potential of KP TDCLs quantified by the ratio of red fluorescence intensity and total cell numbers. Data are mean ± s.e.m. *p < 0.05, **p < 0.01, ***p < 0.001, ****p < 0.0001.
Fig. 2
Fig. 2. Combination of HCQ and Trametinib inhibited the growth of established KL allograft tumors, and not KP allograft tumors.
A Scheme of an allograft mouse model in immunodeficient Ncr nude mice treated with vehicle control, HCQ (50 mg/kg, daily, I.P.), Trametinib (1 mg/kg, 5 days/week, oral gavage), or the combination. B Graph of KL allograft tumor growth in Ncr nude mice treated with vehicle control, HCQ, Trametinib, or the combination. C Gross pathology of KL allograft tumors in Ncr nude mice treated with vehicle control, HCQ, Trametinib or the combination. D Tumor weight of KL allograft tumors in Ncr nude mice treated with vehicle control, HCQ, Trametinib or the combination. E IHC for p62, pERK and Ki67 of KL allograft tumor from (C) (left panel) and quantification of pERK and Ki67 (right panel). F Representative H&E staining of lung tissues shows spontaneous lung metastasis from KL allograft tumors in Ncr nude mice. G&H. Quantification of tumor number (G) and tumor burden (H) from (F). I Graph of KP allograft tumor growth in Ncr nude mice treated with vehicle control, HCQ (50 mg/kg, daily, I.P.), Trametinib (1 mg/kg, 5 days/week, oral gavage), or the combination. J Gross pathology of KP allograft tumors in Ncr nude mice treated with vehicle control, HCQ, Trametinib or the combination. K Tumor weight of KP allograft tumors in Ncr nude mice treated with vehicle control HCQ, Trametinib or the combination. L IHC for p62, pERK and Ki67 of KP allograft tumor from (J) (top panel) and quantification of pERK and Ki67 (bottom panel). Data are mean ± s.e.m. *P < 0.05; **P < 0.01; ***P < 0.001.
Fig. 3
Fig. 3. HCQ increased the sensitivity of KL lung tumors, and not KP lung tumors, to MEK inhibitor Trametinib.
A Scheme of KrasLSL_G12D/+;Lkb1Flox/Flox GEMM bearing KL lung tumors treated with vehicle control, HCQ (50 mg/kg, daily, I.P.), Trametinib (1 mg/kg, 5 days/week, oral gavage), or the combination. B Representative gross lung pathology (left panel) and wet lung weight (right panel) of mice bearing KL lung tumors treated with vehicle control, HCQ, Trametinib or the combination for four weeks. C Representative H&E staining of lung tissues of the mice from (B). D, E Quantification of tumor number (D) and tumor burden (E) from (C). F The body weight of the mice bearing KL lung tumor on the day of sacrifice. G IHC for p62, pERK, and Ki67 of KL lung tumors from (B) (left panel) and quantification of pERK and Ki67 (right panel). H Scheme of KrasLSL_G12D/+;p53Flox/Flox GEMM bearing KP lung tumors treated with vehicle control, HCQ (50 mg/kg, daily, I.P.), Trametinib (1 mg/kg, 5 days/week, oral gavage), or the combination. I Representative gross lung pathology (left panel) and wet lung weight (right pane) of mice bearing KP lung tumors treated with vehicle control, HCQ, Trametinib or the combination for four weeks. J Representative H&E staining of lung tissues of the mice from (I). K, L Quantification of tumor number (K) and tumor burden (L) from (J). M The body weight of the mice bearing KP lung tumor on the day of sacrifice. N IHC for p62, pERK, and Ki67 of KP lung tumors from (I) (left panel) and quantification of pERK and Ki67 (right panel). Data are mean ± s.e.m. *P < 0.05; **P < 0.01; ***P < 0.001.
Fig. 4
Fig. 4. HCQ increased the sensitivity of KL PDX tumors, not KP PDX tumors, to MEK inhibitor Trametinib.
A Scheme of Patient-Derived Xenograft (PDX) tumor model treated with vehicle control, HCQ (50 mg/kg, daily, I.P.), Trametinib (Trametinib, 1 mg/kg, 5 days/week, oral gavage), or the combination. B Graph of KL PDX tumor growth in NSG mice treated with vehicle control, HCQ, Trametinib or the combination for 10 weeks. C Gross pathology of KL PDX tumors. D KL PDX tumor weight at the end of experiment. E H&E and IHC for p62, pERK, pS6, and Ki67 (left panel) and quantification of pERK, pS6, and Ki67 (right panel) of KL PDX tumors. F Graph of KP PDX tumor growth in NSG mice treated with vehicle control, HCQ, Trametinib, or the combination for 9.5 weeks. G Gross pathology of KP PDX tumors. H. KP PDX tumor weight at the end of experiment. I H&E and IHC for p62, pERK, pS6, and Ki67 (left panel) and quantification of pERK, pS6, and Ki67 (right panel) of KP PDX tumors. Data are mean ± s.e.m. *P < 0.05; **P < 0.01; ***P < 0.001.
Fig. 5
Fig. 5. Combination of HCQ and Trametinib impaired KL lung tumor energy production.
A Scheme to examine mitochondrial function in KL lung tumors. B Overlapping images of single-cell suspension from KL lung tumors of the mice treated with vehicle control, HCQ, Trametinib, or the combination for one week and stained with MitoTracker Red CMXRos for mitochondrial membrane potential and Mitotracker Green FM for mitochondrial mass (left panel); and graph of the relative mitochondrial membrane potential of single-cell suspension from KL lung tumors (the ratio of red fluorescence intensity and green fluorescence intensity) (right panel). Blue: Hoechst 33342 for nuclear staining. C Basal mitochondrial respiration of single-cell suspension from KL lung tumors of the mice treated with vehicle control, HCQ, Trametinib, or the combination for one week, measured by Seahorse XFe24 Analyzer. D ATP production of single-cell suspension from KL lung tumors of the mice treated with vehicle control, HCQ, Trametinib, or the combination for one week, measured by Seahorse XFe24 Analyzer. E Scheme of in vivo [U13C6]-glucose tracing in mice treated with vehicle control, HCQ, Trametinib, or the combination for two weeks (top panel) and 13C glucose carbons to glycolytic and TCA cycle intermediates (bottom panel). F Normalized labeling fraction of glucose and TCA cycle intermediates of KL lung tumors by infused [U13C6]-glucose in mice for 2.5 h. G Levels of glucose, pyruvate, and lactate of KL lung tumors from mice treated with vehicle control, HCQ, Trametinib, or the combination for two weeks. H Levels of ATP and AMP of KL lung tumors from mice treated with vehicle control, HCQ, Trametinib or the combination for two weeks. Data are mean ± s.e.m. *P < 0.05; **P < 0.01; ***P < 0.001; ****P < 0.001.
Fig. 6
Fig. 6. Combination of HCQ and Trametinib induced ferroptotic cell death to inhibit KL tumor growth.
A Lipid peroxidation of KL and KP TDCLs was examined by C11-BODIPY (1 μm) staining in cells treated with vehicle control, HCQ (10 μM), Trametinib (2.5 nM) and the combination in the absence or presence of ferroptosis inhibitor ferrostatin-1 (0.5 μM). B Clonogenic survival assay of KL and KP TDCLs treated with vehicle control, HCQ (10 μM), Trametinib (2.5 nM) and the combination in the absence or presence of ferroptosis inhibitor ferrostatin-1 (0.5 μM). C Relative cell proliferation of KL TDCLs treated with vehicle control, HCQ (10 μM), Trametinib (2.5 nM) and the combination in the absence or presence of ferroptosis inhibitor ferrostatin-1 (0.5 μM). D, E IHC (D) and quantification (E) of 4-HNE staining in KL and KP lung tumors from GEMMs as well as PDX tumors. F Graph of KL allograft tumor growth in C57BL/6 mice treated with vehicle control, HCQ (50 mg/kg, daily, I.P.), Trametinib (1 mg/kg, 5 days/week, oral gavage), and the combination in the absence or presence of ferroptosis inhibitor Liproxstatin-1 (10 mg/kg, daily, I.P.). G Gross KL allograft tumor from (F) at the end of experiment. H KL allograft tumor weight from (G) at the end of experiment. I Body weight of the mice on the day of sacrifice from (F). J Representative H&E and IHC for Ki67 of KL allograft tumors from (G) (left panel) and quantification of Ki67 (right panel). Data are mean ± s.e.m. *P < 0.05; **P < 0.01; ***P < 0.001.

Similar articles

Cited by

References

    1. Siegel RL, Miller KD, Fuchs HE, Jemal A. Cancer statistics, 2022. CA Cancer J Clin. 2022;72:7–33. doi: 10.3322/caac.21708. - DOI - PubMed
    1. Duma N, Santana-Davila R, Molina JR. Non-small cell lung cancer: epidemiology, screening, diagnosis, and treatment. Mayo Clin Proc. 2019;94:1623–40. doi: 10.1016/j.mayocp.2019.01.013. - DOI - PubMed
    1. Ferrer I, Zugazagoitia J, Herbertz S, John W, Paz-Ares L, Schmid-Bindert G. KRAS-Mutant non-small cell lung cancer: from biology to therapy. Lung Cancer. 2018;124:53–64. doi: 10.1016/j.lungcan.2018.07.013. - DOI - PubMed
    1. Arbour KC, Riely GJ. Systemic therapy for locally advanced and metastatic non-small cell lung cancer: a review. JAMA. 2019;322:764–74. doi: 10.1001/jama.2019.11058. - DOI - PubMed
    1. Bhatt V, Khayati K, Hu ZS, Lee A, Kamran W, Su X, et al. Autophagy modulates lipid metabolism to maintain metabolic flexibility for Lkb1-deficient Kras-driven lung tumorigenesis. Genes Dev. 2019;33:150–65. doi: 10.1101/gad.320481.118. - DOI - PMC - PubMed

Publication types

MeSH terms

Substances