. 2023 Jan 26;14(1):428.
doi: 10.1038/s41467-023-36145-4.

Evolution of giant pandoravirus revealed by CRISPR/Cas9

Affiliations

Evolution of giant pandoravirus revealed by CRISPR/Cas9

Hugo Bisio et al. Nat Commun. .

Abstract

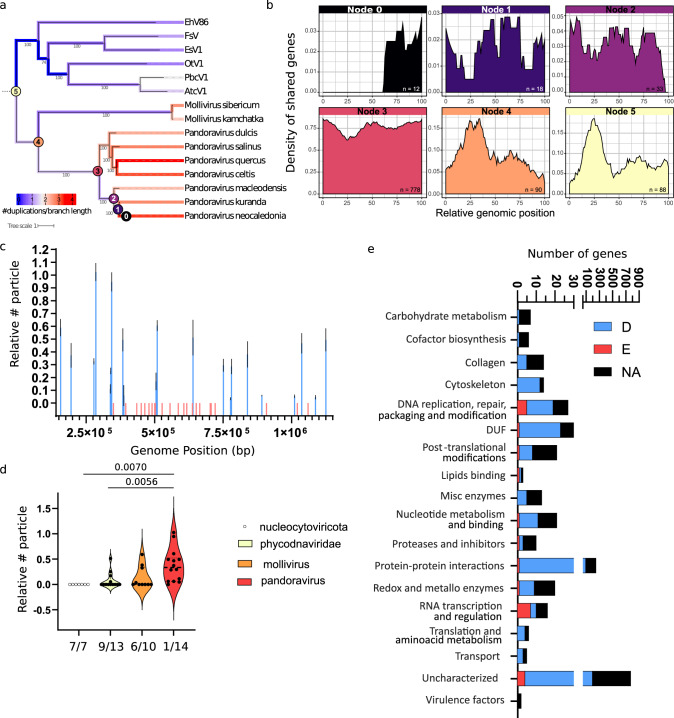
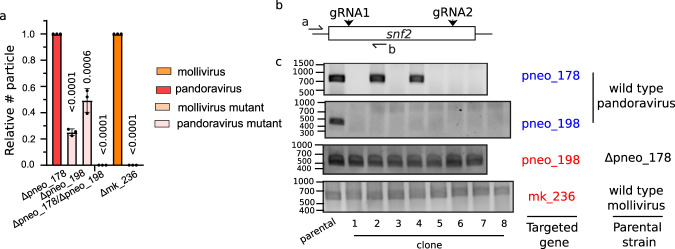
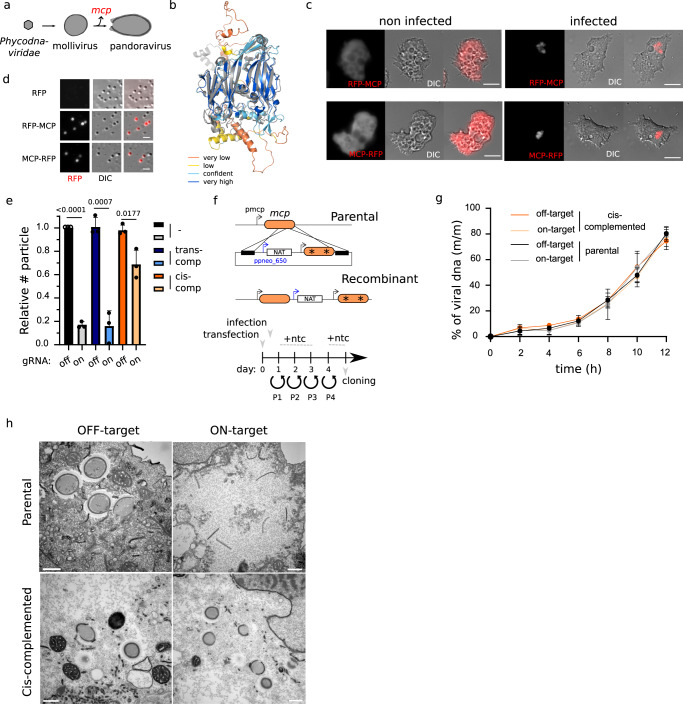
Giant viruses (GVs) are a hotspot of unresolved controversies since their discovery, including the definition of "Virus" and their origin. While increasing knowledge of genome diversity has accumulated, GV functional genomics was largely neglected. Here, we describe an experimental framework to genetically modify nuclear GVs and their host Acanthamoeba castellanii using CRISPR/Cas9, shedding light on the evolution from small icosahedral viruses to amphora-shaped GVs. Ablation of the icosahedral major capsid protein in the phylogenetically-related mollivirus highlights a transition in virion shape and size. We additionally demonstrate the existence of a reduced core essential genome in pandoravirus, reminiscent of their proposed smaller ancestors. This proposed genetic expansion led to increased genome robustness, indicating selective pressures for adaptation to uncertain environments. Overall, we introduce new tools for manipulation of the unexplored genome of nuclear GVs and provide experimental evidence suggesting that viral gigantism has aroused as an emerging trait.


Conflict of interest statement

The authors declare no competing interests.

Figures

Fig. 1
Fig. 1. CRISPR/Cas9 allows manipulation of A. castellanii.
a Constructs used to constitutively express Cas9 in A. castellanii. The sequence of the gRNA is depicted with diamonds followed by the Cas9-binding scaffold and an A. castellanii tRNA (yellow rectangles). The localization of the GFP-Cas9 fusion for the different constructs is shown by fluorescence. Micrographs are representative of 3 independent experiments. Scale bar: 10μm. b Representative micrographs showing amoebas expressing mRFP (vector Vc241) and GFP-Cas9 after selection for 2–3 weeks with the appropriate drug(s) (refer to materials and methods). mRFP (product of the targeted gene) and GFP (Indicating Cas9 expression) fluorescence are shown. MCR: mutagenic chain reaction. Scale bar: 10μm. c The quantification of the micrograph shown in (b). The mean ± SD of at least 200 amoebas (3 independent experiments (n = 3)) is shown. Amoebas were classified either as non-fluorescent, mRFP+, GFP+ or GFP+mRFP+. MCR: mutagenic chain reaction. Guides targeting pandoravirus rpb1 were used as off-target gRNAs. Nd: not detected. d Representative sequencing results of targeted guide sequences on rfp upon transfection with on-target gRNAs. PCR were performed on the target sequences as shown in Fig. S1a, b, cloned into a TA cloning vector and single clones were sent for sequencing. The wild type sequence and mutations generated are shown in red and blue respectively. Ten individual clones were amplified and sequenced. e Schematic representation of the rfp locus, guide targeting location, homology arms for recombination and primer annealing sites for a disruption using a “mutagenic chain reaction” strategy (see Fig. S1e). f Gene disruption of rfp by the “mutagenic chain reaction” observed at the population level after 2–3 weeks post-transfection. Expected PCR size: a + b: 837 bp (unmodified locus), a + b 890 bp (recombinant locus), a + c: 500 bp (unmodified locus). Note that the primer b anneals both in the wild type and recombinant locus resulting in PCR products with slight differences in size.
Fig. 2
Fig. 2. CRISPR/Cas9 allows manipulation of A. castellanii.
a Disruption of genes encoding cellulose synthase 1–3 (cs1-3) is observed at the population level after 2–3 weeks post-transfection. Reverse primers are designed to anneal at the gRNA targeting sequencing. Disappearance of the PCR product correlates with modification of the locus in all the alleles. Expected PCR size: cs1: 430 bp (guide 1), 200 bp (guide 2). cs2: 250 bp (guide 1) 265 bp (guide 2). cs3: 320 bp. Guides targeting mRFP were used as off-target gRNAs. b Representative sequencing results of cs1 upon transfection with on-target gRNAs. PCR were performed on the target sequences, cloned into a TA cloning vector and single clones were sent for sequencing. The wild-type sequence and mutations generated are shown in red and blue, respectively. Ten individual clones were amplified and sequenced. c Depletion of the cellulose synthase impedes cellulose deposition at the periphery of A. castellanii cyst. WCF: Calcofluor white, which stains cellulose. Scale bar: 20μm. d The quantification of the micrograph shown in (c). The mean ± SD of at least 200 amoebas (3 independent transfections (n = 3)) is shown. Amoebas were classified either as empty, normal or abnormal internal WCF staining. The null hypothesis (α  =  0.05) was tested using unpaired two-tailed Student’s t tests. Source data are provided as a Source Data file.
Fig. 3
Fig. 3. CRISPR/Cas9 allows manipulation of nuclear GVs.
a Schematic depiction of genetic manipulation of GVs. A. castellanii expressing a nuclear or cytoplasmic Cas9 are shown in the left and right, respectively. VF: viral factory. N: Nucleus. b Quantification of the number (#) of viruses produced 24 h post-infection (hpi) of CRISPR/Cas9 expressing amoebas. Values are expressed relative to # of viral particles produced within amoebas expressing off-target gRNAs. A cytoplasmic version of Cas9 was used to attempt gene disruption of cytoplasmic GV (Mimivirus reunion and Pithovirus sibericum) and a nuclear version of Cas9 was used for the gene disruption of nuclear GVs (Pandoravirus neocaledonia and Mollivirus kamchatka). Data correspond to the mean ± SD of 3 independent experiments. MOI = 1. Guides targeting mimivirus rpb1 were used as off-target gRNAs for pithovirus infection and vice versa. Guides targeting pandoravirus rpb1 were used as off-target gRNAs for the infection of mollivirus and vice versa. The null hypothesis (α  =  0.05) was tested using unpaired two-tailed Student’s t tests. c Multiple gRNA combinations were used to target the rpb1 gene of Pandoravirus neocaledonia. Data were performed as Fig. 2b. Guides targeting mollivirus mcp were used as off-target gRNAs. Sequence of the gRNA 1 to 6 are shown in Table S1. The null hypothesis (α  =  0.05) was tested using unpaired two-tailed Student’s t tests. d Schematic representation of the vector and strategy utilized for rbp2 endogenous tagging in Pandoravirus neocaledonia. Selection cassette was introduced by homologous recombination. e Cartoon depicting the strategy for selection of recombinant viruses. Viral infection was performed 1 h post-transfection. Ntc: Nourseothricin. P = passage. f Nuclear localization of endogenously tagged RPB2-FLAG shown by immunofluorescence assay using anti-FLAG antibodies. DAPI: nuclear marker. The immunofluorescence signal disappears upon infection of cells encoding CRISPR/Cas9 targeting the rpb2 locus. Guides targeting mollivirus mcp were used as off-target gRNAs. Scale bar: 10μm. g The quantification of the micrograph shown in (f). The mean ± SD of at least 200 amoebas (3 independent experiments (n = 3)) is shown. The null hypothesis (α  =  0.05) was tested using unpaired two-tailed Student’s t tests. Source data are provided as a Source Data file.
Fig. 4
Fig. 4. CRISPR/Cas9 targeting of pandoravirus genome demonstrates the presence of a core essential genome.
a Relative quantification of the number (#) of viruses produced 24 hpi of CRISPR/Cas9 expressing amoebas. Data correspond to the mean ± SD of 3 independent experiments. MOI = 1. The essential region of the genome is highlighted in red. Guides targeting mollivirus mcp were used as off-target gRNAs. The null hypothesis (α  =  0.05) was tested using unpaired two-tailed Student’s t tests. b qPCR analysis indicates the presence of virus with large deletions at the 3’ of the genome. A ratio of the copy number of genes pneo_74 (5′) and pneo_974 (3′) is shown (location marked in red). The location of the bars indicates the position of the targeted gene. Data correspond to the mean ± SD of 3 independent experiments. The null hypothesis (α  =  0.05) was tested using unpaired two-tailed Student’s t tests. c Clonality of viral strains with large deletions at the 3′ of the genome was analyzed by PCR. Expected size: 5′: 150 bp (pneo_74), 3′: 220 bp (pneo_974). PCRs are representative of 2 independent experiments. d Pulsed field gel electrophoresis of the genomic DNA of Pandoravirus neocaledonia. Genome obtained from parental virions (2.05 Mbp) or virions containing a large deletion at the 3′ end of the genome (Δ612-974) are shown. Image is representative of 2 independent experiments. e Quantification of the number (#) of viruses produced 24 hpi. Data correspond to the mean ± SD of 3 independent experiments. Parental strain and Δ612-974 are represented in gray and while, respectively. The null hypothesis (α  =  0.05) was tested using unpaired two-tailed Student’s t tests. f TEM image of an ultrathin section of P. neocaledonia viral particle. Wt and Δ612-974 are shown. Micrographs are representative of 3 independent experiments. g Abundance of proteins detected in the P. neocaledonia virion proteome according to the genomic location of cognate genes. ORF: open reading frame. h DNA replication was analyzed by qPCR. Viral DNA is represented as a percentage of total DNA in the sample. Data correspond to the mean ± SD of 3 independent experiments. The null hypothesis (α  =  0.05) was tested using unpaired two-tailed Student’s t tests.
Fig. 5
Fig. 5. CRISPR/Cas9 targeting of pandoravirus genome demonstrates the presence of a core essential genome.
a Quantification of the number (#) of viruses produced 24 hpi of CRISPR/Cas9 expressing amoebas relative to viruses produced in off-target gRNA expressing amoebas. Genes were ranked by their position in the genome. Guides off-target and on-target of different genes were used. Data correspond to the mean ± SD of 3 independent experiments. Genes confirmed to be essential, dispensable or not analyzed are represented in red, blue and gray, respectively. The approximate limits of the essential core of the genome are marked with arrows and the targeted gene indicated. MOI = 1. Guides targeting mollivirus mcp were used as off-target gRNAs. b Gene disruption of gene of interest (goi) is demonstrated by PCR. Expected PCR size: pneo_177: wt, 1250 bp – mutant, 1200 bp; pneo_254: wt, 320 bp – mutant, 220 bp. Cartoon depicting the strategy for genotyping is shown in Fig. S4A. PCRs are representative of 2 independent experiments. c Sequencing results of targeted region on clonal populations of Δpneo_177 and Δpneo_254. The deleted sequences are shown in red. gRNA sequences are highlighted in bold and PAM sequences marked with a line. PAM for pneo_177 is shown for the reverse complement strain. d Quantification of the number (#) of virions of P. neocaledonia and P. macleodensis produced 24 hpi of CRISPR/Cas9 expressing amoebas relative to viruses produced in off-target gRNA expressing amoebas. Genes were ranked by their position in the genome of p. neocaledonia. Essential genes in P. neocaledonia are highlighted in red. Orthologous genes between P. neocaledonia and P. macleodensis are shown in pairs. A schematic representation of the genome organization of P. neocaledonia and P. macleodensis including gRNA targeting locus locations is also shown. The limits of the inverted region of the genome is shown in gray. The essential core of the genome is represented with a red box. MOI = 1. Guides targeting mollivirus mcp were used as off-target gRNAs. Data correspond to the mean ± SD of 3 independent experiments. Source data are provided as a Source Data file.
Fig. 6
Fig. 6. Pandoravirus genome organization keeps traces of their smaller ancestors.
a Phylogenetic tree of Phycodnaviridae, Molliviridae and Pandoraviridae computed from a concatenated multiple alignment of 435 orthologous proteins present in at least two viruses. Bootstrap values were computed using the ultrafast boostrap method. Number of gene duplication events along the branches from the phylogenetic tree are also shown. The numbers were normalized by branch length, log10 transformed and color-coded from blue (low number of duplications) to red (high). b Density of P. neocaledonia genes along the genome according to its predicted ancestry. The P. neocaledonia genes were classified based on the presence of homologs in other viruses and color-coded from the corresponding ancestral node shown in panel a. c Quantification of the number (#) of viruses produced upon knock-out of genes located at the essential core of the genome relative to viruses produced in off-target gRNA expressing amoebas and ranked by their position in the genome. Data correspond to the mean ± SD of 3 independent experiments. Genes that were knocked out are highlighted in blue, while genes that could not be knocked out are shown in red. All experiments were performed with clonal populations of recombinant viruses. MOI = 1. d Correlation between the number of particles produced 24 hpi upon single gene knock out and proposed depth of conservation. The phylogenetic relationship of P. neocaledonia with other Nucleocytoviricota is illustrated in Fig. 4a. The distribution of phenotype scores in each category is plotted and the number of genes analyzed for each category is showed on the bottom of each violin plot. Bars indicate the group median. The number of essential genes over the total of genes analyzed in each group is also indicated. MOI = 1. The null hypothesis (α  =  0.05) was tested using unpaired two-tailed Student’s t tests. e Correlation between dispensability/essentiality (D = dispensable, E = essential, NA = not analyzed) and functional annotation of Pandoravirus neocaledonia genes.
Fig. 7
Fig. 7. Pandoravirus genome displays gene redundancy.
a Quantification of the number of viruses produced upon knock-out of snf2 like genes in pandoravirus or mollivirus relative to viruses produced in off-target gRNA expressing amoebas. Data correspond to the mean ± SD of 3 independent experiments. MOI = 1. The null hypothesis (α  =  0.05) was tested using unpaired two-tailed Student’s t tests. b Cartoon depicting the strategy for genotyping shown in (Fig. 4h). c Gene presence or disruption of goi is demonstrated by PCR in different clones obtained upon gene targeting by Cas9. PCR positive clones represent viruses which escape Cas9 targeting. Expected PCR product size: pneo_178: 790 bp; pneo_198: 466 bp; mk_236: 562 bp. Source data are provided as a Source Data file.
Fig. 8
Fig. 8. Mollivirus MCP acts as a scaffolding protein for tegument biosynthesis.
a Schematic depiction of the proposed model of evolution for pandoravirus. Major capsid protein loss is indicated by a red color. b Alignment of the AlphaFold prediction of the mollivirus major capsid protein (mcp, ms_334) and the crystal structure of the PBCV-1 mcp (5TIQ). PBCV-1 mcp is shown in gray while mollivirus mcp is colored by its confidence score (pLDDT): Very low (0<pLDDT<50), low (50<pLDDT<70), confident (70<pLDDT<90) and high (90<pLDDT<100). c Light fluorescence microscopy images of A. castellanii cells expressing N- or C-terminally RFP tagged MCP. Representative images of non-infected cells and cells infected with mollivirus are shown. Images were obtained 6 hpi. Scale bar: 10μm. d Light fluorescence microscopy images of mollivirus produced in A. castellanii cells expressing RFP or N- or C-terminally RFP tagged MCP. Scale bar: 1 μm. e Quantification of the number of viruses produced upon knock-out of mcp gene in mollivirus relative to viruses produced in off-target gRNA expressing amoebas. Data correspond to the mean ± SD of 3 independent experiments. * indicates the presence of silent mutations on the sequence. MOI = 1. Guides targeting pandoravirus rpb1 were used as off-target gRNAs. The null hypothesis (α  =  0.05) was tested using unpaired two-tailed Student’s t tests. f Schematic representation of the vector and strategy utilized for mcp KO cis-complementation. Selection cassette was introduced by homologous recombination and recombinant viruses were generated, selected and cloned as indicated by the timeline. Viral infection was performed 1 hpi. Ntc: Nourseothricin. * represents the presence of silent mutations at the gRNA targeting site. g DNA replication was analyzed by qPCR. Viral DNA is represented as a percentage of total DNA in the sample. Data correspond to the mean ± SD of 3 independent experiments. MOI = 1. h Electron microscopy imaging of the mollivirus replication cycle in A. castellanii. Images were acquired 8 hpi and mollivirus particles (MOI = 50) were used to infect cells expressing Cas9 and gRNA on- or off-target of the mcp. Parental or cis-complemented viral strains were used for infection in parallel experiments. Scale bar: 500 nm. Source data are provided as a Source Data file.

Similar articles

Cited by

References

    1. Philippe N, et al. Pandoraviruses: amoeba viruses with genomes up to 2.5 Mb reaching that of parasitic eukaryotes. Science. 2013;341:281–286. doi: 10.1126/science.1239181. - DOI - PubMed
    1. Queiroz VF, et al. Amoebae: hiding in plain sight: unappreciated hosts for the very large virsuses. Annu. Rev. Virol. 2022;9:79–98. doi: 10.1146/annurev-virology-100520-125832. - DOI - PubMed
    1. Legendre M, et al. Diversity and evolution of the emerging Pandoraviridae family. Nat. Commun. 2018;9:2285. doi: 10.1038/s41467-018-04698-4. - DOI - PMC - PubMed
    1. Tautz D, Domazet-Loso T. The evolutionary origin of orphan genes. Nat. Rev. Genet. 2011;12:692–702. doi: 10.1038/nrg3053. - DOI - PubMed
    1. Abergel C, Claverie JM. Giant viruses. Curr. Biol. 2020;30:R1108–R1110. doi: 10.1016/j.cub.2020.08.055. - DOI - PubMed

Publication types