

Biomolecular condensates formed by designer minimalistic peptides
- PMID: 36702825
- PMCID: PMC9879991
- DOI: 10.1038/s41467-023-36060-8
Biomolecular condensates formed by designer minimalistic peptides
Abstract
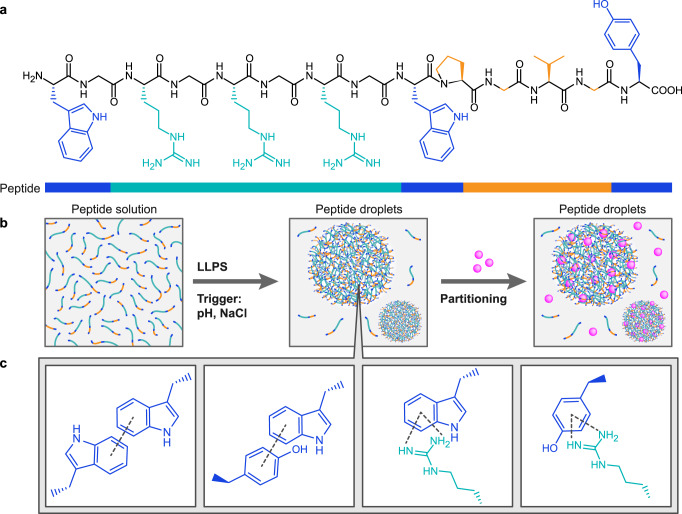
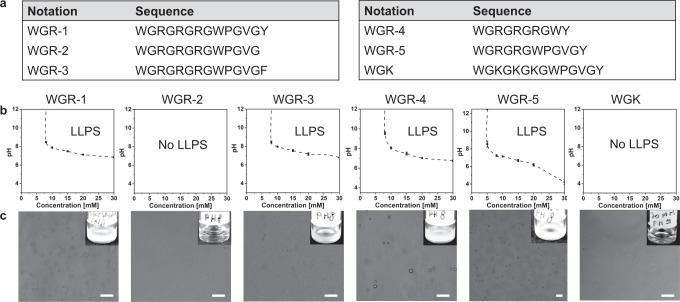
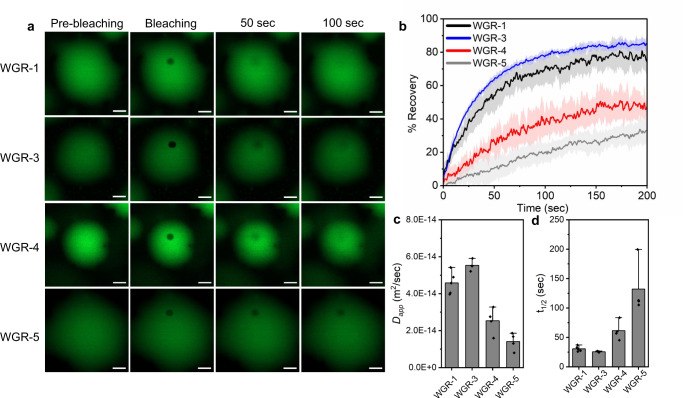
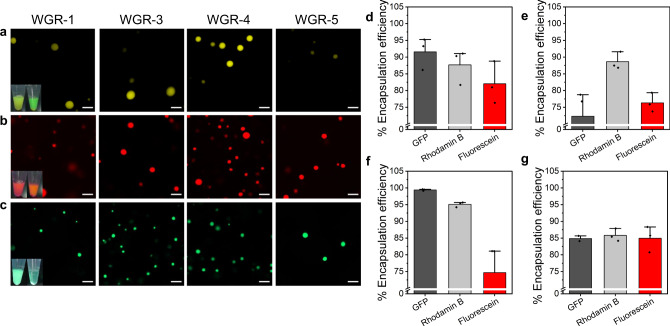
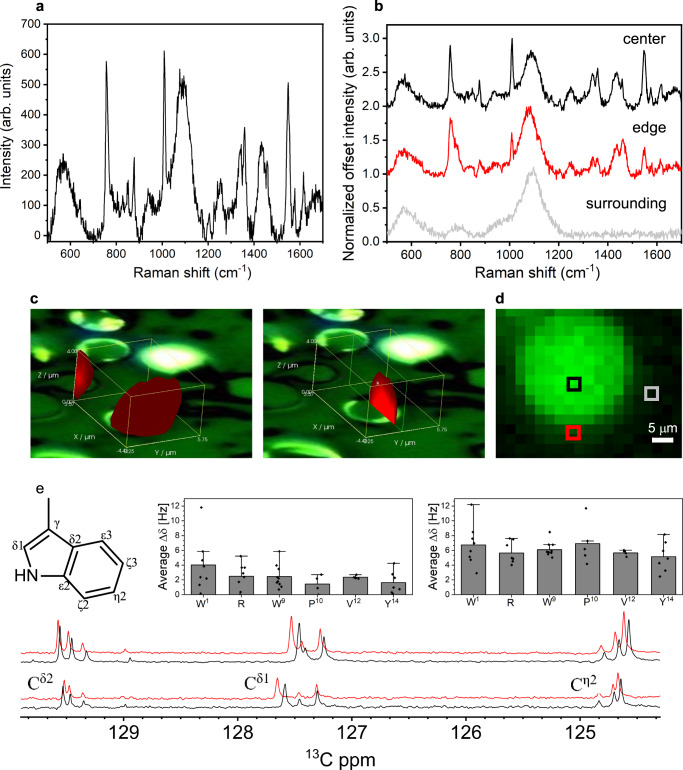
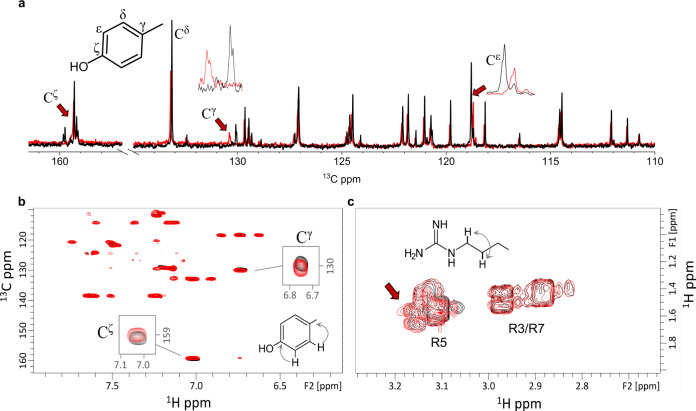
Inspired by the role of intracellular liquid-liquid phase separation (LLPS) in formation of membraneless organelles, there is great interest in developing dynamic compartments formed by LLPS of intrinsically disordered proteins (IDPs) or short peptides. However, the molecular mechanisms underlying the formation of biomolecular condensates have not been fully elucidated, rendering on-demand design of synthetic condensates with tailored physico-chemical functionalities a significant challenge. To address this need, here we design a library of LLPS-promoting peptide building blocks composed of various assembly domains. We show that the LLPS propensity, dynamics, and encapsulation efficiency of compartments can be tuned by changes to the peptide composition. Specifically, with the aid of Raman and NMR spectroscopy, we show that interactions between arginine and aromatic amino acids underlie droplet formation, and that both intra- and intermolecular interactions dictate droplet dynamics. The resulting sequence-structure-function correlation could support the future development of compartments for a variety of applications.
© 2023. The Author(s).
Conflict of interest statement
The authors declare no competing interests.
Figures
Similar articles
-
Regulation of Peptide Liquid-Liquid Phase Separation by Aromatic Amino Acid Composition.Small. 2024 Sep;20(38):e2401665. doi: 10.1002/smll.202401665. Epub 2024 May 28. Small. 2024. PMID: 38804888
-
Genetically-Encoded Phase Separation Sensors Enable High-Fidelity Live-Cell Probing of Biomolecular Condensates.ACS Sens. 2025 Mar 28;10(3):1857-1869. doi: 10.1021/acssensors.4c02851. Epub 2025 Feb 23. ACS Sens. 2025. PMID: 39987501 Free PMC article.
-
TAR DNA-binding protein 43 (TDP-43) liquid-liquid phase separation is mediated by just a few aromatic residues.J Biol Chem. 2018 Apr 20;293(16):6090-6098. doi: 10.1074/jbc.AC117.001037. Epub 2018 Mar 6. J Biol Chem. 2018. PMID: 29511089 Free PMC article.
-
Biological soft matter: intrinsically disordered proteins in liquid-liquid phase separation and biomolecular condensates.Essays Biochem. 2022 Dec 16;66(7):831-847. doi: 10.1042/EBC20220052. Essays Biochem. 2022. PMID: 36350034 Review.
-
Liquid-liquid phase separation of intrinsically disordered proteins: Effect of osmolytes and crowders.Prog Mol Biol Transl Sci. 2025;211:249-269. doi: 10.1016/bs.pmbts.2024.11.005. Epub 2025 Jan 21. Prog Mol Biol Transl Sci. 2025. PMID: 39947751 Review.
Cited by
-
Biomineralization-Inspired Membranization Toward Structural Enhancement of Coacervate Community.Adv Sci (Weinh). 2025 May;12(18):e2417832. doi: 10.1002/advs.202417832. Epub 2025 Mar 16. Adv Sci (Weinh). 2025. PMID: 40089856 Free PMC article.
-
Elastin-like polypeptide coacervates as reversibly triggerable compartments for synthetic cells.Commun Chem. 2024 Sep 4;7(1):198. doi: 10.1038/s42004-024-01270-8. Commun Chem. 2024. PMID: 39232074 Free PMC article.
-
Amino Acid-Dependent Material Properties of Tetrapeptide Condensates.bioRxiv [Preprint]. 2024 May 15:2024.05.14.594233. doi: 10.1101/2024.05.14.594233. bioRxiv. 2024. Update in: Cell Rep Phys Sci. 2024 Oct 16;5(10):102218. doi: 10.1016/j.xcrp.2024.102218. PMID: 38798623 Free PMC article. Updated. Preprint.
-
A tunable affinity fusion tag for protein self-assembly.bioRxiv [Preprint]. 2025 Jan 15:2025.01.14.633037. doi: 10.1101/2025.01.14.633037. bioRxiv. 2025. PMID: 39868245 Free PMC article. Preprint.
-
Amino acid transfer free energies reveal thermodynamic driving forces in biomolecular condensate formation.Proc Natl Acad Sci U S A. 2025 Jul 29;122(30):e2425422122. doi: 10.1073/pnas.2425422122. Epub 2025 Jul 21. Proc Natl Acad Sci U S A. 2025. PMID: 40690668
References
-
- Blocher, W. C. & Perry, S. L. Complex coacervate-based materials for biomedicine. Wiley Interdisciplinary Rev.-Nanomed. Nanobiotechnol.9, e1442 (2017). - PubMed
Publication types
MeSH terms
Substances
LinkOut - more resources
Full Text Sources
