. 2023 Jan 26;8(1):3.
doi: 10.1038/s41525-022-00340-x.

Cross center single-cell RNA sequencing study of the immune microenvironment in rapid progressing multiple myeloma

Affiliations

Cross center single-cell RNA sequencing study of the immune microenvironment in rapid progressing multiple myeloma

William Pilcher et al. NPJ Genom Med. .

Abstract

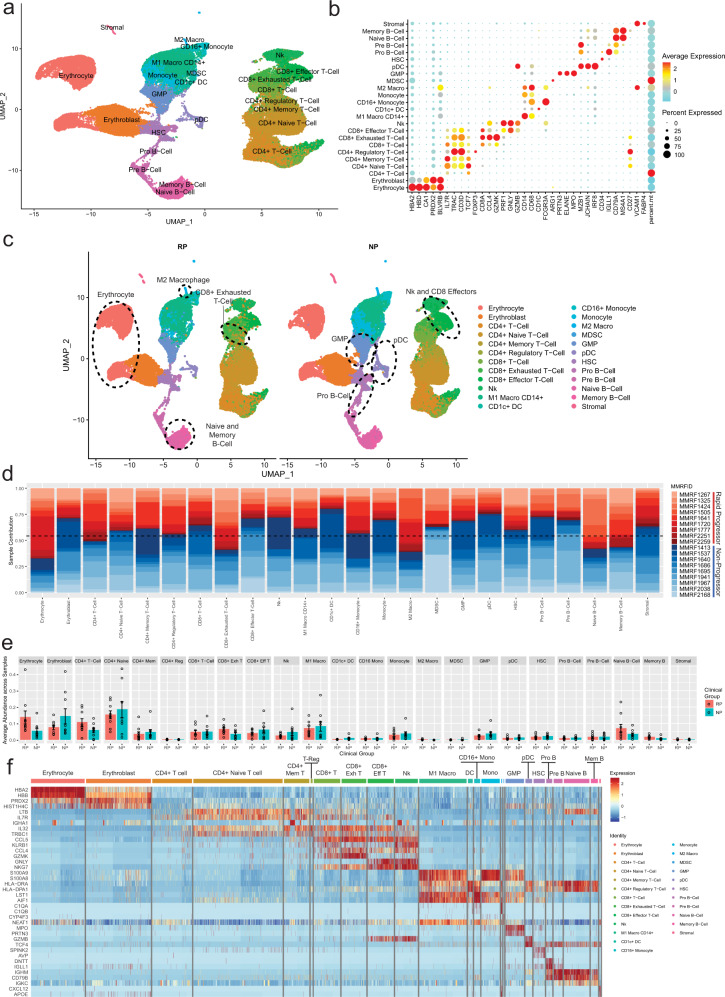
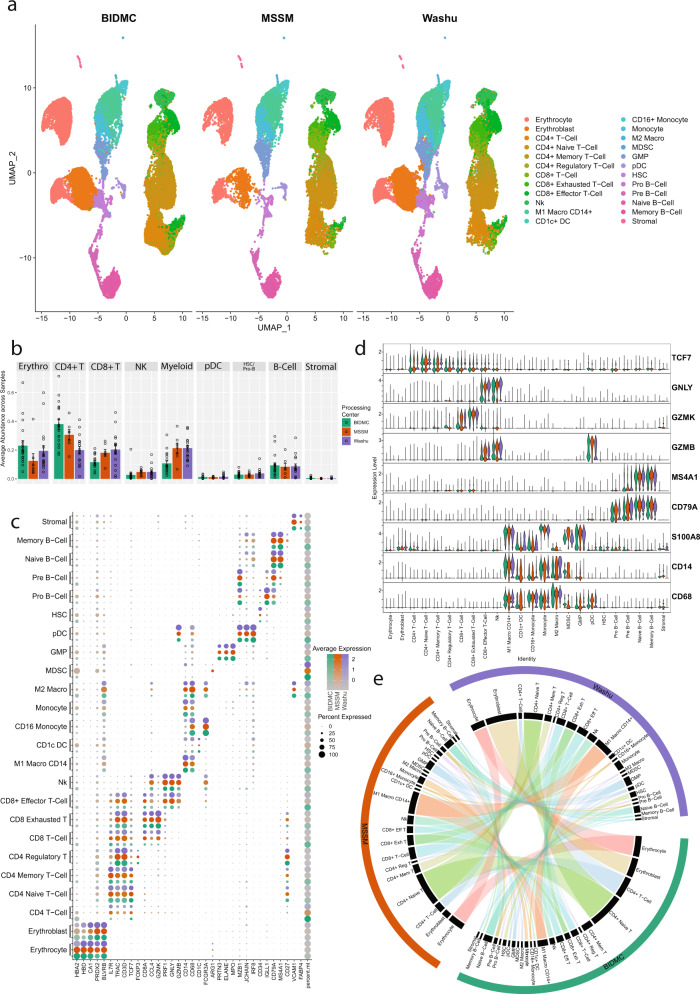
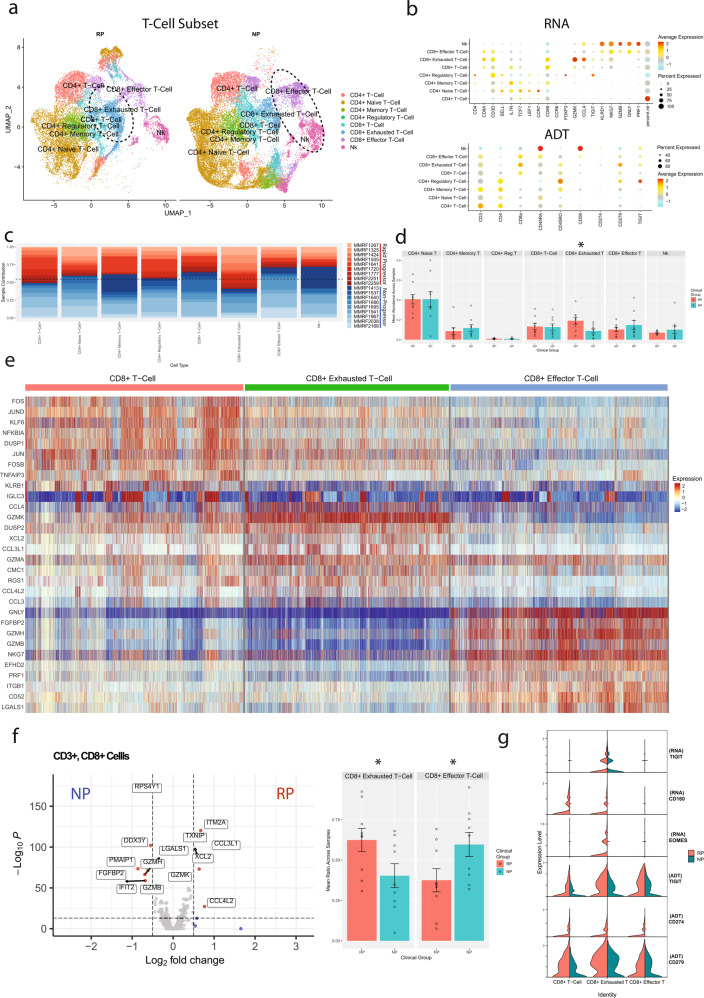
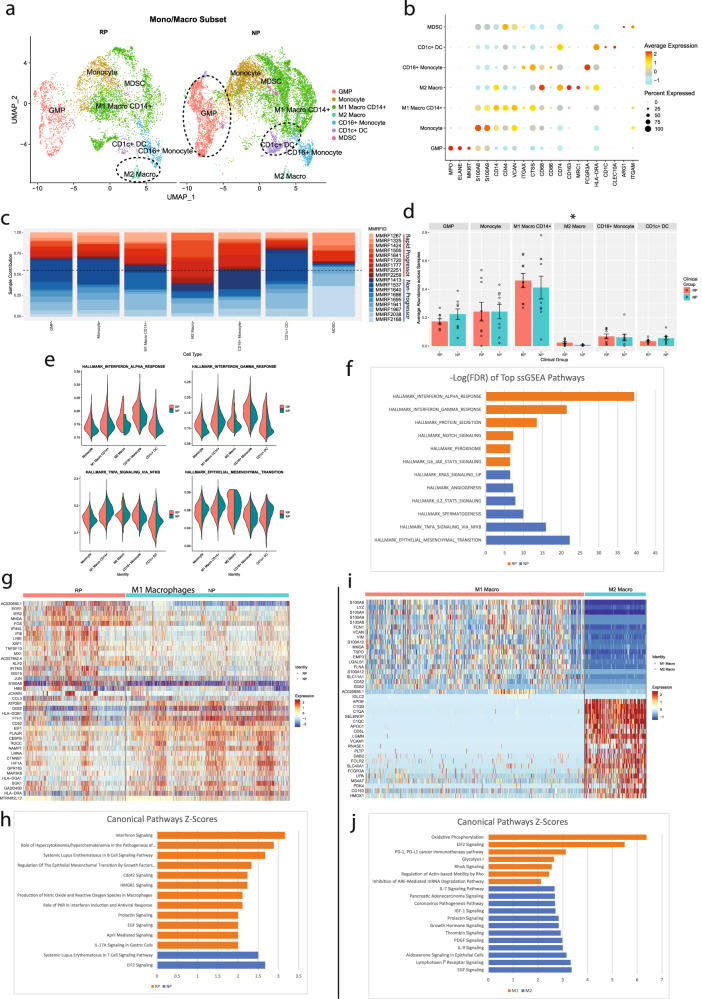
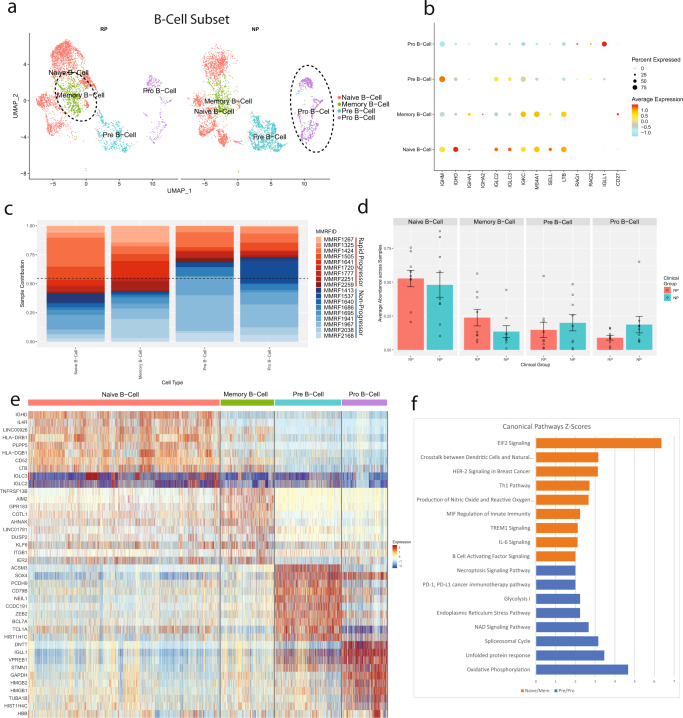
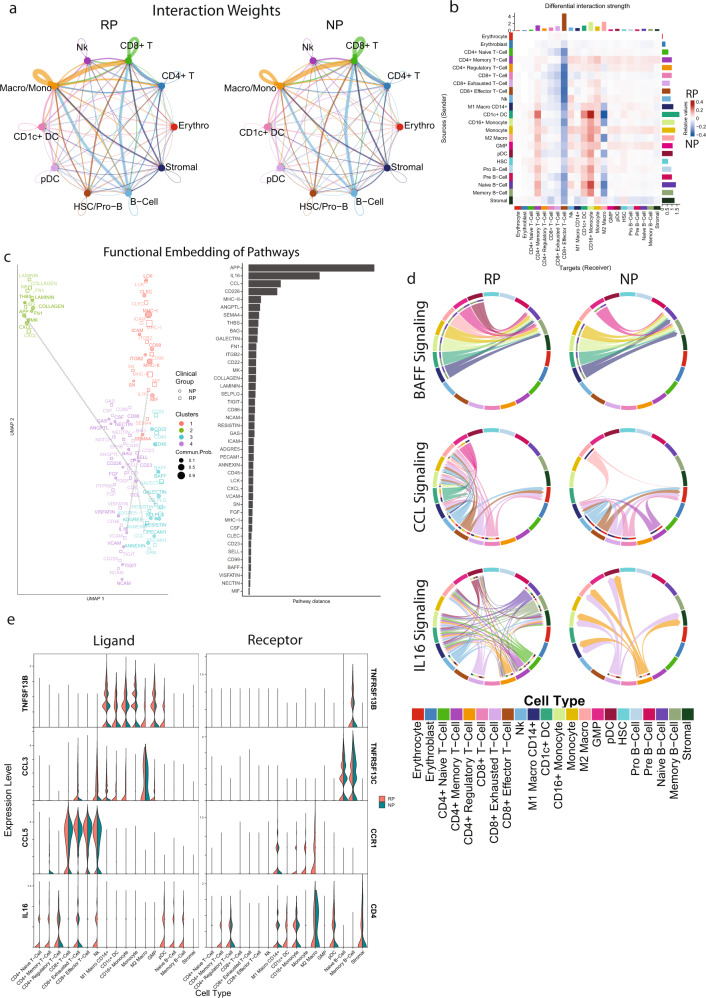
Despite advancements in understanding the pathophysiology of Multiple Myeloma (MM), the cause of rapid progressing disease in a subset of patients is still unclear. MM's progression is facilitated by complex interactions with the surrounding bone marrow (BM) cells, forming a microenvironment that supports tumor growth and drug resistance. Understanding the immune microenvironment is key to identifying factors that promote rapid progression of MM. To accomplish this, we performed a multi-center single-cell RNA sequencing (scRNA-seq) study on 102,207 cells from 48 CD138- BM samples collected at the time of disease diagnosis from 18 patients with either rapid progressing (progression-free survival (PFS) < 18 months) or non-progressing (PFS > 4 years) disease. Comparative analysis of data from three centers demonstrated similar transcriptome profiles and cell type distributions, indicating subtle technical variation in scRNA-seq, opening avenues for an expanded multicenter trial. Rapid progressors depicted significantly higher enrichment of GZMK+ and TIGIT+ exhausted CD8+ T-cells (P = 0.022) along with decreased expression of cytolytic markers (PRF1, GZMB, GNLY). We also observed a significantly higher enrichment of M2 tolerogenic macrophages in rapid progressors and activation of pro-proliferative signaling pathways, such as BAFF, CCL, and IL16. On the other hand, non-progressive patients depicted higher enrichment for immature B Cells (i.e., Pre/Pro B cells), with elevated expression for markers of B cell development (IGLL1, SOX4, DNTT). This multi-center study identifies the enrichment of various pro-tumorigenic cell populations and pathways in those with rapid progressing disease and further validates the robustness of scRNA-seq data generated at different study centers.


Conflict of interest statement

This study was supported by the Multiple Myeloma Research Foundation (MMRF). M.H., S.M., H.J.C., and D.A. are employed by the MMRF, but they did not have a role in the interpretation of the results. S.G. is additionally supported by grants U24 CA224319 and U01 DK124165. The Mount Sinai Human Immune Monitoring Center is supported in part by Cancer Center grant P01 CA196521. S.G. reports consultancy and/or advisory roles for Merck, and OncoMed and research funding from Bristol-Myers Squibb, Genentech, Janssen R&D, Pfizer, Celgene, Takeda, and Regeneron. Other authors declare no competing interests.

Figures

Fig. 1
Fig. 1. Single-cell profiling of bone marrow from MM patients with rapid (RP) and no progression (NP).
Clinical samples with rapid and no progression were identified from the Multiple Myeloma Research Foundation (MMRF) CoMMpass study, a longitudinal genomic study of patients with newly diagnosed, active multiple myeloma (NCT01454297). In the study, 48 bone marrow aliquots from 18 patients diagnosed with Multiple Myeloma (MM) were processed for scRNA-seq at three medical centers, Beth Israel Deaconess Medical Center (BIDMC), Mount Sinai School of Medicine (MSSM), and Washington University (WashU). Patients are classified as either rapid progressors (RP) or non-progressors (NP) based on the rate of disease progression, <18 months or >4 years post-diagnosis, respectively. a Uniform manifold approximation and projection (UMAP) embedding of scRNA samples across all patients consisting of 90,502 high quality single-cells portioned into 24 cell types. Plasma cells were removed prior to embedding. These clusters are colored based on canonical cell types based on the expression of marker genes that include erythrocytes (HBA+, HBD+), erythroblasts (BLVRB+, PRDX2+), T-cells (IL7R+, CD3D+), CD8+ T-cells (CD8A+, CCL4+, GZMK+), CD8+ effector T-cells (GNLY+, GZMB+, CD3D+), NK Cells (GNLY+, GZMB+, CD3D-), monocytes/macrophages (CD14+, CD68+), CD1c+ DC (CD1c+), Granulocyte-Macrophage Progenitors-GMP (ELANE+, MPO+), plasmacytoid dendritic cells-pDC (IRF8+, MZB1+), HSC (CD34+), Pro B-Cells (IGLL1+), and B-cells (MS4A1+, CD79A+). b Dot Plot depicting expression profile of markers genes used for annotating different cell type clusters. The over and under expression of specific markers is shown by red and cyan colors, respectively. c Clinical phenotype based split UMAP showing the distribution of cell types in the RP and NP groups. There is slightly elevated NK, CD8+ effector, Pro B-Cell, GMP, and pDC counts in the NP group, while RP samples show elevation of exhausted T-cells, naive and memory B-cells, and erythrocytes. d A stacked bar plot showing the relative patient contribution to each individual cell type cluster. The patients from RP and NP groups are shown with shades of red and blue, respectively. Each cluster depicted the varying levels of contribution from multiple samples of NP and RP groups. e Comparative analysis of cell types enriched in the RP and NP groups. Each bar plot depicts the mean and ±standard error of the mean in NP and RP groups. Each dot represents an individual patient sample. f A heatmap displaying the top markers expressed by each cell type. Columns represent individual cells, grouped by cell type, while rows display individual genes. Horizontal colored bars above the heatmap indicate the cell type, with the legend on the right listing the cell type for each colored bar. Cell type labels are also displayed above their corresponding bar for all cell types except for the three smallest populations (M2 macrophages, MDSCs, and stromal cells). Relative gene expression is shown in pseudo color, where blue represents downregulation, and red represents upregulation. Top markers generally correlate with well-established canonical markers for each cell type.
Fig. 2
Fig. 2. Comparison of scRNA profiles of samples processed at three different centers.
Bone marrow aspirates from the same set of patients were processed at three different centers, BIDMC, MSSM, and WashU, and analyzed using a uniform bioinformatics workflow for comparative analysis. The comparative analysis was performed on 20 samples processed at BIDMC, 7 processed at MSSM, and 21 processed at WashU. a Split UMAP based on sample processing centers of scRNA samples. All major cell types are captured in the single-cell profile from each center. Clusters are colored based on cell types identified in Fig. 1a. b Comparative analysis of cell type proportion across centers. Each bar represents the mean ratio for a given cell type for all samples processed at a specific center. Error bars show the standard error of the mean. Individual dots represent individual patient cell type ratios. Samples from MSSM and WashU had similar ratios across the cell types. BIDMC shows a higher proportion of CD4+ T-cells and a lower ratio of Myeloid cells. c Comparative analysis of canonical cell type-specific markers across three centers. Most of the cell type defining markers are concordantly expressed across cell types indicating strong similarity in the single-cell profiles generated across centers. BIDMC, which performed CITE-Seq, tends to have higher percent.mt relative to other centers this might be due to longer processing time for CITE-Seq due to antibody labeling. d Violin Plots comparing the expression of various cell markers among different centers. Overall, the level of expression of these markers are consistent among centers indicating no batch effect or center-based expression artifact. e A Circos plot showing the correlation between expression profiles of cell types profiled at different centers. The individual cell types across centers depict significant similarity in the expression profiles. Some cell types with lower correlations include CD4+ memory T-cells from BIDMC, and monocytes and CD1c+ DCs from WashU.
Fig. 3
Fig. 3. Comparative analysis of T and NK cell subpopulations in multiple myeloma patients with rapid- and no- progression of the disease.
a A UMAP displaying the T-cell subclusters split based on clinical groups (i.e., NP, RP). Subclusters were manually labeled as CD4+ T-cells (naive, memory, regulatory), CD8+ T-cells (memory, exhausted, effector), or NK cells based on the expression of specific markers. Limited CITE-Seq data from BIDMC was used to confirm some cellular annotations. NK and CD8+ effector T-cells show elevated counts from NP samples, while RP samples contain higher counts of CD8+ exhausted T-cells. b Dot plot demonstrating the expression profile of key markers for each T-cell subtype from both the scRNA-seq and CITE-Seq (ADT) assays. Markers for cell types used were CD4+ T-cells (CD4+), CD4+ naive T-cells (CD4+, TCF7+, CCR7+, CD45RO+), CD4+ Memory T-cells (CD4+,IL7R+, CD45RA+), CD4+ regulatory T-cells (CD4+, FOXP3+), CD8+ T-cell (CD8A+, KLRB1+, IL7R+, GATA3+, GZMK low), CD8+ exhausted T-cells (CD8A+, GZMK+, TIGIT+), CD8+ effector T-cells (CD3D+, GNLY+, GZMB+), and NK cells (CD3D-, GNLY+, GZMB+). c The patient contribution to each cell type cluster indicates that most of the clusters consist of cells from multiple patients. The patients from RP and NP groups are shown with shades of red and blue respectively. d Comparative analysis of the T-cell types enriched in the RP and NP T-cell subsets. Each bar plot depicts mean and standard error of mean. Significant enrichment (P = 0.022) of the CD8+ exhausted T-cells was observed in the RP population. e Differential expression analysis of the three CD8+ T-cell subtypes (CD8+ memory T-cells, CD8+ exhausted T-cells, CD8+ effector T-cells). Columns represent individual cells, grouped by cell type, while rows display individual genes. CD8+ T-cells depicted upregulation of markers related to T-cell memory, such as IL7R, but has under-expression of cytotoxic markers such as GZMK, GZMB, or NKG7 as compared to other CD8 T-cell subtypes. CD8+ exhausted T-cells depicted upregulation of GZMK and multiple genes related to chemokine signaling, such as CCL3 and XCL2. CD8+ effector T-cells showed downregulation of GZMK and upregulation of GZMB and GZMH, along with cytotoxic markers such as PRF1 and GNLY. f Comparative analysis of the CD8+ subset between NP and RP groups. Differential expression analysis was performed based on the Wilcoxon rank sum test of NP and RP CD8+ T-cells. NP CD8+ T-cells showed upregulation of markers related to NK cells, such as GZMB and GZMH. RP CD8+ T-cells instead show upregulation of the CD8+ exhausted T-cell markers, specifically chemokines like CCL3L1 and XCL2. These differences are reflected in the average cell type ratios in the CD8+ subset in NP and RP samples. The ratio of these CD8+ exhausted T-cells to the GZMB+ effector cells is significantly higher in RP samples (P = 0.048). g Expression profile of markers of exhaustion in the CD8+ and NK subsets. CD8+ exhausted T-cells, predominantly found in the RP group, show the highest expression of TIGIT and EOMES in the RNA assay relative to other CD8+ T-cells. CD160 is detectable in CD8+ T-cells and CD8+ exhausted T-cells, though only in samples from the RP population. CITE-Seq confirms elevated expression of TIGIT and PD-1 (CD279) in the CD8+ exhausted T-cell cluster, and general enrichment of exhaustion markers in the RP group over the NP group across multiple CD8+ cell types.
Fig. 4
Fig. 4. Comparative analysis of the “monocyte and macrophage” and “GMP” immune microenvironment cell subpopulations in multiple myeloma patients with rapid- and no- progression of the disease.
a A UMAP displaying the monocyte and macrophage subcluster split based on clinical groups (NP and RP). Subclusters were labeled as either Granulocyte-Monocyte Progenitors (GMP), monocyte, CD16 + monocytes, M1 macrophages, M2 macrophage, MDSCs, or CD1c + dendritic cells (DC) based on expression of specific markers. GMP and CD1c + DCs show elevated counts in NP samples. b Dot plot demonstrating the key markers for the monocyte and macrophage subtypes. Markers to identify cell types include GMP (MPO+, ELANE+, MKI67+), monocytes (CD14+, S100A9+, S100A12+), M1 macrophages (CD14+, CD44+), M2 macrophages (CD163+, MRC1+), MDSCs (HLA-DRA low, ITGAM+, ARG1+), CD16 + monocytes (CD14-, FCGR3A+), and CD1c+ DCs (CD1c+). c The patient contribution to each cell type cluster indicating most of the clusters consist of cells from multiple patients. The patients from the RP and NP groups are shown with shades of red and blue. Overall, the NP group had a higher proportion of monocytes and macrophages relative to the RP group. d Comparative analysis of the myeloid cell types in the RP and NP myeloid subset. Each bar plot depicts the mean proportion of a specific cell type across clinical groups, with error bars displaying standard error of the mean. Individual dots show individual patient samples. M2 macrophages were significantly enriched (P = 0.045) within the RP population. e Pathway enrichment analysis on the monocyte and macrophage clusters. The Violin plots display the ssGSEA enrichment score of significantly differentially enriched pathways/gene sets between RP and NP groups. The RP group showed significant enrichment of interferon alpha and interferon gamma signaling pathways, while the NP group showed enrichment for TNF signaling and epithelial-mesenchymal transition pathways. f A bar graph displaying the top differentially enriched genesets of the monocyte and macrophage clusters based on FDR analysis between NP and RP is also shown. g A heatmap, displaying the top differentially expressed markers genes for NP and RP M1 macrophages. Columns represent individual cells, grouped by the RP or NP clinical groups, while rows display individual genes. Relative gene expression is shown in pseudo color, where blue represents downregulation, and red represents upregulation. h Selected pathways that are significantly (P < 0.01) enriched in the markers differentially expressed in the RP and NP M1 macrophage groups. Each bar represents a pathway with significant activation and inhibition in the RP group based on Z-score calculated using the IPA analysis platform. The pathways that are significantly activated (Z-score > 2) and inhibited (Z-score < −2) in the RP group are shown with orange and blue bars, respectively. i A heatmap, displaying the top differentially expressed genes for M1 and M2 macrophages. Columns represent individual cells, grouped by the type of macrophage (i.e., M1, M2), while rows display individual genes. Relative gene expression is shown in pseudo color, where blue represents downregulation, and red represents upregulation. j Selected pathways that are significantly (P < 0.01) enriched in the markers differentially expressed in the M1 and M2 macrophages. Each bar represents a pathway with significant activation and inhibition in the M1 macrophages group based on Z-score calculated using the IPA analysis platform. The pathways that are significantly activated and inhibited in the M1 macrophages are shown with orange and blue bars, respectively.
Fig. 5
Fig. 5. Progenitor and precursor B-Cells are enriched in the multiple myeloma patients with no progression of the disease.
a A UMAP displaying the B Cell subcluster split based on clinical groups (NP and RP). Subclusters were labeled as either pro B-cell, pre B-cell, memory B-cell, or naive B-cell based on expression of specific markers. b A dot plot displaying the key markers used to identify each B cell subtype. Naive B-cells were identified via the expression of MS4A1, SELL, and LTB. Memory B-cells were identified by expression of CD27. Pre B-cells were identified by low MS4A1 expression. Pro B-cells were identified by the expression of RAG1, RAG2, and IGL11. c The patient contribution to each cell type indicates most of the clusters consist of cells from multiple patients. The patients from the RP and NP groups are shown with shades of red and blue respectively. The majority of naive and memory B-cells are derived from samples of the RP group, while the majority of pre and progenitor B-cells are derived from samples of the NP group. d Comparative analysis of the B-cell types/subtypes in the RP and NP clinical groups. Each bar plot depicts average abundance across patients and error bars show the standard error of the mean. Individual dots represent the abundance of a cell type within an individual sample. Within the B-cell subtypes, there is no significant difference in the average patient ratio. e A heatmap, displaying the top differentially expressed marker genes for naive B-cells, memory B-cells, pre B-cells, and pro B-cells. Relative gene expression is shown in pseudo color, where blue represents downregulation, and red represents upregulation. f Pathway analysis was performed on the differentially expressed markers between mature and memory B-cell groups versus the pre and pro B-cells. Selected pathways that are significantly (P-value < 0.01) enriched in these markers are displayed in the bar chart. Each bar represents a pathway with significant activation and inhibition in naive or memory B-cells based on Z-score calculated using the IPA analysis platform. The pathways that are significantly activated and inhibited in the naive and memory B-cells are shown with orange and blue bars respectively.
Fig. 6
Fig. 6. Cell communication analysis reveals enriched signaling pathways and ligand-receptor interactions that are associated with poorer outcome in the rapid progressor group.
a A circle plot showing the overall communication between cell types in NP and RP groups. The lines in the plot depict the communication among the cell types. Lines are colored by the ‘sender’ cell type, with their thickness corresponding to the relative intensity of cellular communication measured based on ligand and receptor correlation. RP and NP samples showed similar communication patterns between cell types. b Heatmap comparing the interaction weights between each cell type in NP and RP groups. Rows correspond to different sender cells, while columns correspond to receivers. The enriched signaling intensity between two cell types in the RP and NP groups are shown in red and blue colors, respectively. Cytotoxic T-cells show enriched received signaling in NP samples from all cell types, while memory and regulatory CD4+ T-cells show enriched signaling with myeloid and B-cells in RP samples. c Comparison of the signaling structure for individual ligands in NP and RP. On the left, A UMAP embedding of the ligand-receptor pathways was generated based on the similarity of the sender and receiver populations, as defined by CellChat’s functional embedding. Ligands with similar sender and receiver cell types will have similar embeddings. On the right, a bar plot displaying the distance between NP and RP embeddings for each ligand is displayed. Dashed gray lines connect the NP and RP functional embeddings of the top three pathways by pathway distance, APP, IL16, and CCL. d Three ligand receptor pairs were isolated for further analysis: BAFF, IL16, and CCL. For each ligand, two chord diagrams are shown indicating the sender and receiver cell types involved in NP and RP. Chords are colored by the sender cell type. BAFF shows a similar signaling structure, with myeloid cells as senders and B-cells as receivers. CCL signaling involves T-cells as senders and myeloid cells as receivers in NP and RP samples, though RP shows additional myeloid cell types as receivers, along with some CCL secretion by myeloid cells. IL16 shows large structural differences, in which both groups have CD8+ exhausted and CD4+ regulatory T-cells as senders and myeloid cells as receivers, but RP samples show additional expression by B-cells and other CD4+ T-cells. e Violin plot comparing the expression of the ligands and receptors involved in BAFF, IL16, and CCL between NP and RP samples across all cell types.

Similar articles

Cited by

References

    1. Kumar SK, et al. Multiple myeloma. Nat. Rev. Dis. Prim. 2017;3:17046. doi: 10.1038/nrdp.2017.46. - DOI - PubMed
    1. Lopes R, et al. The immune microenvironment in multiple myeloma: friend or foe? Cancers. 2021;13:625. doi: 10.3390/cancers13040625. - DOI - PMC - PubMed
    1. Manier S, Sacco A, Leleu X, Ghobrial IM, Roccaro AM. Bone marrow microenvironment in multiple myeloma progression. J. Biomed. Biotechnol. 2012;2012:1–5. doi: 10.1155/2012/157496. - DOI - PMC - PubMed
    1. Kawano Y, et al. Targeting the bone marrow microenvironment in multiple myeloma. Immunol. Rev. 2015;263:160–172. doi: 10.1111/imr.12233. - DOI - PubMed
    1. Noll JE, et al. Myeloma plasma cells alter the bone marrow microenvironment by stimulating the proliferation of mesenchymal stromal cells. Haematologica. 2014;99:163–171. doi: 10.3324/haematol.2013.090977. - DOI - PMC - PubMed