. 2023 Jan 26;14(1):427.
doi: 10.1038/s41467-023-36052-8.

Climate teleconnections modulate global burned area

Affiliations

Climate teleconnections modulate global burned area

Adrián Cardil et al. Nat Commun. .

Abstract

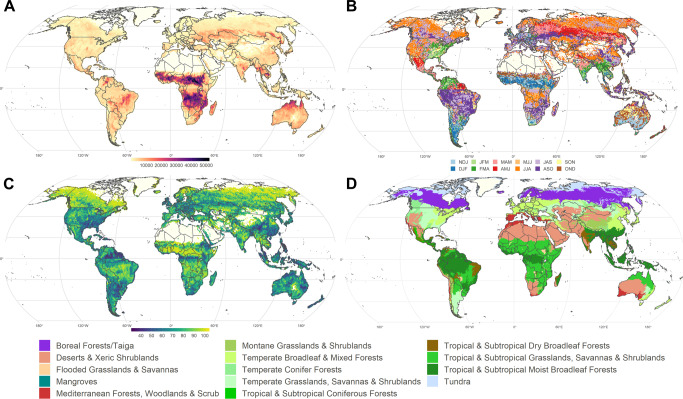
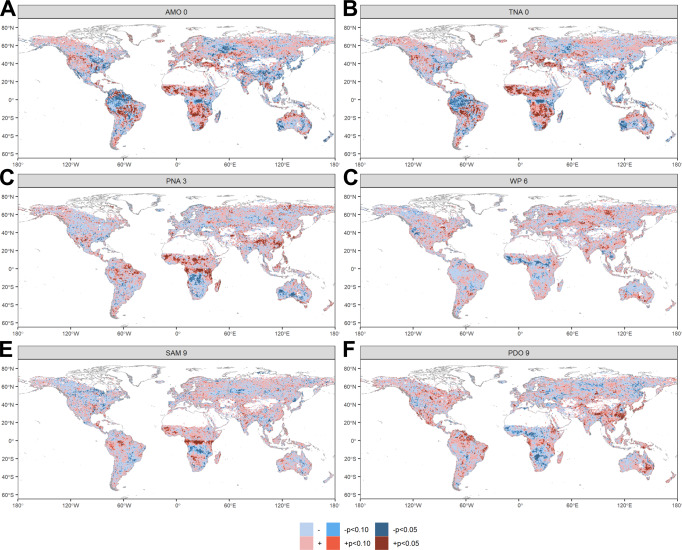
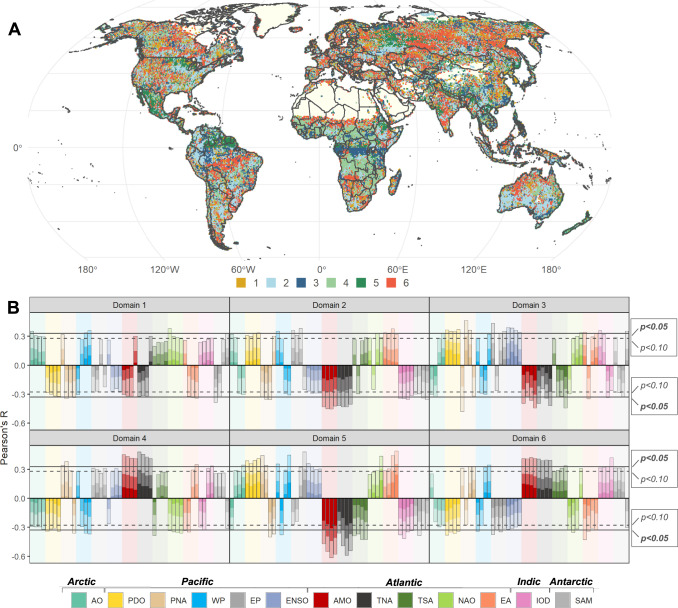
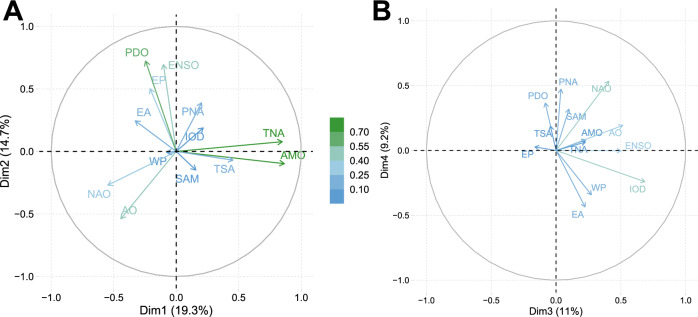
Climate teleconnections (CT) remotely influence weather conditions in many regions on Earth, entailing changes in primary drivers of fire activity such as vegetation biomass accumulation and moisture. We reveal significant relationships between the main global CTs and burned area that vary across and within continents and biomes according to both synchronous and lagged signals, and marked regional patterns. Overall, CTs modulate 52.9% of global burned area, the Tropical North Atlantic mode being the most relevant CT. Here, we summarized the CT-fire relationships into a set of six global CT domains that are discussed by continent, considering the underlying mechanisms relating weather patterns and vegetation types with burned area across the different world's biomes. Our findings highlight the regional CT-fire relationships worldwide, aiming to further support fire management and policy-making.


Conflict of interest statement

The authors declare no competing interests.

Figures

Fig. 1
Fig. 1. Global burned area (BA), climate teleconnections (CT) and biomes.
A Location of the studied CTs and average annual BA (km2; 0.5° pixel resolution) from 1982 to 2018 during the fire season peak (Atlantic Multidecadal Oscillation (AMO); Arctic Oscillation (AO); East Atlantic (EA); El Niño 3.4 SST index (ENSO); Eastern Pacific (EP); Indian Ocean Dipole (IOD); North Atlantic Oscillation (NAO); Pacific Decadal Oscillation (PDO); Pacific North American (PNA); Southern Annular Mode (SAM); Tropical North Atlantic (TNA); Tropical South Atlantic (TSA); Western Pacific (WP)); (B) Fire season peak, defined as the three consecutive months with the highest BA. The capital letters in the legend represent the initial letter of each month; (C) Percentage of annual BA during the fire season peak; (D) Distribution of the Earth’s 14 terrestrial biomes. Fire data: FireCCILT11 global BA product. Projection: Robinson (EPSG:54030).
Fig. 2
Fig. 2. Synchronous (0-month lag) and lagged (3, 6 and 9 months) Pearson R correlation between climate teleconnections (CT) and burned area (BA) during the fire season peak from 1982 to 2018.
The maps at 0.5°x 0.5° pixel resolution represent the correlations at P < 0.05 (|R| > = 0.34) and P < 0.10 (|R| > = 0.29) between BA and CTs. The six most important CTs in terms of modulated global BA are presented, namely Atlantic Multidecadal Oscillation (AMO (lag 0)), Tropical North Atlantic (TNA (lag 0)), Pacific North American (PNA (lag 3)), Western Pacific (WP (lag 6)), Pacific Decadal Oscillation (PDO (lag 9)) and Southern Annular Mode (SAM (lag 9)). See the supplementary materials for other CT modes and lags.
Fig. 3
Fig. 3. Climate teleconnection domains (CTD) characterizing CT-fire associations worldwide.
These domains were derived by applying a hierarchical clustering approach to the correlation coefficients obtained for the different combinations of CTs and lag windows at pixel level. A Spatial distribution of the six CTD. B Characterization of the CTD based on the relationship between each CT and burned area at a given time lag. Colored bars indicate the corresponding CT; color brightness relates (from darker to lighter) to the median, 75th and 95th percentile of Pearson’s R. Correlative bars with the same color are ordered from lag 0 to 9. Dashed lines mark the significance threshold (P < 0.05 (|R| > 0.34) and P < 0.10 (|R| > 0.29)). Atlantic Multidecadal Oscillation (AMO); Arctic Oscillation (AO); East Atlantic (EA); El Niño 3.4 SST index (ENSO); Eastern Pacific (EP); Indian Ocean Dipole (IOD); North Atlantic Oscillation (NAO); Pacific Decadal Oscillation (PDO); Pacific North American (PNA); Southern Annular Mode (SAM); Tropical North Atlantic (TNA); Tropical South Atlantic (TSA); Western Pacific (WP).
Fig. 4
Fig. 4. Relationships among climate teleconnections (CT) from 1982 to 2018 using Principal Component Analysis (PCA).
A First versus second PCA component (34.0% of variance); (B) third versus fourth PCA component (20.2% of variance). Color indicates the importance of the component for each variable as the square cosine.

Similar articles

Cited by

References

    1. Bond WJ, Woodward FI, Midgley GF. The global distribution of ecosystems in a world without fire. N. Phytol. 2005;165:525–538. doi: 10.1111/j.1469-8137.2004.01252.x. - DOI - PubMed
    1. Andela N, et al. A human-driven decline in global burned area. Science. 2017;356:1356–1361. doi: 10.1126/science.aal4108. - DOI - PMC - PubMed
    1. Cardil A, et al. Coupled effects of climate teleconnections on drought, Santa Ana winds and wildfires in southern California. Sci. Total Environ. 2021;765:142788. doi: 10.1016/j.scitotenv.2020.142788. - DOI - PubMed
    1. Mariani, M., Veblen, T. T. & Williamson, G. J. Climate change amplifications of climate-fire teleconnections in the southern climate change ampli fi cations of climate-fire teleconnections in the Southern Hemisphere. Geophys. Res. Lett. 45, 5071–5081 (2018).
    1. Rodrigues M, Peña-Angulo D, Russo A, Zúñiga-Antón M, Cardil A. Do climate teleconnections modulate wildfire-prone conditions over the Iberian Peninsula? Environ. Res. Lett. 2021;16:044050. doi: 10.1088/1748-9326/abe25d. - DOI

Publication types