. 2023 Jan 26;14(1):289.
doi: 10.1038/s41467-023-35955-w.

Microtubule nucleation and γTuRC centrosome localization in interphase cells require ch-TOG

Affiliations

Microtubule nucleation and γTuRC centrosome localization in interphase cells require ch-TOG

Aamir Ali et al. Nat Commun. .

Abstract

Organization of microtubule arrays requires spatio-temporal regulation of the microtubule nucleator γ-tubulin ring complex (γTuRC) at microtubule organizing centers (MTOCs). MTOC-localized adapter proteins are thought to recruit and activate γTuRC, but the molecular underpinnings remain obscure. Here we show that at interphase centrosomes, rather than adapters, the microtubule polymerase ch-TOG (also named chTOG or CKAP5) ultimately controls γTuRC recruitment and activation. ch-TOG co-assembles with γTuRC to stimulate nucleation around centrioles. In the absence of ch-TOG, γTuRC fails to localize to these sites, but not the centriole lumen. However, whereas some ch-TOG is stably bound at subdistal appendages, it only transiently associates with PCM. ch-TOG's dynamic behavior requires its tubulin-binding TOG domains and a C-terminal region involved in localization. In addition, ch-TOG also promotes nucleation from the Golgi. Thus, at interphase centrosomes stimulation of nucleation and γTuRC attachment are mechanistically coupled through transient recruitment of ch-TOG, and ch-TOG's nucleation-promoting activity is not restricted to centrosomes.


Conflict of interest statement

The authors declare no competing interests.

Figures
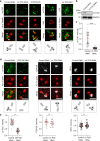
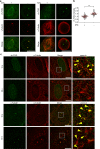
Fig. 1
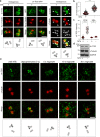
Fig. 1. ch-TOG localizes to the outer subdistal appendages.
a Maximum intensity projections of 3D-SIM images of centrosomal immunofluorescence staining of endogenous and recombinant ch-TOG (ch-TOG-GFP). U2OS cells transfected with control or ch-TOG siRNA #1, untreated U2OS cells, and U2OS cells stably expressing ch-TOG-GFP were stained with anti-ch-TOG antibody #1, anti-ch-TOG antibody #2 or anti-GFP antibody. Costaining was performed with antibodies against acetylated α-tubulin or NIN as indicated. Arrowheads point at subdistal appendage signals, asterisks indicate centriole distal end signals. b Lysate from U2OS cells transfected with control or ch-TOG siRNA #1 were analyzed by immunoblot against proteins indicated on the right. Detection of GAPDH served as loading control. Shown is one of two experiments with similar result. c Centrosomal ch-TOG staining intensity in cells after control or ch-TOG RNAi as in (a) normalized to the average of the control were quantified and plotted. Results are from N = 3 independent experiments, total number of cells analyzed: 60 in control and 58 in ch-TOG RNAi, ****p = 0.0001. d U2OS cells transfected with control siRNA, CEP128 siRNA or ch-TOG siRNA were stained with antibodies against ch-TOG (antibody #1), CEP128 or ODF2 as indicated. Co-staining of acetylated α-tubulin was used to label centrioles. e Centriolar fluorescence intensities of the indicated proteins in cells as in (d) normalized to the average of the control were quantified and plotted. Results are from N = 2 independent experiments, total number of cells analyzed: 48 in control and CEP128 RNAi, **p = 0.0028 (ch-TOG staining); 30 in control and 29 in ch-TOG RNAi, p = 0.4051 (CEP128 staining); 77 in control and 74 in ch-TOG RNAi, p = 0.2148 (ODF2 staining). Statistical significance was determined by unpaired, two-tailed t test with Welch’s correction. Ns, not significant. The horizontal bars and whiskers indicate median and interquartile range, respectively, of the plotted data points. Illustrations indicate centriole orientations in the respective images. Scale bars, 1 μm. Source data are provided as a Source Data file.
Fig. 2
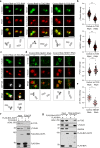
Fig. 2. ch-TOG transiently localizes to the PCM.
a Maximum intensity projections of 3D-SIM images of centrosomes stained for endogenous or recombinant ch-TOG (ch-TOG-GFP), in the presence or absence of microtubules. Cells were costained with antibodies against acetylated α-tubulin or antibodies against γ-tubulin and NIN as indicated. b Total centriolar intensities of endogenous ch-TOG staining in cells with or without microtubules as in (a) were quantified, normalized to the average intensity in cells with microtubules, and plotted. N = 3 independent experiments, total number of cells analyzed per condition: 141 (MTs + ) and 144 (MTs -), respectively. **p = 0.0018. The horizontal bars and whiskers indicate median and interquartile range, respectively, of the plotted data points. Statistical significance was determined by unpaired, two-tailed t test with Welch’s correction. c Intensities of endogenous ch-TOG staining at the PCM and at subdistal appendages in cells with or without microtubules as in (a) were quantified, normalized to the average intensities in cells with microtubules, and plotted. N = 3 independent experiments. Total number of cells analyzed for PCM staining: 55 (MTs+) and 56 (MTs−). *p = 0.0368. Total number of cells analyzed for subdistal appendage staining: 55(MTs+) and 56 (MTs−). *p = 0.0142. The horizontal bars and whiskers indicate median and interquartile range, respectively, of the plotted data points. Statistical significance was determined by unpaired, two-tailed t test with Welch’s correction. d Cell lysates prepared from U2OS cells with and without microtubules were analyzed by immunoblot using antibodies against the indicated proteins. Observed in two independent experiments. e Microtubules in U2OS cells were depolymerized, allowed to re-grow for the indicated time points, fixed and stained with antibodies against the indicated proteins. Illustrations indicate centriole orientations in the respective images. Performed twice with similar result. Scale bar, 1 μm. Source data are provided as a Source Data file.
Fig. 3
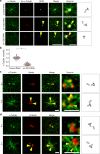
Fig. 3. ch-TOG promotes incorporation of γTuRC at PCM and subdistal appendages.
a U2OS cells transfected with control or ch-TOG siRNA #1 were fixed and stained with antibodies against the indicated proteins. b Intensities of centriolar γ-tubulin, NEDD1, and PCNT staining in cells as in (a) were quantified, normalized to the average of the respective controls, and plotted. γ-tubulin staining: N = 3 independent experiments; total number of cells analyzed, 75 (Control RNAi) and 69 (ch-TOG RNAi); ***p = 0.0004. NEDD1 staining: N = 3 independent experiments; total number of cells analyzed, 312 (Control RNAi) and 327 (ch-TOG RNAi); **p = 0.0042. PCNT staining: N = 2 independent experiments; total number of cells analyzed, 151 (Control RNAi) and 129 (ch-TOG RNAi); p = 0.3865 (ns, not significant). The horizontal bars and whiskers indicate median and interquartile range, respectively, of the plotted data points. Statistical significance was determined by unpaired, two-tailed t test with Welch’s correction without multiple comparison. c U2OS cells transfected with control or ch-TOG siRNA #1 were co-stained with antibodies against the indicated proteins. Performed twice with similar result. d U2OS cells treated with control or NEDD1 siRNA, with or without microtubules, were co-stained with antibodies against ch-TOG and γ-tubulin. e Centriolar ch-TOG intensities were quantified as in (d), normalized to the average of the intensities of the control, and plotted. N = 2 experiments, total number of cells analyzed, 30 per condition, **p = 0.0015. The horizontal bars and whiskers indicate median and interquartile range, respectively, of the plotted data points. Statistical significance was determined by unpaired, two-tailed t test with Welch’s correction. Illustrations indicate centriole orientations in the respective images. Scale bars, 1 μm. f, g Lysates from HEK293T cells transiently expressing Flag-BirA or Flag-BirA-GCP3 and grown in the presence of biotin for 24 h were subjected to affinity pulldowns using anti-FLAG antibody and streptavidin-coupled beads. The pulldown precipitates were subjected to immunoblot and probed with anti-ch-TOG, anti-γ-Tubulin, anti-FLAG, and anti-GAPDH antibodies. Detection of GAPDH was used as control. The results were replicated in two independent experiments. Source data are provided as a Source Data file.
Fig. 4
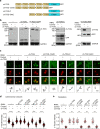
Fig. 4. ch-TOG is required for nucleation at interphase centrosomes.
a U2OS cells were transfected with control or ch-TOG siRNA. Microtubules were depolymerized by cold treatment for 30 min and then allowed to regrow for 5 s at 37 °C before fixation and staining with antibodies against the indicated proteins. Scale bar, 4 μm. Magnifications in the last column show centrosome regions. Performed twice with similar result. Scale bar, 1 µm. b α-Tubulin intensities around centrosomes were quantified, normalized to the average of the intensities of the control and plotted. N = 2 experiments, total number of cells analyzed: 91 (Control RNAi) and 86 (ch-TOG RNAi). *p = 0.0177. The horizontal bars and whiskers indicate median and interquartile range, respectively, of the plotted data points. Statistical significance was determined by unpaired, two-tailed t test with Welch’s correction. c, d Microtubules were depolymerized by cold treatment for 30 min before allowing regrowth for 2 s by incubation at 37 °C. Cells were fixed and stained as indicated. Illustrations show centriole orientations in the respective images. Magnifications in the last column show centrosome regions. Regrowth from subdistal appendage area was observed in two independent experiments. Scale bars, 1 μm. Source data are provided as a Source Data file.
Fig. 5
Fig. 5. Centrosomal nucleation requires ch-TOG TOG domains and C-terminus.
a Schematic representation of the domain structure of recombinant ch-TOG and truncation mutants carrying a C-terminal GFP tag. TOG domains colored in yellow, C-terminal domain in cyan. b U2OS wild type cells or cells stably expressing recombinant GFP-tagged ch-TOG constructs as in (a) were transfected with control or ch-TOG siRNA #1. Cell lysates were probed by western blotting for the indicated proteins. The asterisks mark the positions of recombinant proteins. Note that recombinant protein expression levels were always slightly increased in cells depleted of endogenous ch-TOG. c Cells as in (b) were analyzed by 3D-SIM for centrosomal localization of GFP-tagged ch-TOG constructs and of γ-tubulin. Illustrations indicate centriole orientations in the respective images. Scale bar, 1 μm. d Centriolar γ-tubulin intensities were quantified in cells as in (c), normalized to the average of the intensities of the control, and plotted. N = 4 experiments, total number of cells analyzed for control and ch-TOG RNAi, respectively: 116 and 116 (-); 120 and 117 (ch-TOG), 122 and 120 (ch-TOG-12345), 112 and 113 (ch-TOG-C), 113 and 95 (ch-TOG-345C). ***p = 0.0002 (-), p = 0.4899, not significant (ch-TOG), ****p < 0.0001 (ch-TOG-12345), ****p < 0.0001 (ch-TOG-C), ***p = 0.0005 (ch-TOG-345C). The horizontal bars and whiskers indicate median and interquartile range, respectively, of the plotted data points. Statistical significance was determined by unpaired, two-tailed t test with Welch’s correction. e Cells as in (c) were subjected to microtubule depolymerization by incubation on ice at 4 °C for 30 min. Following microtubule regrowth for 5 s at 37 °C, α-tubulin intensities of microtubule asters around centrosomes were quantified, normalized to the average of the intensities of the control, and plotted. N = 2 experiments, total number of cells analyzed for control and ch-TOG RNAi, respectively: 49 and 50 (-); 48 and 47 (ch-TOG), 50 and 48 (ch-TOG-12345), 49 and 50 (ch-TOG-C), 50 and 49 (ch-TOG-345C). **p = 0.0084 (-), p = 0.3937, not significant (ch-TOG), *p = 0.0169 (ch-TOG-12345), **p = 0.0062 (ch-TOG-C), *p = 0.0136 (ch-TOG-345C). The horizontal bars and whiskers indicate median and interquartile range, respectively, of the plotted data points. Statistical significance was determined by unpaired, two-tailed t test with Welch’s correction. Source data are provided as a Source Data file.
Fig. 6
Fig. 6. ch-TOG transiently associates with different nucleation sites.
a Maximum intensity projections of 3D-SIM images of ch-TOG localization at mitotic centrosomes in the presence or absence of microtubules. Cells were costained with antibodies against ch-TOG in combination with antibodies against γ-tubulin or α-tubulin. Scale bars, 10 µm. b Centrosomal ch-TOG intensities were quantified, normalized to the average of the intensities of the control, and plotted. N = 3 experiments, total number of cells analyzed: 63 (MTs+) and 61 (MTs−). *p = 0.0129. The horizontal bars and whiskers indicate median and interquartile range, respectively, of the plotted data points. Statistical significance was determined by unpaired, two-tailed t test with Welch’s correction. c RPE1 cells were subjected to microtubule depolymerization using nocodazole followed by cold treatment. Microtubule regrowth was allowed for 10 or 30 s at 37 °C. Cells were fixed, stained with antibodies against either ch-TOG or γ-tubulin and co-stained with α-tubulin to detect microtubules, and analyzed by 3D-SIM. Yellow arrowheads in zoom-in panels indicate microtubules that have ch-TOG or γ-tubulin signal at one of their ends. Three independent experiments (two stained for ch-TOG/α-tubulin, one stained for γ-tubulin/α-tubulin). Scale bars, 10 µm. Source data are provided as a Source Data file.
Fig. 7
Fig. 7. ch-TOG promotes nucleation from the Golgi.
a RPE1 control and ch-TOG RNAi cells were treated with nocodazole to depolymerize microtubules. After washout and incubation in ice, microtubules were allowed to regrow for 10 s. Cells were fixed and stained with antibodies against GM130 (Golgi), α-tubulin (microtubules), and ch-TOG. Scale bar, 10 µm. b The number of microtubules growing from the Golgi in control and ch-TOG RNAi cells as in (a) were scored and plotted. N = 3 experiments, total number of cells analyzed: 90 in each condition, *p = 0.0207. The horizontal bars and whiskers indicate median and interquartile range, respectively, of the plotted data points. Statistical significance was determined by unpaired, two-tailed t test with Welch’s correction. Source data are provided as a Source Data file.

Similar articles

Cited by

References

    1. Prosser SL, Pelletier L. Mitotic spindle assembly in animal cells: a fine balancing act. Nat. Rev. Mol. Cell Biol. 2017;18:187–201. doi: 10.1038/nrm.2016.162. - DOI - PubMed
    1. Sallee MD, Feldman JL. Microtubule organization across cell types and states. Curr. Biol. 2021;31:R506–R511. doi: 10.1016/j.cub.2021.01.042. - DOI - PubMed
    1. Hlavaty D, Lechler T. Roles for microtubules in the proliferative and differentiated cells of stratified epithelia. Curr. Opin. Cell Biol. 2021;68:98–104. doi: 10.1016/j.ceb.2020.10.002. - DOI - PMC - PubMed
    1. Akhmanova A, Steinmetz MO. Control of microtubule organization and dynamics: two ends in the limelight. Nat. Rev. Mol. Cell Biol. 2015;16:711–726. doi: 10.1038/nrm4084. - DOI - PubMed
    1. Paz J, Lüders J. Microtubule-organizing centers: towards a minimal parts list. Trends Cell Biol. 2018;28:176–187. doi: 10.1016/j.tcb.2017.10.005. - DOI - PubMed

Publication types