. 2023 Mar;7(3):405-413.
doi: 10.1038/s41559-022-01979-6. Epub 2023 Jan 26.

Rapid upwards spread of non-native plants in mountains across continents

Affiliations

Rapid upwards spread of non-native plants in mountains across continents

Evelin Iseli et al. Nat Ecol Evol. 2023 Mar.

Abstract

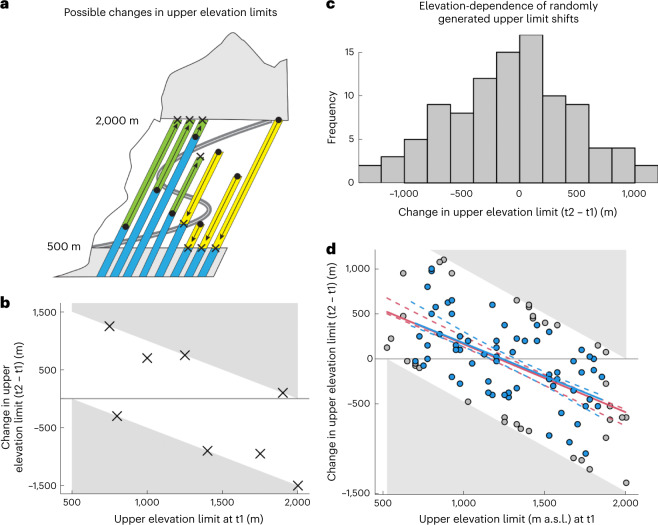
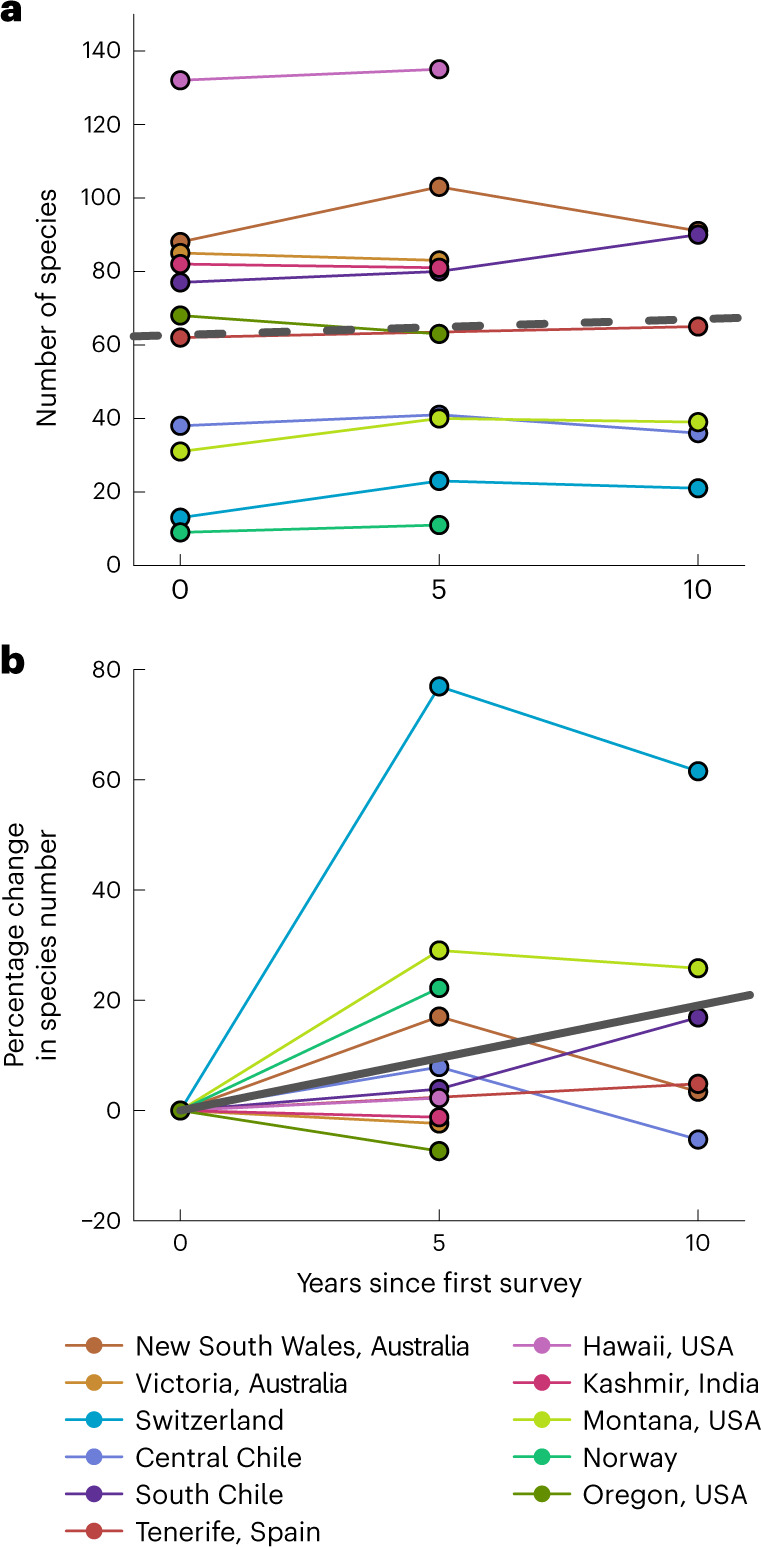
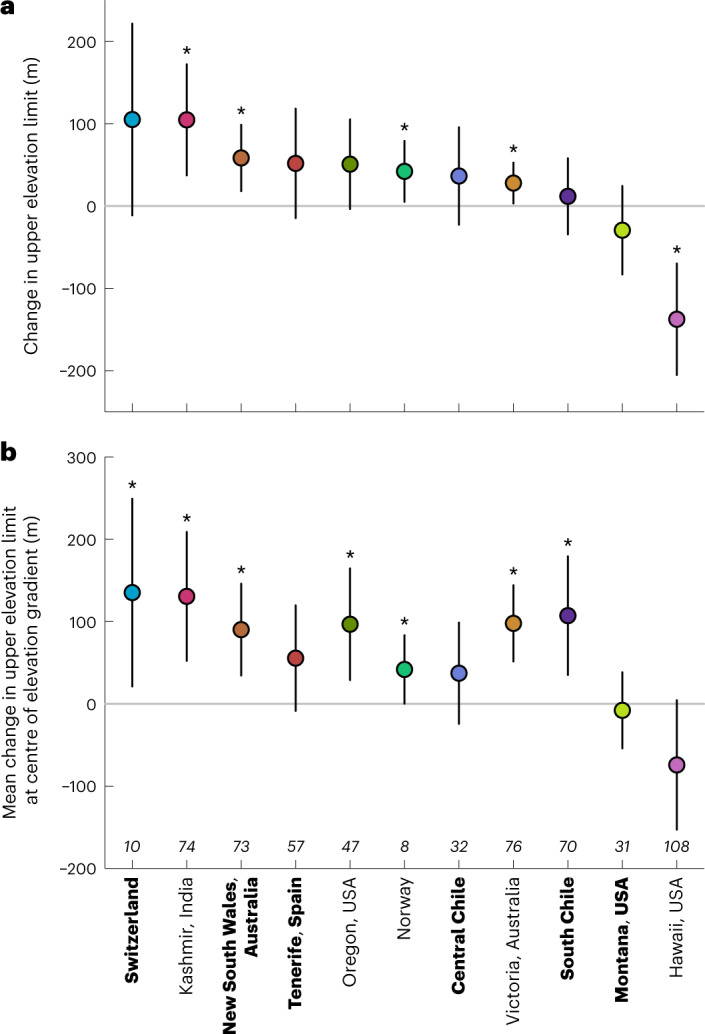
High-elevation ecosystems are among the few ecosystems worldwide that are not yet heavily invaded by non-native plants. This is expected to change as species expand their range limits upwards to fill their climatic niches and respond to ongoing anthropogenic disturbances. Yet, whether and how quickly these changes are happening has only been assessed in a few isolated cases. Starting in 2007, we conducted repeated surveys of non-native plant distributions along mountain roads in 11 regions from 5 continents. We show that over a 5- to 10-year period, the number of non-native species increased on average by approximately 16% per decade across regions. The direction and magnitude of upper range limit shifts depended on elevation across all regions. Supported by a null-model approach accounting for range changes expected by chance alone, we found greater than expected upward shifts at lower/mid elevations in at least seven regions. After accounting for elevation dependence, significant average upward shifts were detected in a further three regions (revealing evidence for upward shifts in 10 of 11 regions). Together, our results show that mountain environments are becoming increasingly exposed to biological invasions, emphasizing the need to monitor and prevent potential biosecurity issues emerging in high-elevation ecosystems.


Conflict of interest statement

The authors declare no competing interests.

Figures

Fig. 1
Fig. 1. A null-model approach to explaining species’ range limit shifts across an elevational gradient.
a, Possible changes in observed upper elevation limit for eight species (bars) shifting their upper limits upwards (green portions of bars: expansions) or downwards (yellow portions of bars: contractions) along an elevational gradient from time point 1 (t1; points) to time point 2 (t2; crosses). The species’ distributions are surveyed at sites along a hypothetical mountain road 500–2,000 m above sea level (a.s.l.) (within the unshaded region), although all of them also occur at lower elevations below the surveyed elevational window. b, The observed range shifts of the upper elevation limit for the eight example species (crosses) are plotted against their upper elevation limits at t1. The grey triangles delimit the boundaries of the surveyed elevational gradient (compare grey shaded regions in a) and hence represent ‘non-observable’ shifts in elevation limits. c, Histogram of upper limit shifts for 100 species, generated randomly within the constraints imposed by the boundaries of the observed elevational gradient (compare b). d, The boundaries of the observed elevational gradient give rise to the null expectation of a negative relationship between species’ upper limits during t1 and their shift at the upper elevation limit due to chance alone. The red line indicates the fitted relationship and dotted red lines indicate 95% CIs for the expected relationship based on 1,000 resamples (with replacement) of the 100 species’ elevational limits at t1, accounting for the geometric constraint. Excluding species occurring in the top and bottom 10% of the gradient either at t1 or t2 (remaining species coloured in blue) results in the fitted relationship depicted by the blue line. The dotted blue lines indicate 95% CIs calculated as described above but excluding species falling in the top and bottom 10% of the gradient.
Fig. 2
Fig. 2. Temporal changes of non-native plant species in 11 mountain regions.
a,b, Total species richness (a) and percentage change in species richness (b) over the 10-year sampling period. Solid and dashed heavy grey lines indicate significant and non-significant fits, respectively, from mixed-effects models including all non-native species occurring at least twice in a region (see text). Not all regions were sampled in all years.
Fig. 3
Fig. 3. Observed changes in species’ upper elevational limits (±95% CIs).
Both panels show mean shifts between the first and last survey in each region, estimated from linear models that weight species by their total frequency of occurrence in both years and are fitted to data from each region separately (for mean annual shifts see Supplementary Fig. 1). a,b, Results of intercept-only models (grand mean shifts per region) (a) and results of models that correct for elevation by including species’ initial elevation limit during the first survey as a linear predictor (b). Specifically, estimates in b correspond to the predicted mean shift in elevation limits when evaluated at the median elevation within a given region; values >0 therefore indicate that average shifts are upslope across most of the elevational gradient (compare Fig. 4). Regions are ordered by effect size in a, with labels in regular and bold typeface indicating regions with 5- or 10-year survey intervals, respectively. Estimates that differ significantly from zero are indicated by *. Numbers in italics describe the sample size; colours correspond to the same labels as in Fig. 2.
Fig. 4
Fig. 4. Null-model tests of elevation-dependent shifts in upper elevation limit of non-native plant species in 11 mountain regions.
Each point shows the change in upper elevation limit (90th quantile of elevational distribution) of a single species, as a function of its limit in the first survey (darker shading of points corresponds to greater total log(frequency of occurrence) of a species in both surveys, ranging from n = 2 (40 species in 10 regions) to n = 187 (Hypochaeris radicata in Victoria, Australia)). Red regression lines are fitted relationships for observed range limit shifts, weighted by species’ frequency of occurrence. Grey triangles indicate shifts that could not have been observed on the basis of the elevational extent of the field survey (compare Fig. 1); dashed lines are 95% CIs for the expected null relationship between initial upper elevation limit and change in upper elevation limit after accounting for this constraint (Methods; Fig. 1). The proportion of fitted values that fall above or below the CIs in each region are indicated in the top-right of each panel, with non-zero values indicating a significant deviation from the null expectation. Colours correspond to the same labels as in Fig. 2.

References

    1. Essl F, et al. A conceptual framework for range-expanding species that track human-induced environmental change. BioScience. 2019;69:908–919. doi: 10.1093/biosci/biz101. - DOI
    1. Lenoir J, et al. Species better track climate warming in the oceans than on land. Nat. Ecol. Evol. 2020;4:1044–1059. doi: 10.1038/s41559-020-1198-2. - DOI - PubMed
    1. Pecl GT, et al. Biodiversity redistribution under climate change: impacts on ecosystems and human well-being. Science. 2017;355:eaai9214. doi: 10.1126/science.aai9214. - DOI - PubMed
    1. Freeman BG, Lee-Yaw JA, Sunday JM, Hargreaves AL. Expanding, shifting and shrinking: the impact of global warming on species’ elevational distributions. Glob. Ecol. Biogeogr. 2018;27:1268–1276. doi: 10.1111/geb.12774. - DOI
    1. van Kleunen M, et al. Global exchange and accumulation of non-native plants. Nature. 2015;525:100–103. doi: 10.1038/nature14910. - DOI - PubMed

Publication types