

Transmission structured illumination microscopy with tunable frequency illumination using tilt mirror assembly
- PMID: 36702876
- PMCID: PMC9879979
- DOI: 10.1038/s41598-023-27814-x
Transmission structured illumination microscopy with tunable frequency illumination using tilt mirror assembly
Abstract
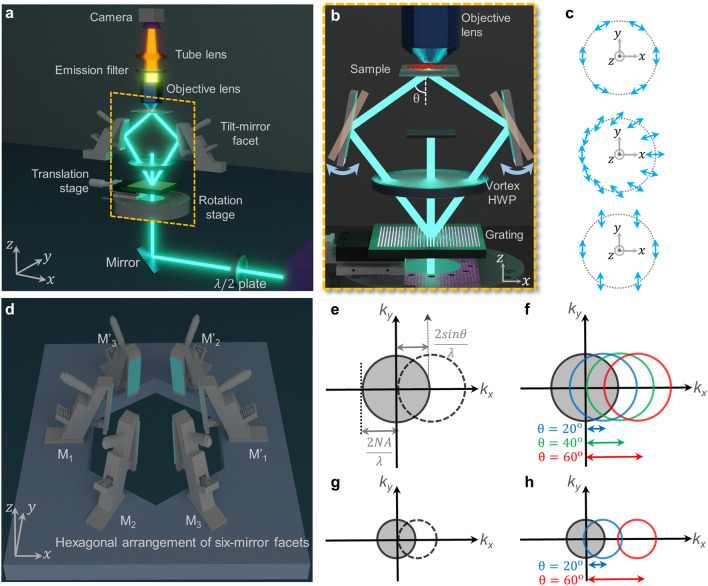
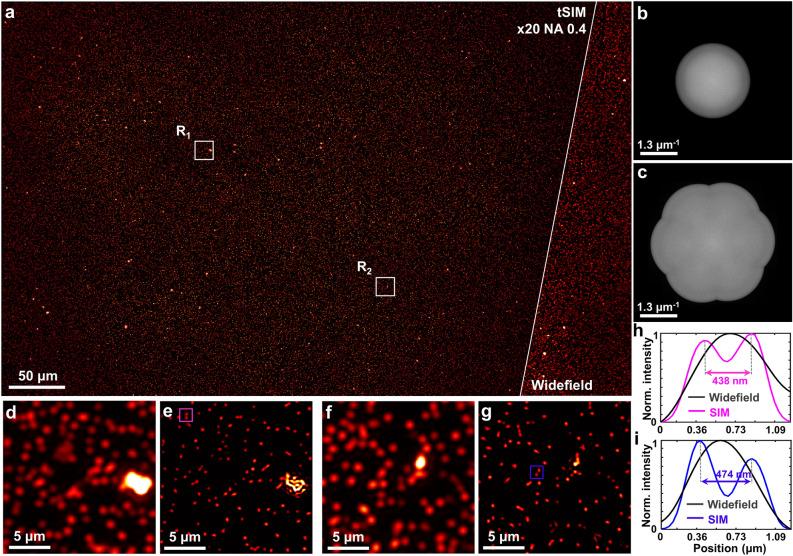
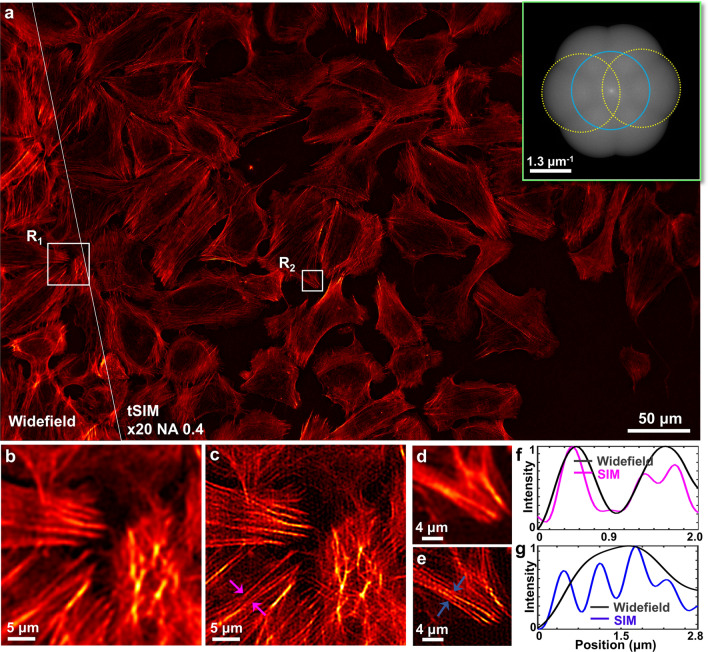
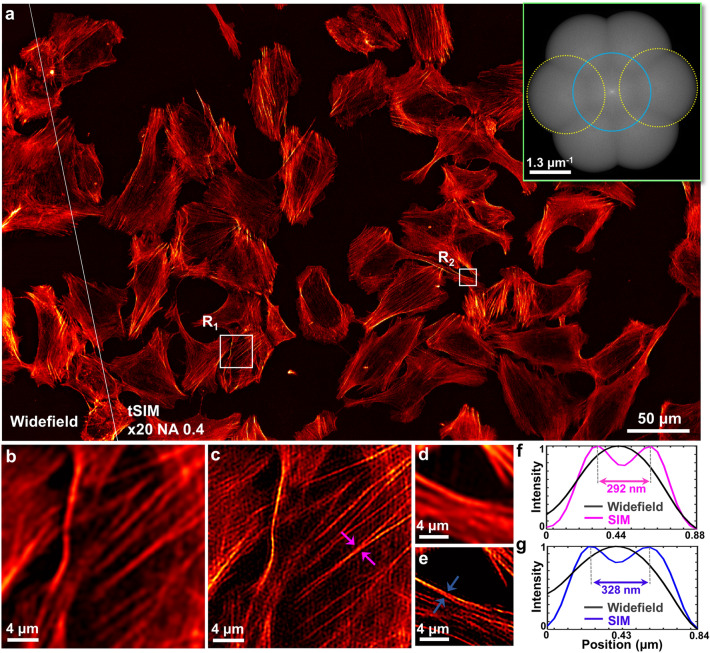
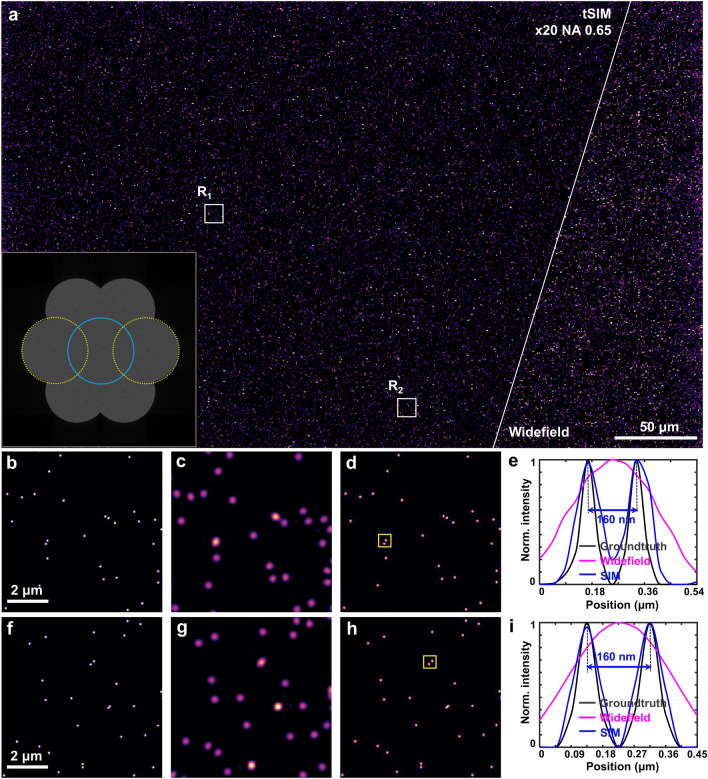
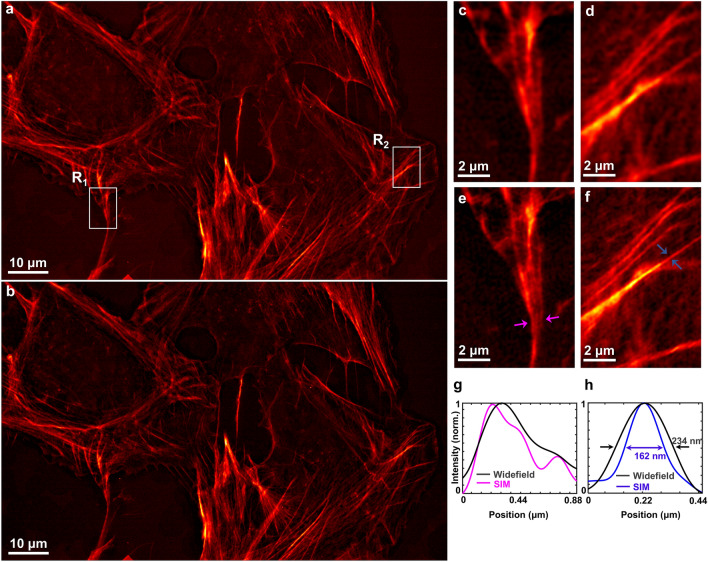
We present experimental demonstration of tilt-mirror assisted transmission structured illumination microscopy (tSIM) that offers a large field of view super resolution imaging. An assembly of custom-designed tilt-mirrors are employed as the illumination module where the sample is excited with the interference of two beams reflected from the opposite pair of mirror facets. Tunable frequency structured patterns are generated by changing the mirror-tilt angle and the hexagonal-symmetric arrangement is considered for the isotropic resolution in three orientations. Utilizing high numerical aperture (NA) objective in standard SIM provides super-resolution compromising with the field-of-view (FOV). Employing low NA (20X/0.4) objective lens detection, we experimentally demonstrate [Formula: see text] (0.56 mm[Formula: see text]0.35 mm) size single FOV image with [Formula: see text]1.7- and [Formula: see text]2.4-fold resolution improvement (exploiting various illumination by tuning tilt-mirrors) over the diffraction limit. The results are verified both for the fluorescent beads as well as biological samples. The tSIM geometry decouples the illumination and the collection light paths consequently enabling free change of the imaging objective lens without influencing the spatial frequency of the illumination pattern that are defined by the tilt-mirrors. The large and scalable FOV supported by tSIM will find usage for applications where scanning large areas are necessary as in pathology and applications where images must be correlated both in space and time.
© 2023. The Author(s).
Conflict of interest statement
The authors declare no competing interests.
Figures
Similar articles
-
Co-linear Hexa-Mirror-Based Multi-Periodic Structured Illumination Microscopy.Nano Lett. 2025 Feb 12;25(6):2133-2140. doi: 10.1021/acs.nanolett.4c04799. Epub 2025 Jan 29. Nano Lett. 2025. PMID: 39880792
-
Interference illumination of three nonzero-order beams for LCOS-based structured illumination microscopy.J Microsc. 2019 Aug;275(2):97-106. doi: 10.1111/jmi.12806. Epub 2019 May 23. J Microsc. 2019. PMID: 31087655
-
Compact structured illumination microscopy with high spatial frequency diffractive lattice patterns.Biomed Opt Express. 2022 Oct 31;13(11):6113-6123. doi: 10.1364/BOE.473899. eCollection 2022 Nov 1. Biomed Opt Express. 2022. PMID: 36733745 Free PMC article.
-
Recent advancements in structured-illumination microscopy toward live-cell imaging.Microscopy (Oxf). 2015 Aug;64(4):237-49. doi: 10.1093/jmicro/dfv034. Epub 2015 Jun 30. Microscopy (Oxf). 2015. PMID: 26133185 Review.
-
[Comparison and progress review of various super-resolution fluorescence imaging techniques].Se Pu. 2021 Oct;39(10):1055-1064. doi: 10.3724/SP.J.1123.2021.06015. Se Pu. 2021. PMID: 34505427 Free PMC article. Review. Chinese.
Cited by
-
Cellular optical imaging techniques: a dynamic advancing frontier.Sci China Life Sci. 2025 Jul 16. doi: 10.1007/s11427-024-2916-5. Online ahead of print. Sci China Life Sci. 2025. PMID: 40681818 Review.
-
Ultra-high spatio-temporal resolution imaging with parallel acquisition-readout structured illumination microscopy (PAR-SIM).Light Sci Appl. 2024 May 29;13(1):125. doi: 10.1038/s41377-024-01464-8. Light Sci Appl. 2024. PMID: 38806501 Free PMC article.
References
-
- Abbe E. Beiträge zur theorie des mikroskops und der mikroskopischen wahrnehmung. Arch. Mikrosk. Anat. 1873;9:413–468. doi: 10.1007/BF02956173. - DOI
-
- Samanta K, Joseph J. An overview of structured illumination microscopy: Recent advances and perspectives. J. Opt. 2021 doi: 10.1088/2040-8986/ac3675. - DOI
LinkOut - more resources
Full Text Sources
