. 2023 Jun;41(6):824-831.
doi: 10.1038/s41587-022-01558-x. Epub 2023 Jan 26.

In vivo development of immune tissue in human intestinal organoids transplanted into humanized mice

Affiliations

In vivo development of immune tissue in human intestinal organoids transplanted into humanized mice

Carine Bouffi et al. Nat Biotechnol. 2023 Jun.

Abstract

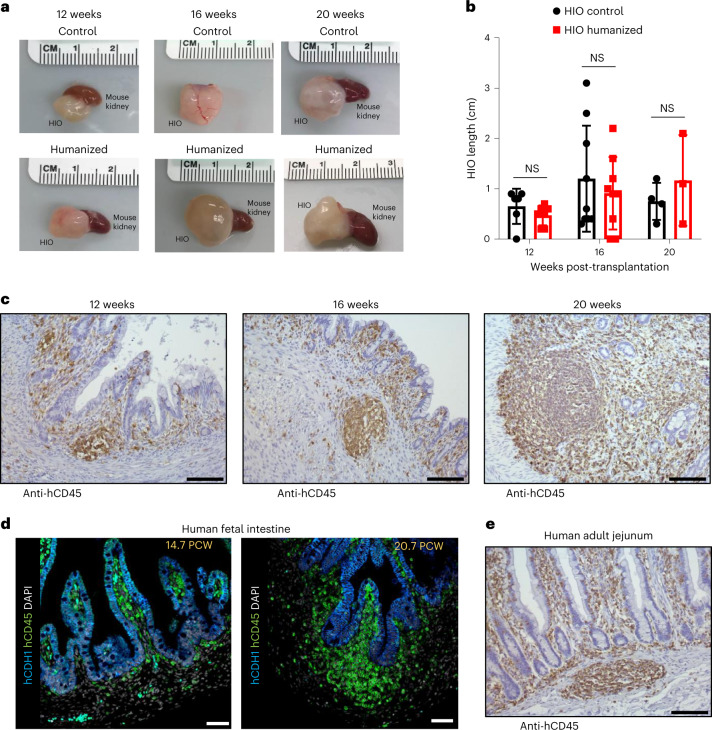
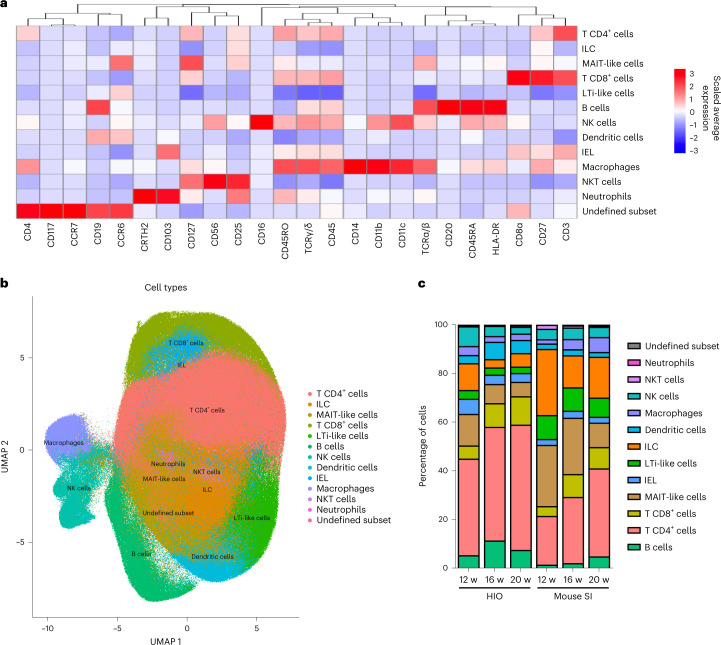
Human intestinal organoids (HIOs) derived from pluripotent stem cells provide a valuable model for investigating human intestinal organogenesis and physiology, but they lack the immune components required to fully recapitulate the complexity of human intestinal biology and diseases. To address this issue and to begin to decipher human intestinal-immune crosstalk during development, we generated HIOs containing immune cells by transplanting HIOs under the kidney capsule of mice with a humanized immune system. We found that human immune cells temporally migrate to the mucosa and form cellular aggregates that resemble human intestinal lymphoid follicles. Moreover, after microbial exposure, epithelial microfold cells are increased in number, leading to immune cell activation determined by the secretion of IgA antibodies in the HIO lumen. This in vivo HIO system with human immune cells provides a framework for future studies on infection- or allergen-driven intestinal diseases.


Conflict of interest statement

The authors declare no competing interests.

Figures

Fig. 1
Fig. 1. Integrating immune cells in HIO using immune system-humanized mouse model.
a, Transplanted HIOs at 12, 16 and 20 weeks with mouse kidney seen underneath from control or humanized mice. b, Graph represents the length of HIOs from control (black circle) or humanized (red square) group at 12 weeks (n = 6 control and 7 humanized mice), 16 weeks (n = 9 control and 9 humanized mice) and 20 weeks (n = 4 control and 3 humanized mice) post-transplantation. Mean ± s.d. Multiple Mann–Whitney tests (two-sided); P = 0.1666 for 12 weeks, P = 0.7120 for 16 weeks and P = 0.714 for 20 weeks. NS, not significant. Graph representative of at least three independent experiments. c, Formalin-fixed paraffin-embedded sections of transplanted HIO at 12 (n = 5), 16 (n = 7) and 20 (n = 3) weeks stained by IHC with anti-human CD45 antibody. Scale bars, 100 μm. Representative of at least three independent experiments. d, Human fetal intestine at 14.7 and 20.7 PCW stained, by immunofluorescence, with anti-human CDH1 (E-cadherin) (blue), anti-human CD45 (green) antibodies and DAPI (white). Scale bars, 100 μm. Representative of two samples. e, Human adult jejunum stained by IHC with anti-human CD45 antibody. Scale bar,  100 μm. Representative of three samples.
Fig. 2
Fig. 2. Immune profiling in HIOs and humanized mouse SI by mass cytometry.
a, Heatmap illustrating the level of expression of each marker (x axis) for each cluster corresponding to their identified cell type (y axis). b, Visualization of high-dimensional data with UMAP overlaid with identified cell types. Heatmap (a) and UMAP (b) were generated with combined CyTOF dataset from transplanted HIO and humanized mouse SI at 12, 16 and 20 weeks post-transplantation. c, Stacked bar graph representing the frequencies of each cell type per tissue and time point. IEL, intraepithelial lymphocyte; LTi, lymphoid tissue inducer cell; ILC, innate immune cell; MAIT, mucosal-associated invariant T cell; NK, natural killer cell; NKT, natural killer T cell; w, weeks.
Fig. 3
Fig. 3. Immune cellular aggregates in transplanted HIO contain T and B cells.
a,b, Presence of human T cells (anti-hCD3) (a) and human B cells (anti-CD20) (b) in HIO at 12 (n = 5), 16 (n = 7) and 20 (n =3) weeks post-transplantation. Scale bar, 100 μm. Representative of three independent experiments.
Fig. 4
Fig. 4. Lymphoid-like structures in transplanted HIOs correlate to lymphoid development in fetal gut.
a, Prevalence of immune developmental features observed in HIO. Representative of two independent experiments,. bf, Images illustrating features observed in HIO that resemble immune cell development described in fetal gut. bd, HIO sections stained with anti-human CD3 (top) to demonstrate the presence of T cells, anti-human CD4/CD8 (middle) to distinguish T helper cells versus T cytotoxic cells and anti-human CD20 (bottom) to highlight the presence of B cells. e, Hematoxylin and eosin (H&E) staining indicating the presence of neutrophils (black arrowheads) observed in late developing HIOs only. f, H&E staining highlight the presence of plasma cells (black arrowheads, top) then confirmed with anti-human MUM1 IHC staining (bottom). Scale bars, 50 μm. Representative of two independent experiments.
Fig. 5
Fig. 5. M cells are induced after microbial exposure in transplanted HIOs.
a–c, 16-week HIO sections at 72 h post injection with saline (n = 3) (left) or E. coli lysate (n = 4) (right) stained with anti-human CD45 (a), anti-human GP2 (b) and anti-MUM1 (c). Arrows indicate M cells positive for human GP2. Scale bars represent 100 µm, except b (bottom) human GP2 scale bars represent 50 µm. Representative of two independent experiments. d, Graph represents level of human GP2 gene expression evaluated by qPCR in 16-week HIO at 72 h post injection with saline (n = 3) or E. coli lysate (n = 6). Human GP2 gene expression is normalized to human GAPDH gene. Mean ± s.d. Mann–Whitney test (two-sided); P = 0.1667. NS, not significant. e, Level of human IgA measured by ELISA in mucus from 16-week HIO 72 h after being injected with saline (n = 2) or E. coli lysate (n = 4). Mean ± s.d. Mann–Whitney tests (two-sided); P = 0.533. NS, not significant. f, Immunofluorescence staining with anti-human CDH1 (white), anti-human GP2 (red) and anti-human CD20 (blue) in 16-week HIOs injected with E. coli lysate (n = 4) for 72 h. Scale bar, 50 µm. Representative of two independent experiments.
Extended Data Fig. 1
Extended Data Fig. 1. Validation of the humanized mouse model.
a. Experimental workflow. Human intestinal organoids (HIOs) generated in vitro were then transplanted in humanized or control mice. At 12, 16 and 20 weeks post transplantation, HIOs and tissues of interest were collected for analysis. b-d. Flow cytometry analysis of peripheral blood from humanized mice. Contour plots represent the gating strategy of human immune cell lineages in humanized mice post HIO transplantation (b). Graph represents percentage of total hCD45+ cells (c) or, as indicated, immune cell subsets (d) in peripheral blood of humanized mice at 12 (n = 7), 16 (n = 9) and 20 (n = 3) weeks post HIO transplantation. Mean± standard deviation (SD). e. Graph represents relationship between length of HIO and percentage of blood hCD45 at different time points. Spearman correlation coefficient r = 0.1881 with P = 0.4405 (two-sided). (12 weeks n = 7; 16 weeks n = 9 and 20 weeks n = 3 mice) f. Humanized mouse small intestine at indicated time, were stained with anti-human CD45 by immunohistochemistry (IHC) and couterstained with hematoxylin. Scale bar represents 50 µm.
Extended Data Fig. 2
Extended Data Fig. 2. Intestinal cell lineage expression in HIO transplanted in humanized mice.
a-d. Co-staining of intestinal markers (red), human CD45 (green) and human CDH1 (white) on sections of HIOs at 12, 16 and 20 weeks post transplantation in humanized mice. Images represent presence of enterocytes (VIL/Villin) (a), goblet cells (MUC2/Mucin2) (b), Paneth cells (LYZ/Lysozyme) (c) and enteroendocrine cells (CHGA/Chromogranin A) (d). Scale bar represents 100 µm. Representative of 2 independent experiments.
Extended Data Fig. 3
Extended Data Fig. 3. Profile expression of each marker in two-dimensional UMAP graph.
UMAP graphs represent the expression of each marker across the samples.
Extended Data Fig. 4
Extended Data Fig. 4. Expression of each markers at cellular level per cell types, tissues and time points.
Heatmap graph represents the level of expression of each markers per cell. Each bar on the heatmap corresponds to a cell from a sample (HIO or mouse small intestine (SI) at 12, 16 or 20 weeks post transplantation). Top x axis corresponds to the cluster/identified cell type. Bottom x axis corresponds to the group: HIO or mouse small intestine (SI) at 12, 16 or 20 weeks (see color legend on top right corner).
Extended Data Fig. 5
Extended Data Fig. 5. T cell cytokine profile from transplanted HIO is comparable to intestinal T cells from humanized mice.
a. Contour plots illustrate the graphs (bottom) representing the expression of TNF-α, IFN-γ and IL-2 in unstimulated or PMA/ionomycin (PMA/iono)-treated human CD4+ T cells isolated from HIO (black square; n = 4 samples) or mouse small intestine (SI) (open square; n = 4 samples) from humanized mice at 16 weeks post transplantation. Mean±SD. Wilcoxon matched-pairs signed rank test (two-sided). Non-significant (n.s). b. Indicated cytokines were measured by multiplex (Luminex®) assay in supernatants of immune cells isolated from HIO (black square; n = 3 samples) or mouse small intestine (SI) (open square; n = 3 samples) of humanized mice at 16 weeks post transplantation and treated for 3 days with anti-CD3/CD28 antibody or untreated media. Mean±SD. Wilcoxon matched-pairs signed rank test (two-sided). Non-significant (n.s).
Extended Data Fig. 6
Extended Data Fig. 6. Presence of T cells with few scattered B cells in humanized mouse small intestine.
Humanized mouse small intestine at 12, 16 and 20 weeks post HIO transplantation, were stained with anti-human CD3 (T cells) (a) or anti-human CD20 (B cells) (b) by immunohistochemistry(IHC) and couterstained with hematoxylin. In panel (b) black arrowheads indicate presence of B cells in humanized mouse small intestine. Scale bar represents 50 µm. Representative of 3 independent experiments.
Extended Data Fig. 7
Extended Data Fig. 7. Mechanism of human lymphoid follicle development.
Schema summarizes the cellular mechanism of lymphoid follicle formation during fetal gut development described by Spencer et al. and Braegger et al. (see references,). Briefly, around 11 post conceptual weeks (PCW), T cells start to invade the gut followed by B cells. Around 14 to 16 PCW, T and B cells form aggregates and later mature into lymphoid follicles, at 19 PCW. Plasma cells as well as granulocytes were observed in fetal intestine at 22 PCW.
Extended Data Fig. 8
Extended Data Fig. 8. HIO-derived enteroids express M cell in vitro.
a. Enteroid monolayers were grown to confluence, differentiated for 5 days (with DF or M cell media), immunostained with glycoprotein 2 (GP-2) and actin and imaged by confocal microscopy. b. Enteroid monolayers grown in M cell media and stained with GP-2 and imaged by confocal microscopy. c. qPCR for M cell specific transcription factors SOX8 and SPI-B as well as mature M cell marker GP2. n = 3 (technical triplicate). Mean±SEM. Representative of 1 independent experiment.
Extended Data Fig. 9
Extended Data Fig. 9. HIO microenvironment orchestrates GALT formation independently of the timing of hematopoietic reconstitution.
10 weeks after UCB engraftment, HIOs were transplanted and grown for 12 weeks. a. Transplanted HIO at 12 weeks with mouse kidney seen underneath from control or humanized mice. b. Graph represents the length of HIOs from control (n = 5) (black dot) or humanized (n = 4) (green square) group. Mean± standard deviation (SD). Mann-Whitney tests (two-sided); p = 0.1905. c. Graph represents immunophenotyping of peripheral blood from humanized mice at 12 weeks post HIO transplantation (or 22 weeks post UCB engraftment) (n = 4). Mean± standard deviation (SD). d-e.Formalin-fixed paraffin-embedded (FFPE) sections of transplanted HIO at 12 weeks H&E-stained (d) or stained by IHC with anti-human CD45 (e) and anti-human CD3 (brown) and CD20 (red) antibodies (f). Scale bar represents 100 μm.
Extended Data Fig. 10
Extended Data Fig. 10. GALT-associated chemokines are expressed in HIO at 16 weeks.
Graphs represent gene expression of indicated chemokines in transplanted HIO (a) or humanized mouse small intestine (SI) (b) at 16 weeks. n = 3 HIO and n = 3 humanized mouse SI. Gene expression is normalized to housekeeping gene (GAPDH). Mean± standard deviation (SD).

References

    1. Mowat AM, Agace WW. Regional specialization within the intestinal immune system. Nat. Rev. Immunol. 2014;14:667–685. doi: 10.1038/nri3738. - DOI - PubMed
    1. Rios D, et al. Antigen sampling by intestinal M cells is the principal pathway initiating mucosal IgA production to commensal enteric bacteria. Mucosal Immunol. 2016;9:907–916. doi: 10.1038/mi.2015.121. - DOI - PMC - PubMed
    1. Schreurs R, et al. Human fetal TNF-α-cytokine-producing CD4+ effector memory T cells promote intestinal development and mediate inflammation early in life. Immunity. 2019;50:462–476.e8. doi: 10.1016/j.immuni.2018.12.010. - DOI - PubMed
    1. Andrews C, McLean MH, Durum SK. Cytokine tuning of intestinal epithelial function. Front. Immunol. 2018;9:1270. doi: 10.3389/fimmu.2018.01270. - DOI - PMC - PubMed
    1. Neurath MF. Cytokines in inflammatory bowel disease. Nat. Rev. Immunol. 2014;14:329–342. doi: 10.1038/nri3661. - DOI - PubMed

Publication types