. 2023 Sep;41(9):1272-1286.
doi: 10.1038/s41587-022-01648-w. Epub 2023 Jan 26.

Spatial transcriptomics for profiling the tropism of viral vectors in tissues

Affiliations

Spatial transcriptomics for profiling the tropism of viral vectors in tissues

Min J Jang et al. Nat Biotechnol. 2023 Sep.

Abstract

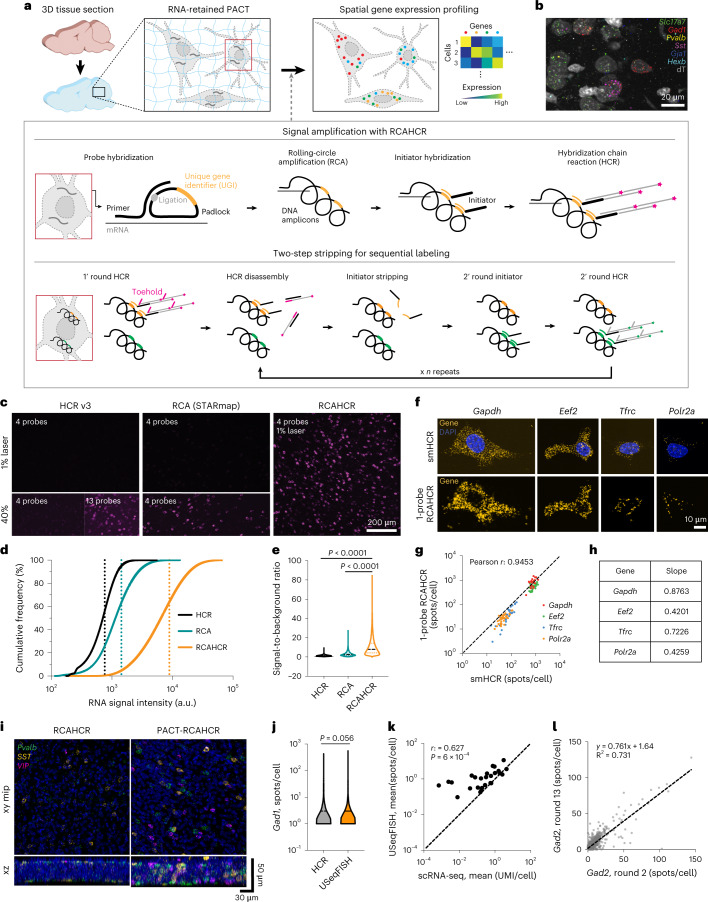
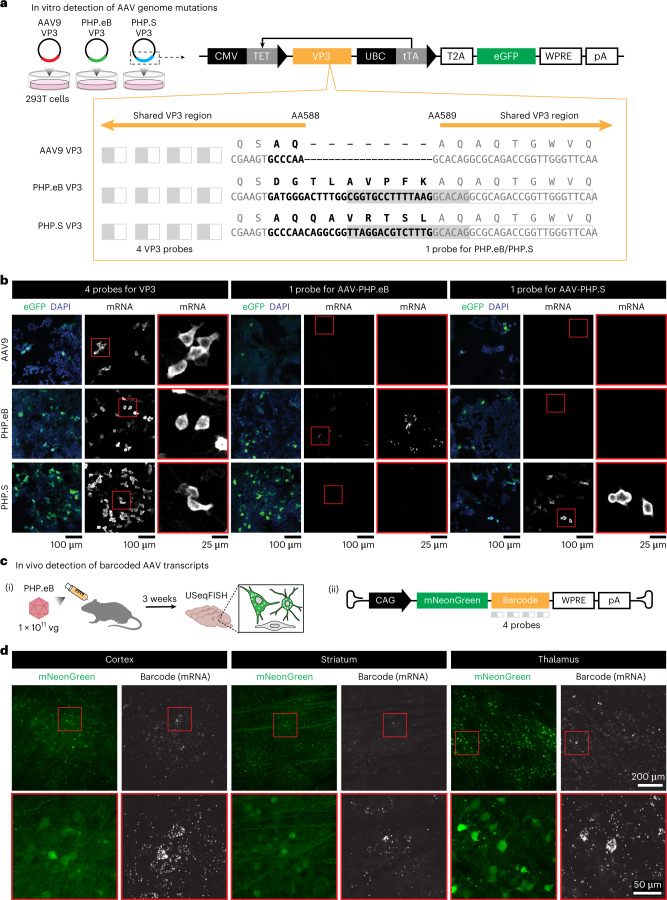
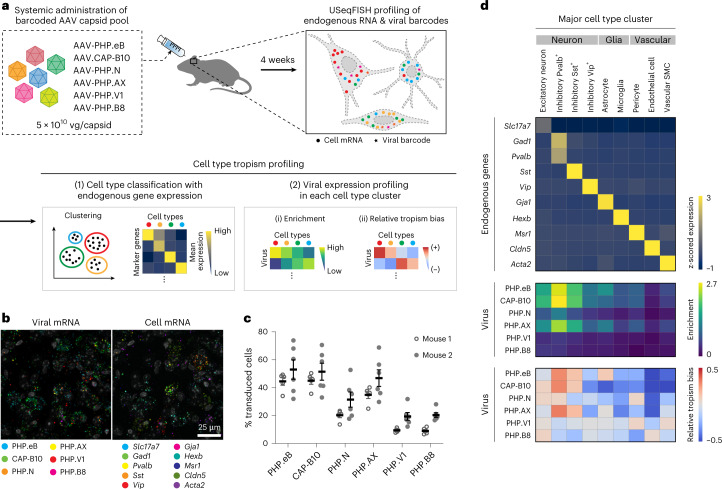
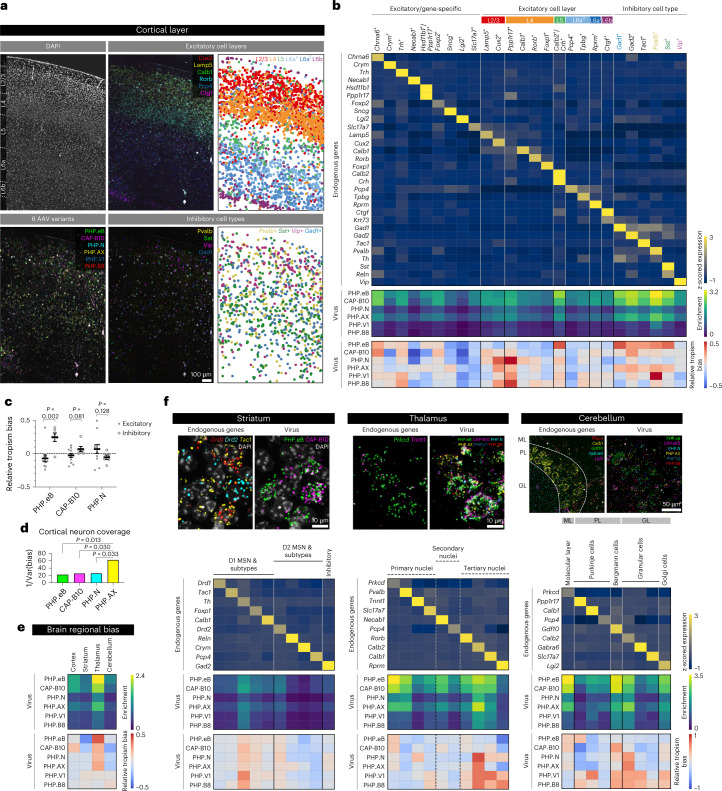
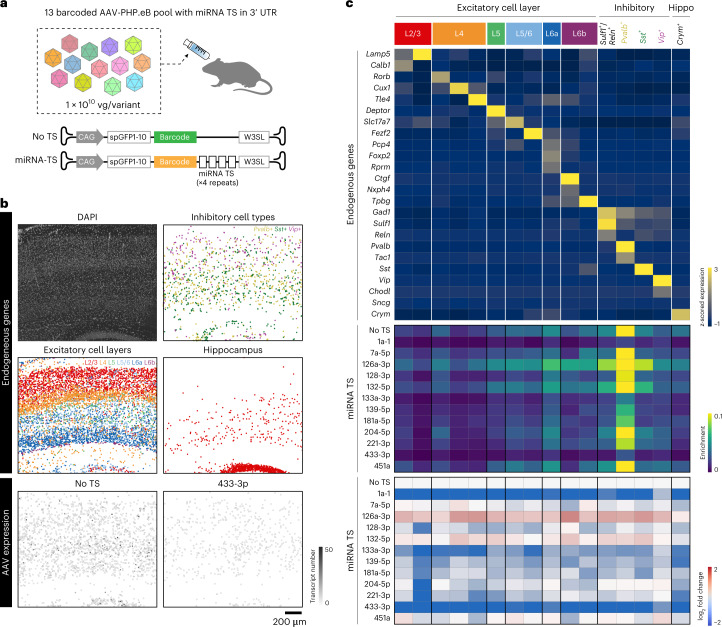
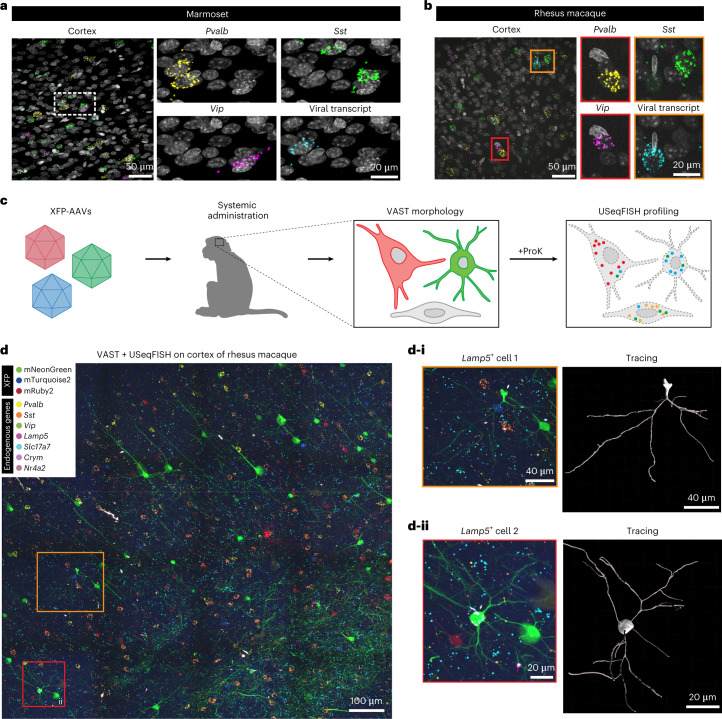
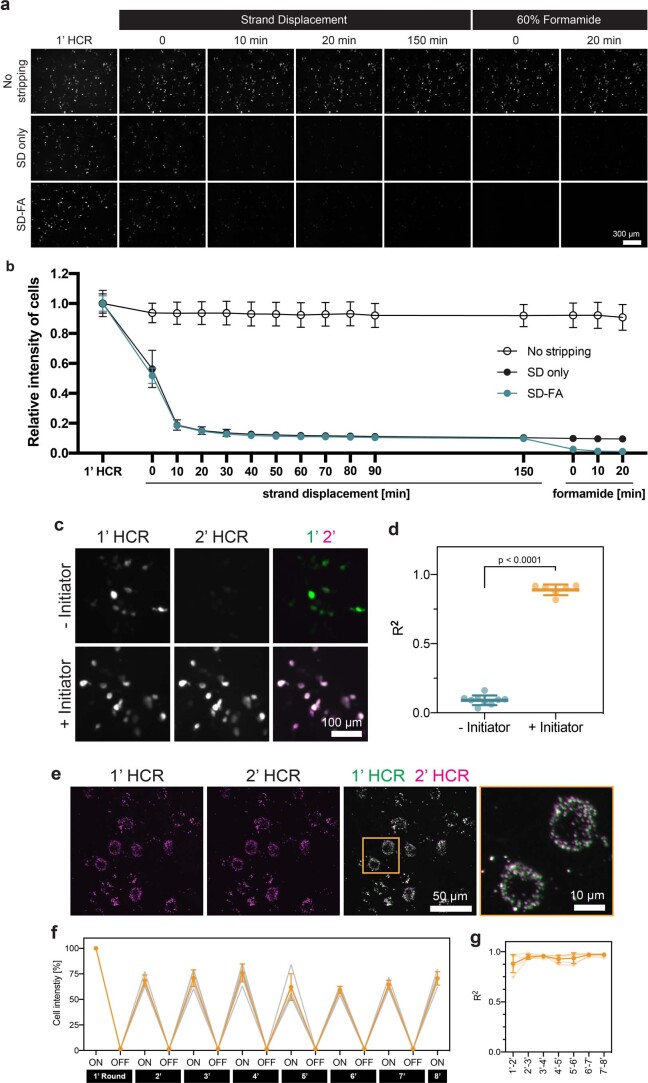
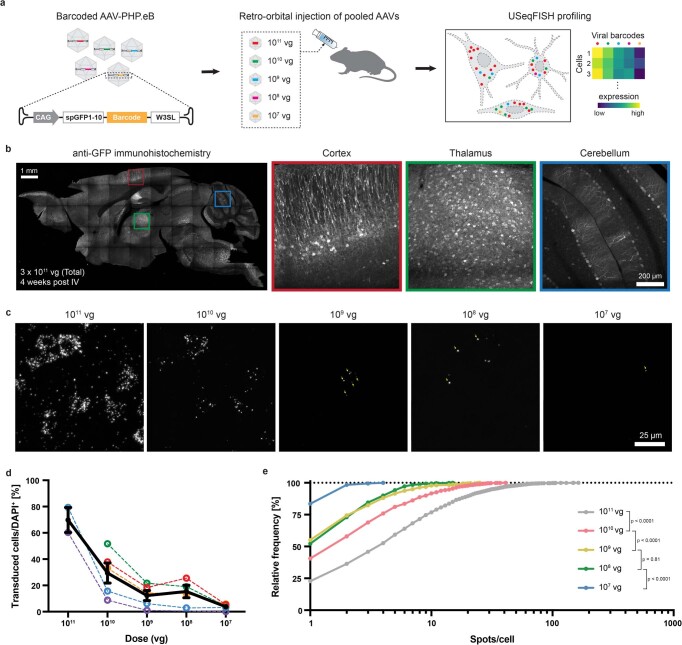
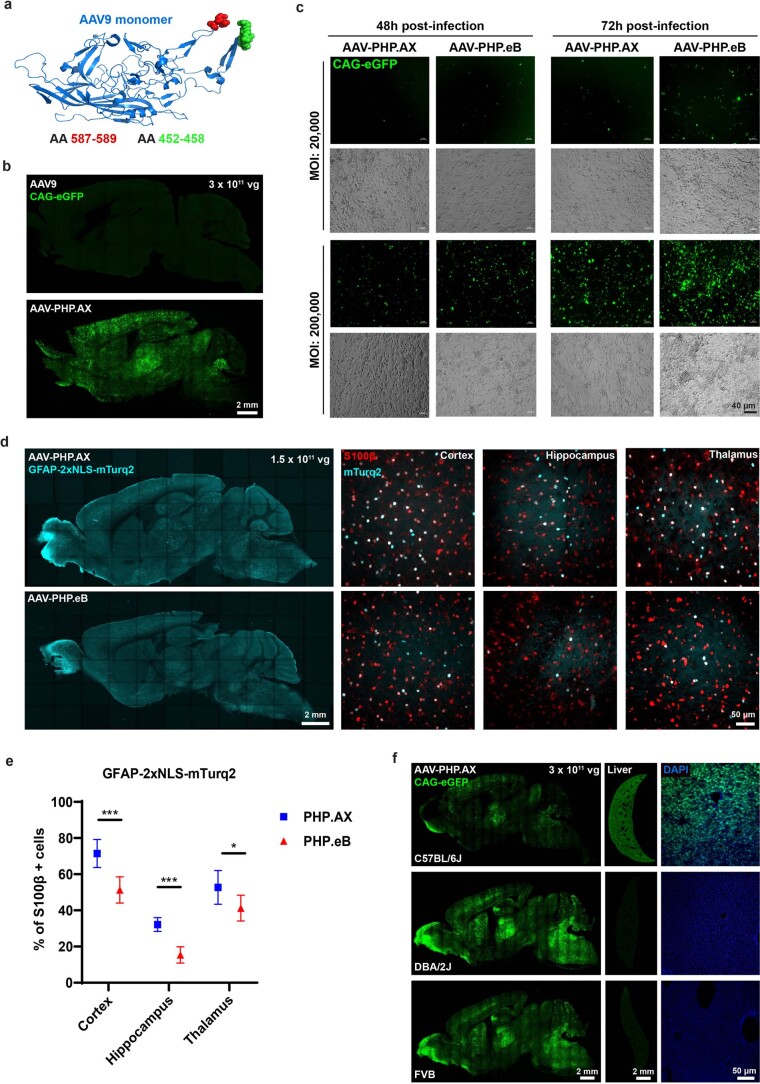
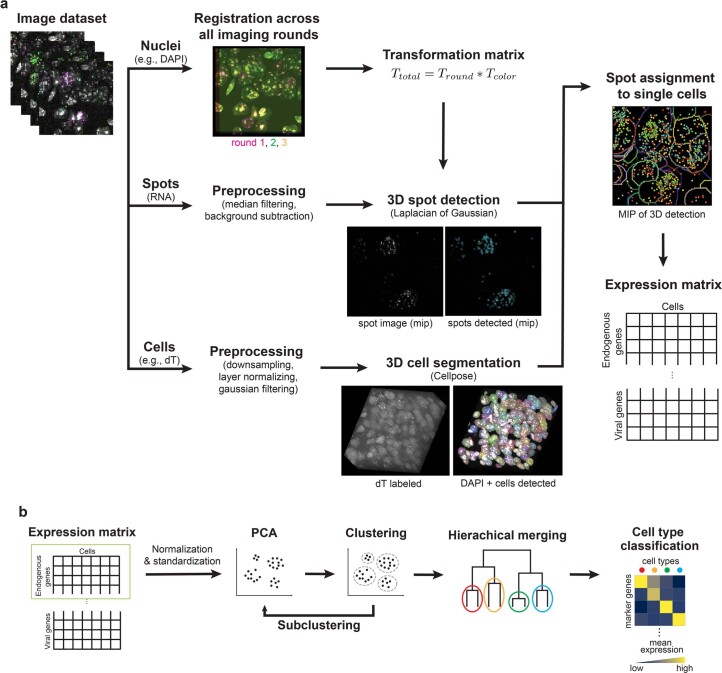
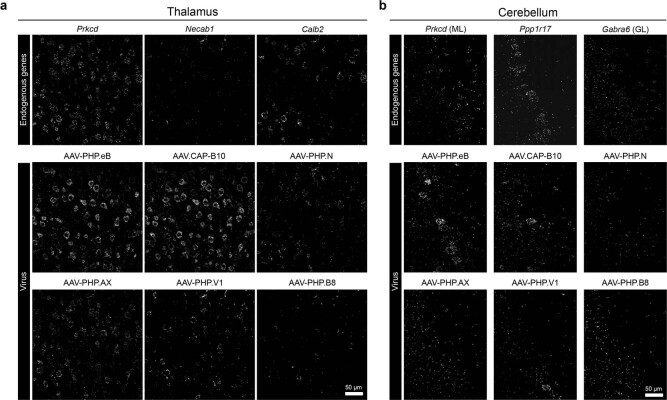
A barrier to advancing engineered adeno-associated viral vectors (AAVs) for precision access to cell subtypes is a lack of high-throughput, high-resolution assays to characterize in vivo transduction profiles. In this study, we developed an ultrasensitive, sequential fluorescence in situ hybridization (USeqFISH) method for spatial transcriptomic profiling of endogenous and viral RNA with a short barcode in intact tissue volumes by integrating hydrogel-based tissue clearing, enhanced signal amplification and multiplexing using sequential labeling. Using USeqFISH, we investigated the transduction and cell subtype tropisms across mouse brain regions of six systemic AAVs, including AAV-PHP.AX, a new variant that transduces robustly and efficiently across neurons and astrocytes. Here we reveal distinct cell subtype biases of each AAV variant, including a bias of AAV-PHP.N toward excitatory neurons. USeqFISH also enables profiling of pooled regulatory cargos, as we show for a 13-variant pool of microRNA target sites in AAV genomes. Lastly, we demonstrate potential applications of USeqFISH for in situ AAV profiling and multimodal single-cell analysis in non-human primates.


Conflict of interest statement

V.G. is a co-founder and board member of Capsida Biotherapeutics, a fully integrated AAV engineering and gene therapy company. The remaining authors declare no competing interests.

Figures

Fig. 1
Fig. 1. USeqFISH for highly sensitive, spatial gene expression profiling in 3D, intact tissue.
a, Schematic procedure of USeqFISH. b, Representative maximum intensity projection image of USeqFISH with six selected genes and a cytosolic marker (dT) in mouse cortex. c, In situ detection of Gad1 with four probes using HCR version 3, RCA (STARmap) and RCAHCR amplification. The same region was imaged twice with 1% and 40% laser power. For HCR, we confirmed its ability to detect RNA by adding more probes (13 probes total). d, Cumulative distribution of RNA signal intensity of HCR-only, RCA-only and RCAHCR amplification. Dashed lines indicate the mean of each distribution (a.u., arbitrary units). e, SBR of HCR-only, RCA-only and RCAHCR amplification (two-sided unpaired t-test with Welch’s correction). f, Comparison of smHCR and subsequent 1-probe RCAHCR with four housekeeping genes (Gapdh, Eef2, Tfrc and Polr2a) in the same NIH3T3 cells. g, The quantification of spots per cell detected by smHCR and subsequent 1-probe RCAHCR. The Pearson correlation coefficient (r) of four genes was 0.9453. h, The slope of each gene in g. i, Comparison of RCAHCR penetration without (‘RCAHCR’) and with RNA-retained PACT clearing (‘PACT-RCAHCR’) in 50-µm-thick brain tissue. We labeled three genes (Pvalb: green, Sst: yellow and Vip: magenta) with three orthogonal hairpin pairs in the same tissue. j, Comparison of Gad1 spot numbers per cell detected with HCR (gray; n = 2,322 cells) and with USeqFISH (orange; n = 3,403 cells; two-sided unpaired t-test with Welch’s correction). k, Comparison of the expression level of 26 endogenous genes (Supplementary Table 1) measured as mean spot numbers per cell with USeqFISH and mean UMI counts per cell with scRNA-seq (r: Pearson correlation coefficient; P: P value). The dashed line indicates x = y. l, Comparison of Gad2 spot numbers per cell detected with USeqFISH at round 2 and round 13 in the same tissue. Each spot indicates the same cell. The dashed line indicates linear regression.
Fig. 2
Fig. 2. High sensitivity of USeqFISH detects short mutations and barcodes in the AAV genome in vitro and in vivo.
a, Three plasmids were designed to carry the VP3 of AAV9, AAV-PHP.eB (‘PHP.eB’) and AAV-PHP.S (‘PHP.S’) with eGFP. AAV-PHP.eB and AAV-PHP.S have distinct 9-AA and 7-AA mutations (bold letters) in the same location (AA588) of the AAV9 VP3 sequence. After transfecting into HEK293T cells, we detected the transcripts of each plasmid using the following probes (gray filled boxes indicate the padlock target sequence, and gray outlined boxes indicate the primer target sequence): four probes against the shared VP3 sequence, one probe against the insertion of AAV-PHP.eB and one probe against the insertion of AAV-PHP.S. For the probes against each insertion, we used the same primers for AAV-PHP.eB and AAV-PHP.S but distinct padlocks that differed by 14 nt. b, Detection of the VP3 transcripts with four probes for VP3, one probe for AAV-PHP.eB and one probe for AAV-PHP.S in HEK293T cells expressing the VP3 of AAV9, AAV-PHP.eB and AAV-PHP.S. c, For in vivo detection, we designed a viral genome carrying mNeonGreen and a barcode and systemically delivered it to adult mice using AAV-PHP.eB at a dose of 1 × 1011 vg per mouse. At 3 weeks after injection, we used USeqFISH with probes against the barcode to detect viral transcripts in tissue. d, Detection of viral barcodes (‘Barcode (mRNA)’) in cells expressing mNeonGreen (green) in various mouse brain regions (cortex, striatum and thalamus).
Fig. 3
Fig. 3. In situ major cell type tropism profiling of barcoded systemic AAV capsid pools in mouse cortex.
a, Experimental pipeline. We designed a pool of six AAV capsid variants carrying unique barcodes and administered them to adult wild-type mice through retro-orbital injection. At 4 weeks after injection, we harvested the brain tissue and used USeqFISH to profile viral gene expression along with endogenous cell type marker genes. The image dataset was then converted to a gene-by-cell expression matrix via our automated image processing pipeline, and we quantitatively analyzed the data by clustering endogenous genes to identify cell type clusters, followed by viral gene expression profiling in each cluster. b, Representative image of six variants and ten cell type markers in the same region of the mouse cortex. c, Transduction efficiency, measured by % transduced cells, of each variant in two mice (mean ± s.e.m.; n = 5 for mouse 1; n = 6 for mouse 2). d, Endogenous (top, cividis color map) and viral gene expression profiles (enrichment: middle, viridis; relative tropism bias: bottom, coolwarm) in the cell type clusters.
Fig. 4
Fig. 4. Neuronal subtype tropism profiling of systemic AAVs in mouse cortical layers and other brain regions.
a, Labeling of the cortex region by DAPI and the six AAV variants. For excitatory cell layers and inhibitory subtypes, the left and middle panels show the real RNA images of selected genes acquired from the experiment, and the right panels show the cell types inferred from clustering based on endogenous gene expression. b, Endogenous (top, cividis color map) and viral gene expression profiles (enrichment: middle, viridis; relative tropism bias: bottom, coolwarm) across the cell type clusters identified. Colored cell types are visualized in a. c, The relative tropism bias of AAV-PHP.eB, AAV.CAP-B10 and AAV-PHP.N across the group of excitatory neurons (total 11 clusters) and inhibitory neurons (total six clusters; mean ± s.e.m.; two-sided unpaired t-test). d, The cortical neuron coverage of efficient variants (AAV-PHP.eB, AAV.CAP-B10, AAV-PHP.N and AAV-PHP.AX) measured by the inverse variance of relative tropism bias (the coolwarm heat map in b) across all cell type clusters (F-test on variance). We omitted AAV-PHP.V1 and AAV-PHP.B8 from this analysis as their transduction efficiency is too low to be considered for overall neuronal transduction. e, Viral expression profiles across selected mouse brain regions (cortex, striatum, thalamus and cerebellum). We separated the endogenous gene expression matrix into the fields of view of each region and used this profile to identify the regional bias of the variants. f, Endogenous and viral gene expression profiles in cell type clusters identified in the striatum, thalamus and cerebellum. We selected ten genes for striatum, ten for thalamus and nine for cerebellum that have been shown to be enriched in each region and classified cells into the clusters represented by each gene. Based on their Ward distance dendrogram, we manually merged clusters into known subtypes. Unlike the striatum and cerebellum, which are composed of genetically distinct cell types, the thalamus has relatively gradual variation in gene expression across topographical nuclei; therefore, we separated cells into three putative groups (marked by dashed lines).
Fig. 5
Fig. 5. USeqFISH profiling of pooled microRNA target sites in the AAV genome across neuronal subtypes in mouse cortical layers.
a, A pool of 13 variants (12 miRNA TSs in the 3′ UTR of the AAV genome and one control, ‘No TS’) was designed, packaged in AAV-PHP.eB and IV delivered to mice. We applied USeqFISH to the brain tissue harvested after 4 weeks of expression. b, Labeling of the cortex region by DAPI and the spatial location of cell types identified from clustering analysis based on endogenous gene expression. Two representative images of transgene expression (‘No TS’ and ‘433-3p’) are shown at the bottom. c, Endogenous (top, cividis color map) and viral gene expression profiles (enrichment: middle, viridis; log2 fold change: bottom, coolwarm) across the cell type clusters identified. We identified 16 total clusters, including two L2/3 (red), three L4 (orange), one L5 (green), two L5/6 (sky blue), one L6a (blue), two L6b (purple), four inhibitory and one hippocampal neuron. Colored cell types are visualized in b.
Fig. 6
Fig. 6. USeqFISH application to NHPs: in situ AAV detection and integrative analysis of cell morphology and transcriptional profiles.
a,b, We applied USeqFISH to brain tissue slices of marmoset (a) and rhesus macaque (b) to which our viruses were administered (eight pooled variants for the marmoset and AAV.CAP-Mac for the rhesus macaque) with probes against three endogenous genes (yellow: Pvalb; green: Sst; magenta: Vip) and the coding sequence of each viral genome (human frataxin for the marmoset and mNeonGreen for the rhesus macaque (cyan); FPs were quenched by proteinase K (ProK) treatment). The representative images show that USeqFISH is applicable to these two NHP species with species-specific probes. c, Schematic of procedure of vector-assisted spectral tracing (VAST) and subsequent USeqFISH profiling of the rhesus macaque brain. We systemically delivered a cocktail of three AAV.CAP-Mac viruses packaging mNeonGreen, mTurquoise2 or mRuby2 to an infant rhesus macaque and recovered the brain. This brain exhibited a variety of colors, coming from stochastic expression of the three FPs, allowing us to trace single-cell morphologies. We additionally labeled seven endogenous genes (Pvalb, Sst, Vip, Lamp5, Slc17a7, Crym and Nr4a2) using USeqFISH in the same tissue to identify transcriptionally defined cell types and their morphology. d, Representative image of integration of VAST and USeqFISH with seven cell marker genes in the rhesus macaque brain and examples of two cells (yellow outlined box: i; red outlined box: ii) identifying both cell type and morphology.
Extended Data Fig. 1
Extended Data Fig. 1. Further characterization of RCAHCR amplification.
a, Representative images of Gad1 in mouse brain tissue detected by HCR, RCA for 2 hours (RCA 2 h), RCA overnight, and RCAHCR. The intensity of each image was adjusted for better visualization. b, Quantification of spot sizes automatically detected by Imaris in each condition (n = 74,292 (HCR), 10,744 (RCA 2 h), 11,608 (RCA overnight), 24,798 spots (RCAHCR); ****p < 0.0001, two-sided Mann-Whitney test). c, Representative images of Gad1 in mouse brain tissue detected by RCA 2 h, RCA overnight, and RCAHCR. The intensity range of all images was matched to show the different brightness of the signal. d, Cumulative distribution of RNA spot intensity of RCA 2 h, RCA overnight, and RCAHCR. Dashed lines indicate the mean of each distribution (****p < 0.0001, Kolmogorov-Smirnov test). e, The false-positive detection of RCAHCR in cell culture (left) and in tissue (right).
Extended Data Fig. 2
Extended Data Fig. 2. Further characterization of 1-probe RCAHCR.
a, Representative images of three house keeping genes (Gapdh, Tfrc, and Polr2a) detected by smFISH and 1-probe RCAHCR in different NIH3T3 cells. b, Quantification of Gapdh spots/cells detected by smFISH and 1-probe RCAHCR (two-sided unpaired t-test). c, Representative images of Gapdh spots sequentially detected by 1st smFISH, 2nd smFISH, and 1-probe RCAHCR in the same NIH3T3 cells. The probe stripping was performed by DNase I treatment (0.5 U/µl). Note that the probe used for 1-probe RCAHCR is the same as in a. d, Quantification of 1st and 2nd smFISH spots in the same cells. The slope estimated from linear regression was 0.9671, and the Pearson correlation coefficient (r) was 0.9712. e, Representative images of Gad1, Pvalb, Sst, and Pcp4 genes detected by 1-probe RCAHCR in mouse brain tissue.
Extended Data Fig. 3
Extended Data Fig. 3. Validation of two-step stripping method.
a, Representative images of the RNA signals of the barcode transfected into HEK293T cells and detected by RCAHCR (1’ HCR). Following 1’ HCR, we divided the samples into three groups: (1) no stripping, (2) only hairpin disassembly via strand displacement (SD only) and (3) hairpin disassembly via strand displacement and initiator detachment via formamide treatment (SD-FA). While proceeding with each step, we time-lapse imaged the samples after hairpin disassembly via strand displacement (‘Strand Displacement’), followed by initiator detachment with formamide (‘60% formamide’). b, Relative cell intensity of no-stripping, SD-only, and SD-FA samples in a after each step (n = 3; mean ± s.d.). c, Representative images of the RNA signals from the barcode after the first (1’ HCR) and second round of HCR (2’ HCR) with the same initiators and hairpins (+Initiator) or only the hairpins (-Initiator). d, The coefficient of determination (R2) between 1’ HCR and 2’ HCR in c (mean ± s.d.; two-sided unpaired t-test; n = 9 for ‘-Initiator’; n = 6 for ‘+Initiator’). e, In situ labeling of Gad1 with RCAHCR amplification in mouse cortex (1’ HCR) and re-detection (2’ HCR) after two-step stripping. f, Relative cell intensity over eight rounds of the same barcode detection (used in a) in cell culture (n = 5; mean ± s.d.). g, The coefficient of determination (R2) between each round during the eight rounds of repeated labeling in f (n = 5; mean ± s.d.).
Extended Data Fig. 4
Extended Data Fig. 4. In situ dose-dependent transduction profiling of barcoded AAV pools with USeqFISH.
a, Schematic of experimental design. A pool composed of AAV-PHP.eB carrying the viral genome with five unique barcodes was delivered at different doses (1011, 1010, 109, 108 and 107 vg for each barcode per animal). After delivering the pool to mice via retro-orbital injection, USeqFISH was applied to the harvested brain tissue to detect the barcodes of each variant in parallel. b, Immunohistochemistry (IHC) with GFP antibodies, labeling spGFP(1–10) used as the coding sequence of the barcoded viral genome, showed broad expression of the injected pool across brain regions, including the cortex (red outlined box), thalamus (green outlined box), and cerebellum (blue outlined box). c, Representative images of the expression of the 5-dose pool. Viral transcript spots are indicated with yellow arrows in the images of lower doses (109, 108, and 107 vg). d, The transduction rate of AAV-PHP.eB at each dose acquired from five mice (indicated by different colors; the mean of each dose is indicated by the black line; mean ± s.e.m.). e, The cumulative distribution of viral RNA spot number in each transduced cell at each dose (Kolmogorov-Smirnov test).
Extended Data Fig. 5
Extended Data Fig. 5. AAV-PHP.AX characterization following single injection in mouse brain.
a, AAV-PHP.AX was engineered by substituting a 7-amino acid (AA) sequence of a glial homing peptide (green), at AA452-458 of AAV-PHP.eB (9-AA peptide shown in red). b, AAV9 and AAV-PHP.AX (each packaging a single-stranded CAG-eGFP genome) were delivered by retro-orbital injection to 8-week-old C57BL/6 J male mice (n ≥ 3 per group) at 3 × 1011 vg/mouse. Transgene expression was evaluated three weeks later. c, Representative images of human U87 glioblastoma (astrocyte-like) cells transduced by AAV-PHP.AX or AAV-PHP.eB, packaging CAG-eGFP, 48 or 72 hours post-infection (n ≥ 3 wells per condition). d, e, AAV-PHP.AX transduces astrocytes more efficiently than AAV-PHP.eB when paired with an astrocytic promoter. AAV:GFAP-2xNLS (nuclear localization signal)-mTurq2 was delivered by retro-orbital injection to 8-week-old C57BL/6 J male mice (n = 3 per group) at 1.5 × 1011 vg/mouse. Transgene expression was evaluated three weeks later. d, Brain sections were stained with the astrocyte marker S100β (red). Representative images of the cortex, hippocampus, and thalamus are shown. e, Quantification of the percentage of S100β + cells transduced by AAV-PHP.AX and AAV-PHP.eB (mean ± SD; two-way ANOVA, Tukey’s multiple comparisons test with adjusted p values; ***p = 0.0001 for cortex; ***p = 0.0006 for hippocampus; *p = 0.0217 for thalamus). f, AAV-PHP.AX efficiently transduces the brain after intravenous administration to C57BL/6 J, DBA2/J, and FVB mice. AAV-PHP.AX:CAG-2xNLS-eGFP was delivered by retro-orbital injection to 8-week-old male mice (n ≥ 5 per group) at 3 × 1011 vg/mouse. Transgene expression was evaluated three weeks later. Representative images of the brain and liver are shown. DAPI staining for nuclei is shown in blue.
Extended Data Fig. 6
Extended Data Fig. 6. Automated 3D image processing and quantitative data analysis pipeline for USeqFISH.
a, A collection of volume imaging data for each USeqFISH experiment consists of nuclei labeling and RNA spots for each round and cytosolic labeling for the last round. Using the nuclei labeling for each round, we calculated the rigid transformation matrix to the last image for registration across imaging rounds. We combined this transformation matrix with one for correcting optical aberration obtained with fluorescent microbeads prior to the experiment. For RNA spot detection, we proceeded with smoothing by 3-pixel median filtering and background subtraction for each volume and applied a Laplacian of Gaussian filter to obtain the location of each spot. For cell body segmentation, we pre-processed the dT labeled image and used it to identify single cells by applying Cellpose. These three calculations were then combined to register all volumes into the same coordinates, to assign each spot to each cell, and finally to obtain the cells-by-genes expression matrix. b, The expression matrix of endogenous genes was then normalized and z-standardized and used to cluster cell types with endogenous genes by applying principal component analysis (PCA), followed by Leiden clustering. The viral gene expression profiles were analyzed along the clusters identified (details in Methods and Fig. 3a).
Extended Data Fig. 7
Extended Data Fig. 7. Examples of endogenous and AAV transcripts in mouse thalamus and cerebellum.
Representative RNA images of endogenous cell-type marker genes (Prkcd, Necab1, and Calb2 for thalamus; Prkcd, Ppp1r17, and Gabra6 for cerebellum) and six variants in the same region of the mouse thalamus (a) and cerebellum (b).
Extended Data Fig. 8
Spatial expression pattern of cell marker genes compared to Allen Brain Atlas (a) and miRNA TS pool detected by USeqFISH (b).
Extended Data Fig. 9
Extended Data Fig. 9. USeqFISH validation in NHP tissue.
a, Virally labeled cells, expressing mTurquoise2 (pseudo-colored), in the rhesus macaque brain and USeqFISH labeling with probes targeting the sequence of mTurquoise2. b, We validated our probe design for the rhesus macaque by applying USeqFISH with Pvalb probes and post hoc IHC with Pvalb antibodies to the same tissue. Localization of Pvalb mRNA signal in cells labeled with Pvalb antibodies (the same approach used for mouse probe validation in Supplementary Fig. 3) supports the versatility of our probe design in both rodents and NHPs.

Comment in

References

    1. Nectow AR, Nestler EJ. Viral tools for neuroscience. Nat. Rev. Neurosci. 2020;21:669–681. doi: 10.1038/s41583-020-00382-z. - DOI - PMC - PubMed
    1. Bedbrook CN, Deverman BE, Gradinaru V. Viral strategies for targeting the central and peripheral nervous systems. Annu. Rev. Neurosci. 2018;41:323–348. doi: 10.1146/annurev-neuro-080317-062048. - DOI - PubMed
    1. Zhu D, Schieferecke AJ, Lopez PA, Schaffer DV. Adeno-associated virus vector for central nervous system gene therapy. Trends Mol. Med. 2021;27:524–537. doi: 10.1016/j.molmed.2021.03.010. - DOI - PubMed
    1. Wang D, Tai PWL, Gao G. Adeno-associated virus vector as a platform for gene therapy delivery. Nat. Rev. Drug Discov. 2019;18:358–378. doi: 10.1038/s41573-019-0012-9. - DOI - PMC - PubMed
    1. Deverman BE, et al. Cre-dependent selection yields AAV variants for widespread gene transfer to the adult brain. Nat. Biotechnol. 2016;34:204–209. doi: 10.1038/nbt.3440. - DOI - PMC - PubMed

Publication types