Clinical Trial
. 2023 Feb;29(2):458-466.
doi: 10.1038/s41591-022-02181-8. Epub 2023 Jan 26.

Combined PD-1, BRAF and MEK inhibition in BRAFV600E colorectal cancer: a phase 2 trial

Affiliations
Clinical Trial

Combined PD-1, BRAF and MEK inhibition in BRAFV600E colorectal cancer: a phase 2 trial

Jun Tian et al. Nat Med. 2023 Feb.

Abstract

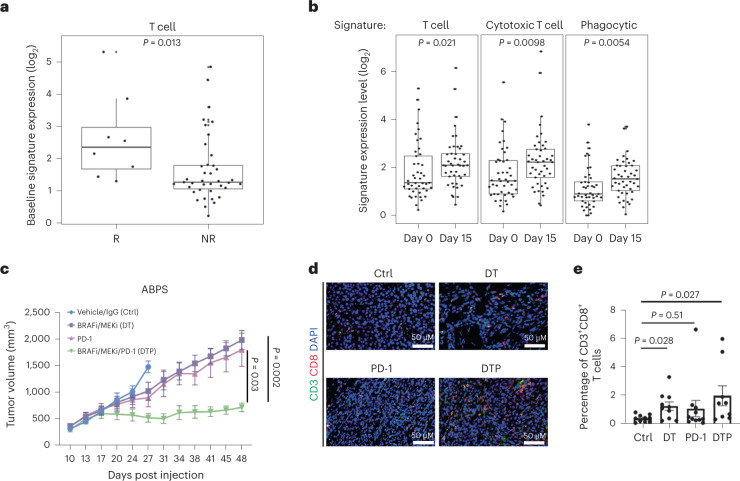
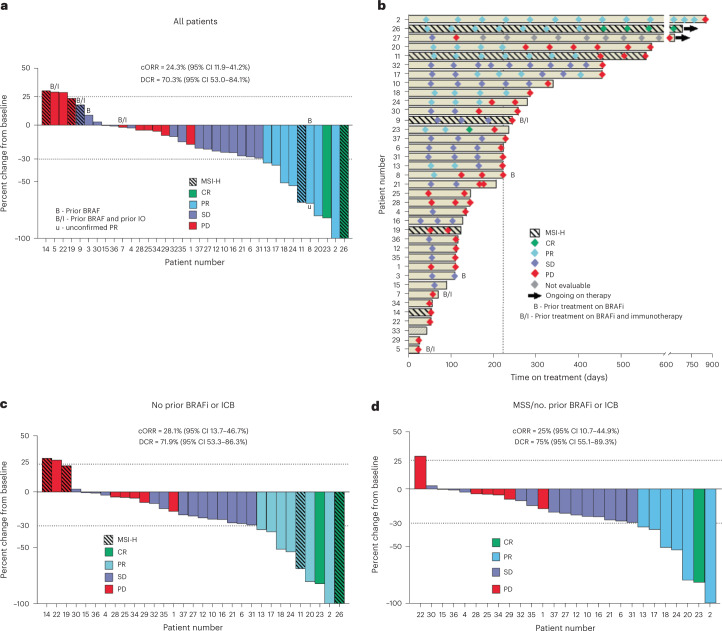
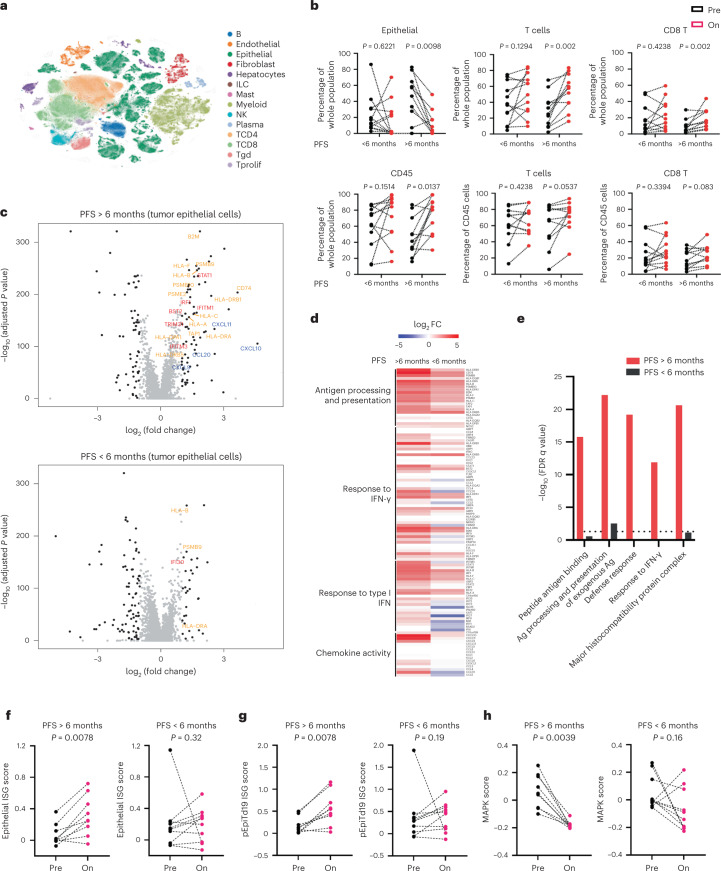
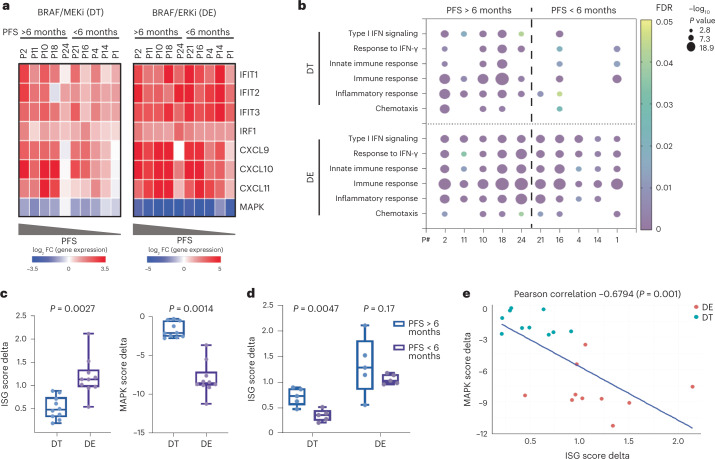
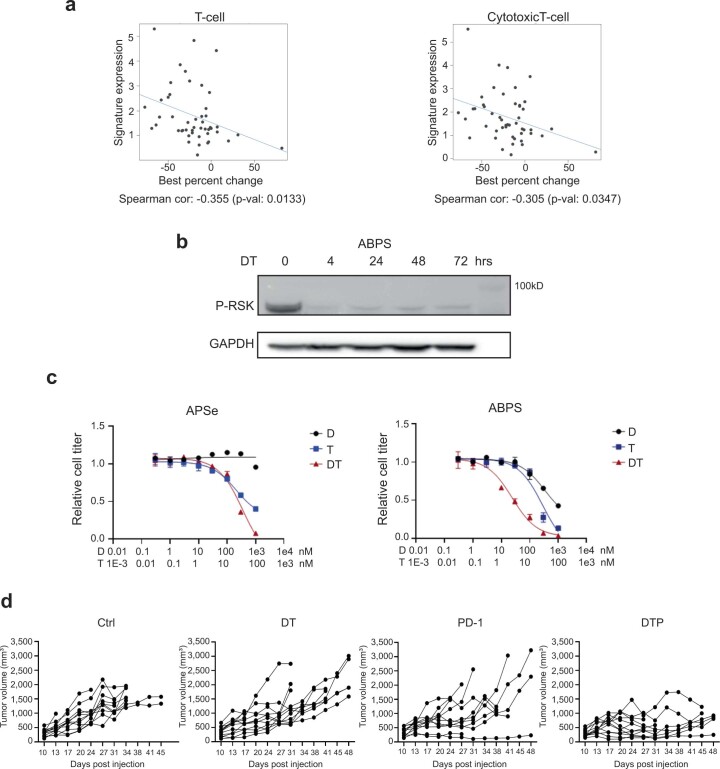
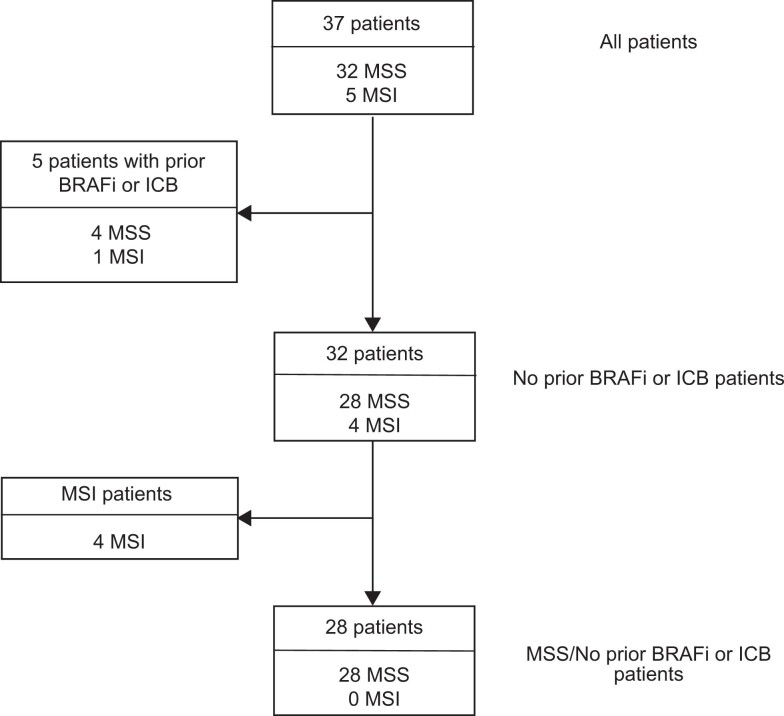
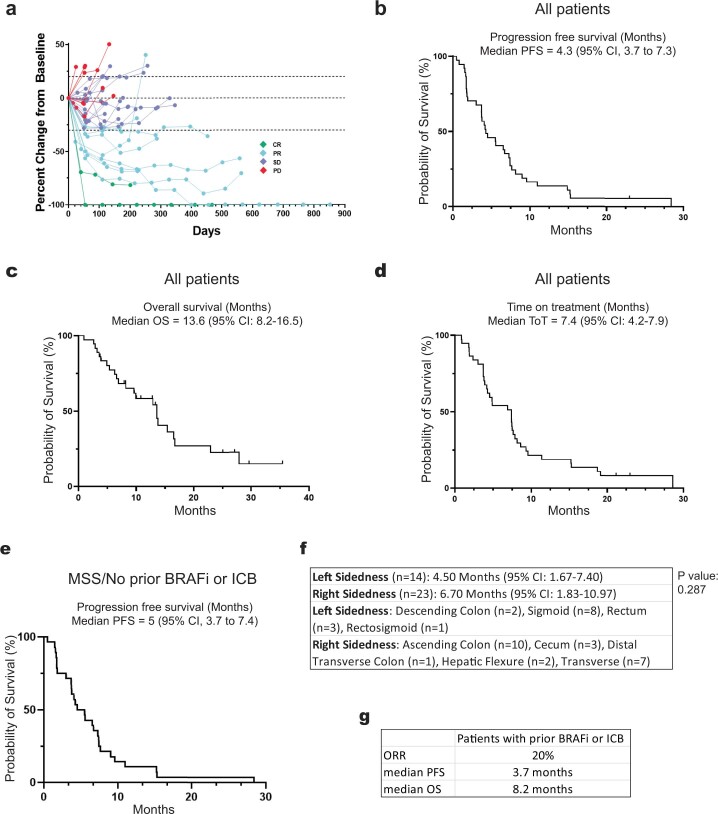
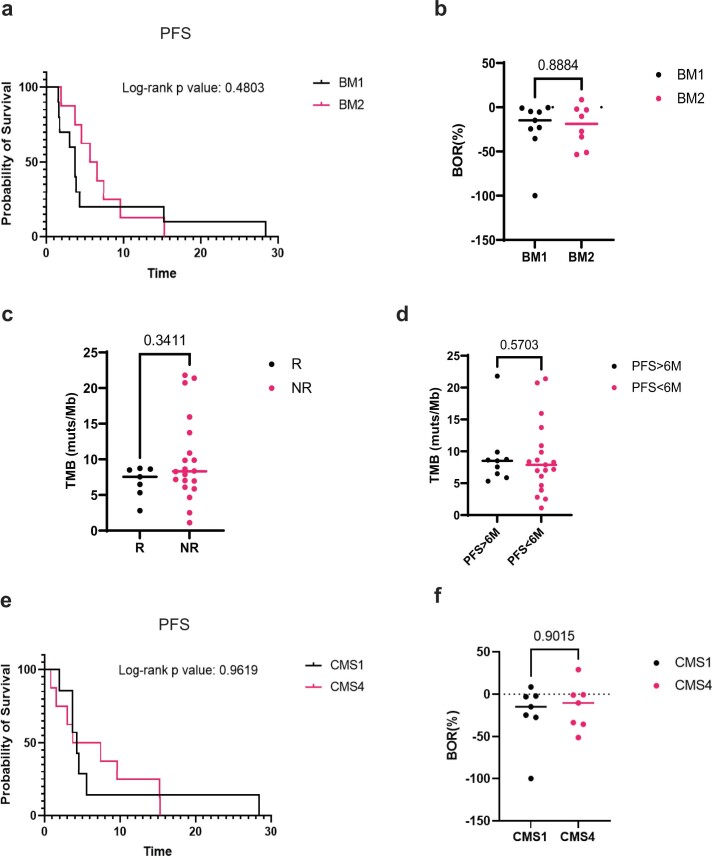
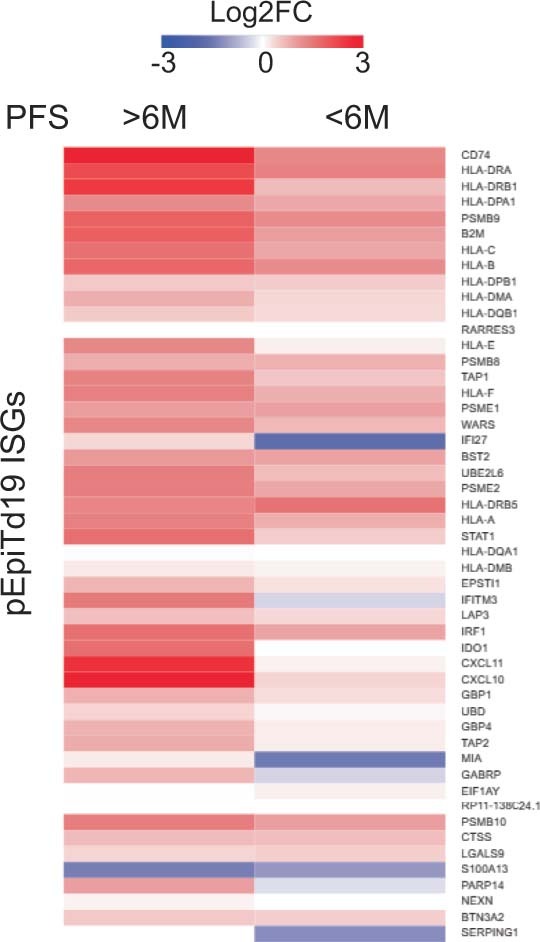
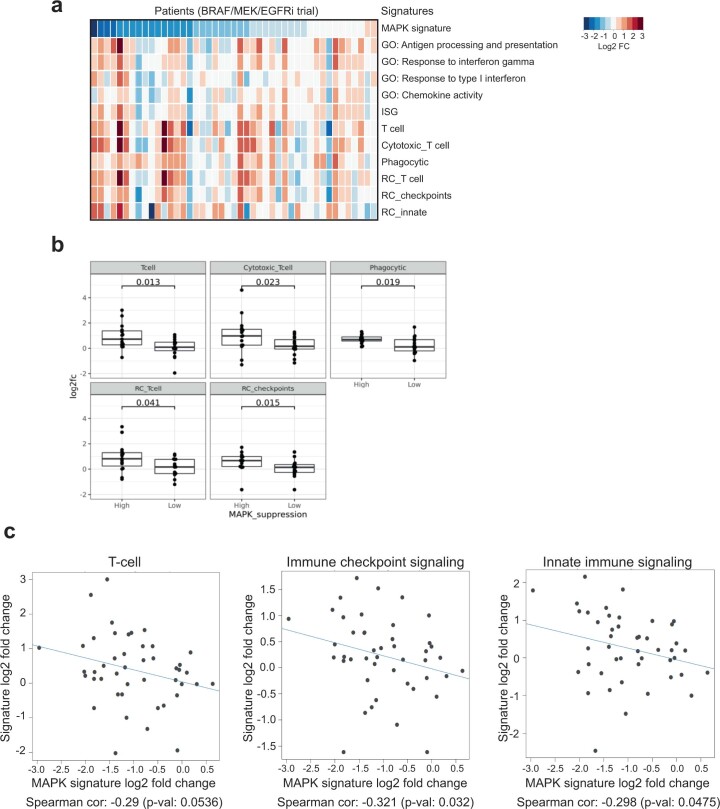
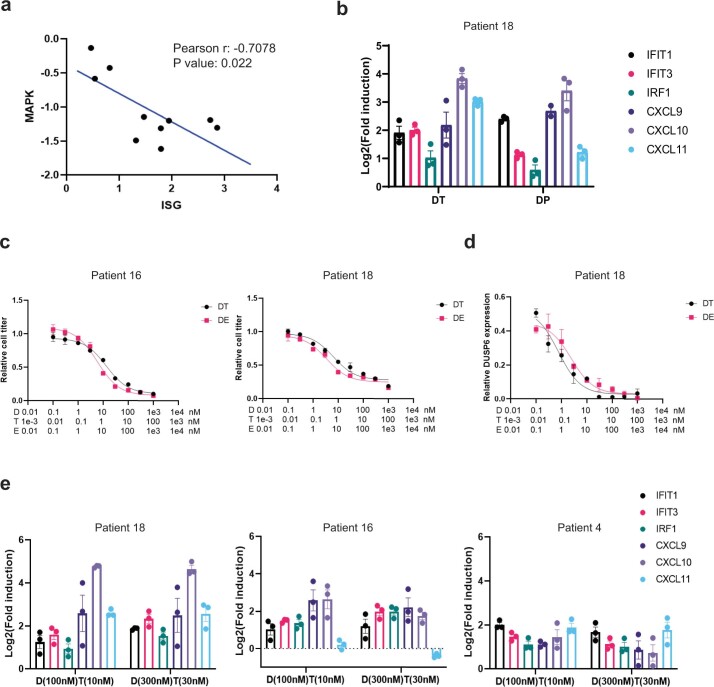
While BRAF inhibitor combinations with EGFR and/or MEK inhibitors have improved clinical efficacy in BRAFV600E colorectal cancer (CRC), response rates remain low and lack durability. Preclinical data suggest that BRAF/MAPK pathway inhibition may augment the tumor immune response. We performed a proof-of-concept single-arm phase 2 clinical trial of combined PD-1, BRAF and MEK inhibition with sparatlizumab (PDR001), dabrafenib and trametinib in 37 patients with BRAFV600E CRC. The primary end point was overall response rate, and the secondary end points were progression-free survival, disease control rate, duration of response and overall survival. The study met its primary end point with a confirmed response rate (24.3% in all patients; 25% in microsatellite stable patients) and durability that were favorable relative to historical controls of BRAF-targeted combinations alone. Single-cell RNA sequencing of 23 paired pretreatment and day 15 on-treatment tumor biopsies revealed greater induction of tumor cell-intrinsic immune programs and more complete MAPK inhibition in patients with better clinical outcome. Immune program induction in matched patient-derived organoids correlated with the degree of MAPK inhibition. These data suggest a potential tumor cell-intrinsic mechanism of cooperativity between MAPK inhibition and immune response, warranting further clinical evaluation of optimized targeted and immune combinations in CRC. ClinicalTrials.gov registration: NCT03668431.


Conflict of interest statement

S.X.C. is an employee of Google Ventures. M.G. receives research funding from Servier and Janssen. A.M. has served a consultant/advisory role for Third Rock Ventures, Asher Biotherapeutics, Abata Therapeutics, Flare Therapeutics, venBio Partners, BioNTech, Rheos Medicines and Checkmate Pharmaceuticals; is an equity holder in Asher Biotherapeutics and Abata ThPerapeutics; and has a sponsored research agreement with Bristol Myers Squibb and Olink Proteomics. P.C.E. is/has been a consultant and has received honoraria from ALX Oncology, Arcus Bioscience, Astellas, AstraZeneca, Blueprint Medicines, Chimeric Therapeutics, Celgene, Coherus, Daiichi-Sankyo, Five Prime, Ideaya, Istari, Legend, Lilly, Loxo, Merck, Novartis, Ono, Servier, Taiho, Takeda, Turning Point Therapeutics, Xencor and Zymeworks. S.J.K. has served a consultant/advisory role for Astellas, Merck, Bristol Myers Squibb, Daiichi-Sankyo, Pieris, AstraZeneca, Natera, Eli Lilly, Mersana and Sanofi-Aventis. S.J.K. owns stock in Turning Point Therapeutics. J.A.M. has served as an advisor/consultant to Merck Pharmaceutical and COTA Healthcare. M.B.Y. receives research funding from Janssen Pharmaceuticals. C.D.C. is an employee and shareholder of Novartis. N.H. receives research funding from Bristol Myers Squibb, has equity in BioNTech and advises and has equity in Related Sciences/Danger Bio. R.B.C. has received consulting or speaking fees from Abbvie, Amgen, Array Biopharma/Pfizer, Asana Biosciences, Astex Pharmaceuticals, AstraZeneca, Avidity Biosciences, BMS, C4 Therapeutics, Chugai, Cogent Biosciences, Elicio, Erasca, Fog Pharma, Genentech, Guardant Health, Ipsen, Kinnate Biopharma, LOXO, Merrimack, Mirati Therapeutics, Natera, Navire, Nested Therapeutics, N-of-one/Qiagen, Novartis, nRichDx, Remix Therapeutics, Revolution Medicines, Roche, Roivant, Shionogi, Shire, Spectrum Pharmaceuticals, Symphogen, Syndax, Tango Therapeutics, Taiho, Theonys, Warp Drive Bio and Zikani Therapeutics; holds equity in Avidity Biosciences, C4 Therapeutics, Cogent Biosciences, Erasca, Kinnate Biopharma, Interline Therapeutics, Nested Therapeutics, nRichDx, Remix Therapeutics, Revolution Medicines and Theonys; is a cofounder, equity holder and board member of Alterome Therapeutics; and has received research funding from Asana, AstraZeneca, Lilly, Novartis and Pfizer. The remaining authors declare no competing interests.

Figures

Fig. 1
Fig. 1. MAPK pathway inhibition enhances immune response in BRAFV600E CRC.
a, Tumor baseline T cell signature expression levels in confirmed responders (R) (n = 8) and nonresponders (NR) (n = 39) from a clinical trial of dabrafenib/trametinib/panitumumab in patients with BRAFV600E CRC (DTP treatment arm only, two-tailed Wilcoxon rank sum tests). b, Levels of immune signatures (T cell, cytotoxic T cell and phagocytic) in 45 paired day 1 and day 15 biopsies from a clinical trial of dabrafenib/trametinib/panitumumab (all DTP, DP and TP treatment arms, two-tailed Wilcoxon rank sum tests). a,b, The box plots show the median, first and third quartiles (Q1 and Q3) (25th and 75th percentiles) of the data. The upper and lower whiskers extend to the minimum and maximum values no further than 1.5× the interquartile range, respectively; outliers are plotted individually. c, Tumor volume of C57BL/6 mice bearing ABPS tumors treated with vehicle/immunoglobulin G control (n = 11), DT (n = 12), PD-1 (n = 11) and DTP (n = 12; two-tailed Wilcoxon rank sum test, data are presented as mean values ± s.e.m.). d, Representative images of CD3+CD8+ T cells in ABPS tumors. e, Percentage of CD3+CD8+ T cells in ABPS tumors across the groups control (n = 10), DT (n = 10), PD-1 (n = 11) and DTP (n = 9; two-tailed Wilcoxon rank sum test, error bars represent s.e.m.). Ctrl, control; DTP, dabrafenib/trametinib/panitumumab; DP, dabrafenib/panitumumab; TP, trametinib/panitumumab. Source data
Fig. 2
Fig. 2. Clinical efficacy of dabrafenib, trametinib and PDR001 in patients with BRAFV600E CRC.
a, Best percentage change in the sum of the longest tumor diameters from baseline according to RECIST v.1.1 for patients in the total intention-to-treat cohort. ‘IO’, ‘MSI-H’, ‘SD’, and ‘PD’ denotes immunotherapy, microsatellite instability-high, stable disease, and progressive disease, respectively. b, Swimmer plot presenting the duration of treatment exposure and efficacy assessments in all patients. c, Best percentage change in the sum of the longest tumor diameters from baseline according to RECIST v.1.1 among patients without prior receipt of a BRAFi and/or immunotherapy in the intention-to-treat cohort. d, Best percentage change in the sum of the longest tumor diameters from baseline according to RECIST v.1.1 among patients without prior receipt of a BRAFi and/or immunotherapy and with microsatellite stability in the intention-to-treat cohort.
Fig. 3
Fig. 3. Greater tumor cell-intrinsic immune program induction and MAPK pathway inhibition in patients with better outcome.
a, t-distributed stochastic neighbor embedding plot of 419,551 cells color coded for the indicated cell type. ILC, innate lymphoid cell; NK, natural killer cell; Tgd, gamma-delta T cell; Tprolif, proliferating T cell. b, Percentage of indicated cell types (on- versus pretreatment biopsies) in patients with PFS > 6 months (n = 11) and patients with PFS < 6 months (n = 12; two-tailed Wilcoxon rank sum tests). c, Volcano plots showing upregulated and downregulated DEGs (on treatment versus pretreatment) in tumor epithelial cells of patients with PFS > 6 months and PFS < 6 months. Black dots on the volcano plots indicate adjusted P < 0.05 (two-tailed Wilcoxon rank sum test) and log2FC ≥ 1. Significant DEGs involved in antigen processing and presentation (gold), the IFN pathway (red) and chemokine activity (blue) are labeled. d, log2FC (on treatment versus pretreatment) of expression of ISGs involved in indicated immune pathways in tumor epithelial cells of patients with PFS > 6 months and PFS < 6 months. e, Enriched immune-related Gene Ontology terms in tumor epithelial cells of patients with PFS > 6 months and PFS < 6 months. Dotted line indicates false discovery rate (FDR) = 0.05. ‘Ag’ denotes antigen. fh, Changes of epithelial ISG score (on treatment versus pretreatment) (f), pEpiTd19 ISG score (on treatment versus pretreatment) (g) and MAPK score (on treatment versus pretreatment) (h) in tumor epithelial cells of patients with PFS > 6 months (n = 9) and PFS < 6 months (n = 10; Wilcoxon signed rank test).
Fig. 4
Fig. 4. Enhanced tumor cell-intrinsic immune program induction is driven by optimized MAPK inhibition.
a, The log2FC of gene expression (measured by qPCR) of indicated ISGs and the average of log2FC of MAPK-regulated transcripts in patient-derived organoids treated with DT or DE for 72 h. Organoids are arranged based on the PFS data of patients (from left to right: longest to shortest PFS). b, GO term enrichment analysis of upregulated DEGs (log2FC ≥ 1, P < 0.05, Fisher exact test) in organoids treated with 72-h DT or DE versus control. Gene expression was measured by bulk RNAseq. Organoids are arranged based on patient PFS data. c, Delta of ISG scores (left) and MAPK scores (right; 72-h treatment versus control) in DT-treated (n = 10) and DE-treated (n = 10) organoids (two-tailed Wilcoxon rank sum test). d, Delta of ISG scores (72-h treatment versus control) in organoids derived from patients with PFS > 6 months (n = 5) and PFS < 6 months (n = 5; two-tailed Wilcoxon rank sum test). In c and d, the box plots show the median, Q1 and Q3 (25th and 75th percentiles) of the data; the upper and lower whiskers extend to the minimum and maximum values. e, Pearson correlation (two sided) of ISG score delta and MAPK score delta in all DT- and DE-treated organoids.
Extended Data Fig. 1
Extended Data Fig. 1. Characterization of ABPS cells.
a, Spearman correlation (two-sided) of indicated immune signature levels at baseline and best percentage change from baseline in the size of target lesion from patients in clinical trial of dabrafenib/trametinib/panitumumab (DTP treatment arm only, n = 47). b, ABPS were treated with DT for 4, 24, 48, and 72 hours, and subjected to detection of phospho-RSK levels by WB (n = 3 independent biological experiments). c, APSe (APS cell line infected with retrovirus containing empty vector, used as control) and ABPS cells were treated with various doses of D, T, or DT for 72 hours, and subjected to cell viability assay (n = 3 independent biological experiments, data are presented as mean values +/− SEM). d, Individual growth curve of ABPS tumors across indicated treatment groups.
Extended Data Fig. 2
Extended Data Fig. 2. A consort style diagram of patient cohorts.
a consort style diagram of patient cohorts.
Extended Data Fig. 3
Extended Data Fig. 3. Patient survival outcomes.
a, Best percent change from baseline over time per RECIST v1.1 criteria for patients in the total intention-to-treat cohort. b, Kaplan–Meier estimates of progression-free survival assessed according to RECIST v1.1 for patients in the total intention-to-treat cohort. c, Kaplan–Meier estimates of overall survival assessed according to RECIST v1.1 for patients in the total intention-to-treat cohort. d, Kaplan–Meier estimates of time on treatment assessed according to RECIST v1.1 for patients in the total intention-to-treat cohort. e, Kaplan-Meier estimates of progression-free survival assessed according to RECIST v1.1 for patients without prior receipt of a BRAF inhibitor and/or immunotherapy, and with microsatellite stability in the intention-to-treat cohort. f, difference in PFS by sidedness for patients in the total intention-to-treat cohort (Cox regression test). g, ORR, PFS, and OS information of patients with prior BRAFi or ICB.
Extended Data Fig. 4
Extended Data Fig. 4. Association of baseline tumor characteristics with patient outcomes.
a and b, Association of BM1/BM2 signatures with PFS (a) and best overall response (BOR) (b) in MSS patients (BM1, n = 9; BM2, n = 8; two-tailed Wilcoxon rank sum test). c and d, Association of tumor mutational burden (TMB) at baseline with response (R, n = 7; NR, n = 20; two-tailed Wilcoxon rank sum test) (c) and PFS (PFS > 6M, n = 9; PFS < 6M, n = 19) (d) in MSS patients. e and f, Association of CMS at baseline with PFS (e) and (f) in MSS patients (CMS1, n = 7; CMS4, n = 7; two-tailed Wilcoxon rank sum test).
Extended Data Fig. 5
Extended Data Fig. 5. Expression of ISGs in patient tumor biopsies.
Log2 fold change (on- versus pre-treatment) of expression of top 50 genes from pEpiTd19 ISG program in tumor epithelial cells of patients with PFS > 6 months and < 6 months.
Extended Data Fig. 6
Extended Data Fig. 6. Immune signatures in patients treated with BRAF targeted therapy.
a, Log2 fold change of immune signatures in patients ordered by the degree of MAPK pathway inhibition (left to right: strong to weak inhibition) in previous BRAF/MEK/EGFRi trial (all DTP, DP, TP treatment arms). b, Two-tailed Wilcoxon rank sum test of indicated immune signatures between patients with top and bottom 1/3 in MAPK suppression from BRAF/MEK/EGFRi trial (High, n = 15; Low, n = 15). The box plots show the median and Q1 and Q3 (25th and 75th percentiles) of the data; the upper and lower whiskers extend to the min and max values no further than 1.5× the interquartile range (IQR), respectively; and outliers are plotted individually. c, Spearman correlation (two-sided) of log2 fold change (on- versus pre-treatment) of indicated immune signature levels and log2 fold change (on- versus pre-treatment) of MAPK signature levels in BRAFV600E CRC patients from the BRAF/MEK/EGFRi trial (all treatment arms, n = 45).
Extended Data Fig. 7
Extended Data Fig. 7. Characterization of organoids following BRAF targeted therapy.
a, Pearson correlation (two-sided) of ISGs induction (average of log2FC of ISGs in Fig. 4a) and MAPK pathway inhibition (average of log2FC of DUSP6, ETV4, ETV5, and SPRY4) in DT-treated organoids. b, Log2FC of gene expression (measured by qPCR) of indicated ISGs in organoids (derived from patient 18) treated with DP for 72 hours (n = 3 independent biological experiments, data are presented as mean values +/− SEM). c, Indicated organoids were treated with various doses of DT or DE for 72 hours, and subjected to cell viability assay (n = 3, data are presented as mean values +/− SEM). d, Relative DUSP6 expression in organoid treated with various doses of DT or DE for 6 hours (n = 3, data are presented as mean values +/− SEM). e, ISGs induction in indicated organoids treated with two different doses of DT (n = 3, data are presented as mean values +/− SEM).

Comment in

References

    1. Davies H, et al. Mutations of the BRAF gene in human cancer. Nature. 2002;417:949–954. doi: 10.1038/nature00766. - DOI - PubMed
    1. Richman SD, et al. KRAS and BRAF mutations in advanced colorectal cancer are associated with poor prognosis but do not preclude benefit from oxaliplatin or irinotecan: results from the MRC FOCUS trial. J. Clin. Oncol. 2009;27:5931–5937. doi: 10.1200/JCO.2009.22.4295. - DOI - PubMed
    1. Flaherty KT, et al. Inhibition of mutated, activated BRAF in metastatic melanoma. N. Engl. J. Med. 2010;363:809–819. doi: 10.1056/NEJMoa1002011. - DOI - PMC - PubMed
    1. Falchook GS, et al. Dabrafenib in patients with melanoma, untreated brain metastases, and other solid tumours: a phase 1 dose-escalation trial. Lancet. 2012;379:1893–1901. doi: 10.1016/S0140-6736(12)60398-5. - DOI - PMC - PubMed
    1. Kopetz S, et al. Phase II pilot study of vemurafenib in patients with metastatic BRAF-mutated colorectal cancer. J. Clin. Oncol. 2015;33:4032–4038. doi: 10.1200/JCO.2015.63.2497. - DOI - PMC - PubMed

Publication types

MeSH terms

Associated data