. 2023 Mar;24(3):439-451.
doi: 10.1038/s41590-022-01418-5. Epub 2023 Jan 26.

Dermal macrophages set pain sensitivity by modulating the amount of tissue NGF through an SNX25-Nrf2 pathway

Affiliations

Dermal macrophages set pain sensitivity by modulating the amount of tissue NGF through an SNX25-Nrf2 pathway

Tatsuhide Tanaka et al. Nat Immunol. 2023 Mar.

Abstract

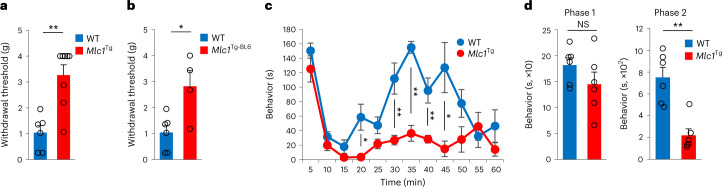
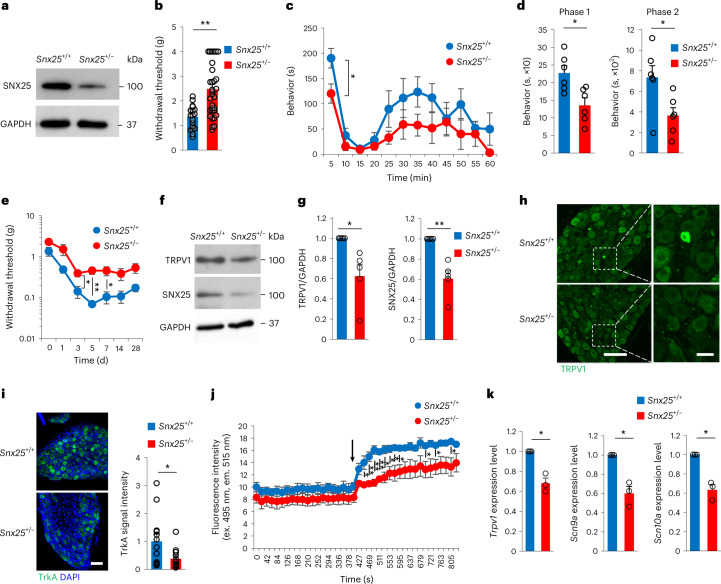
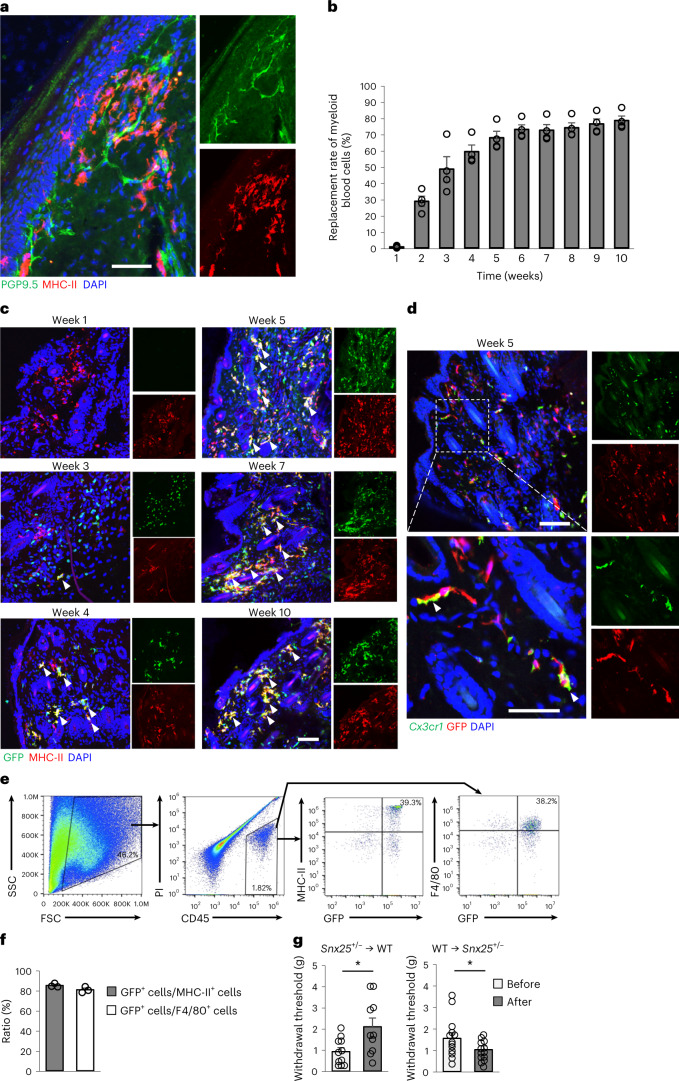
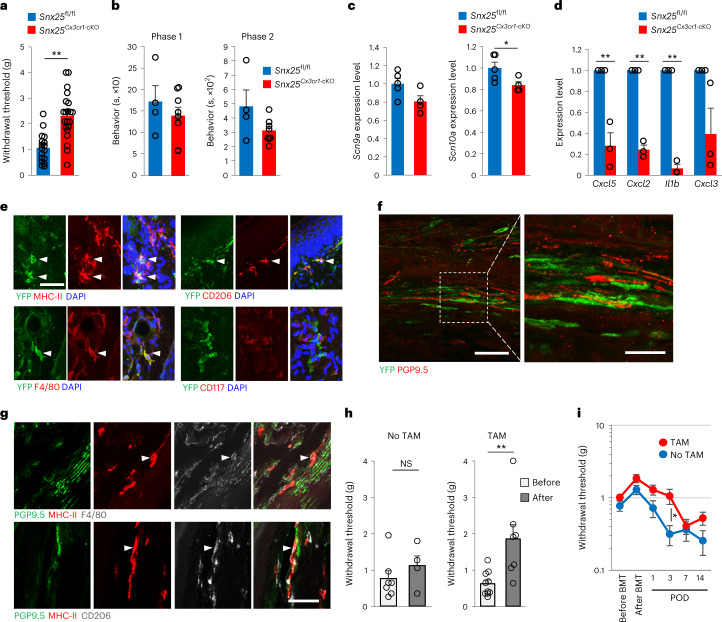
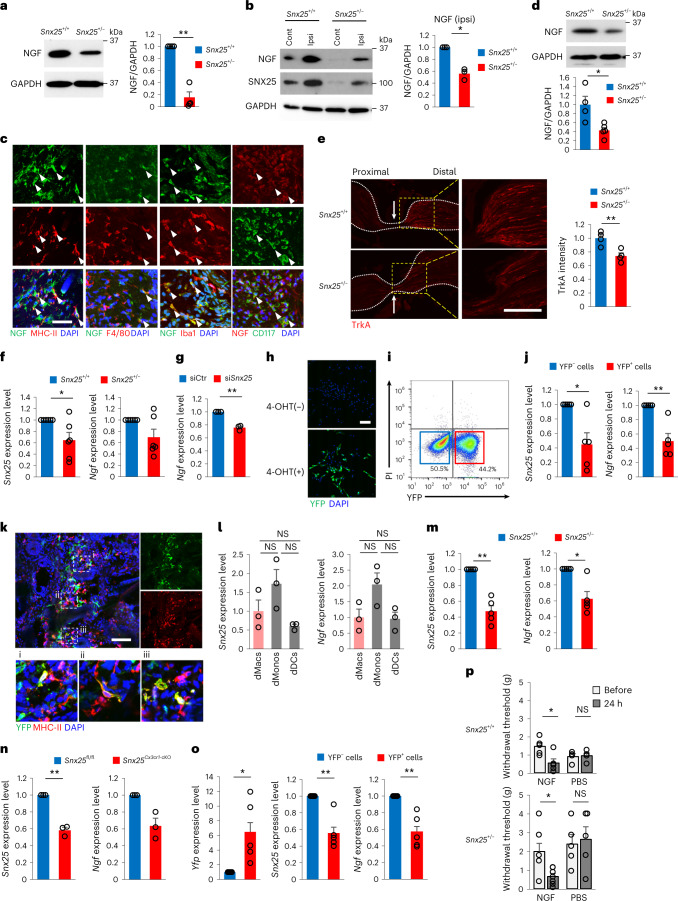
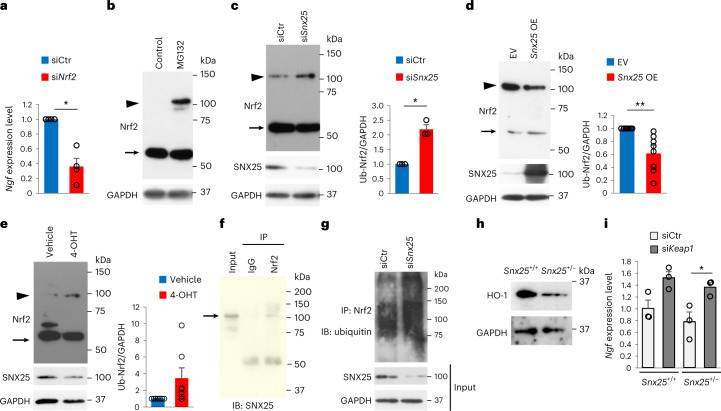
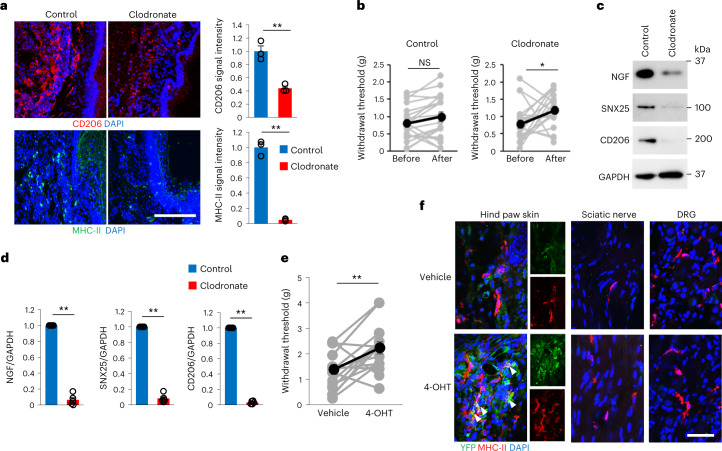
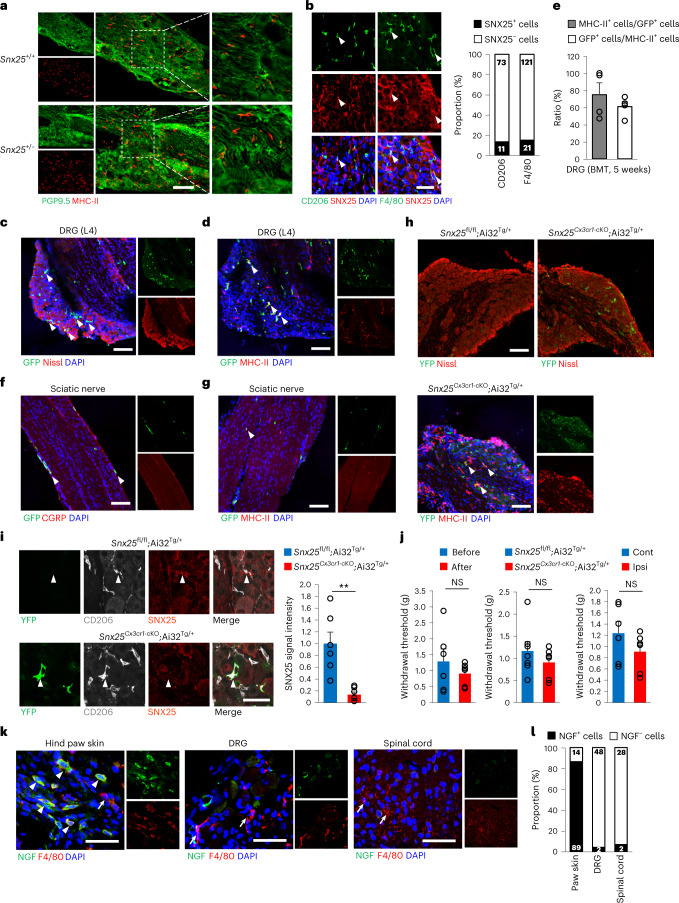
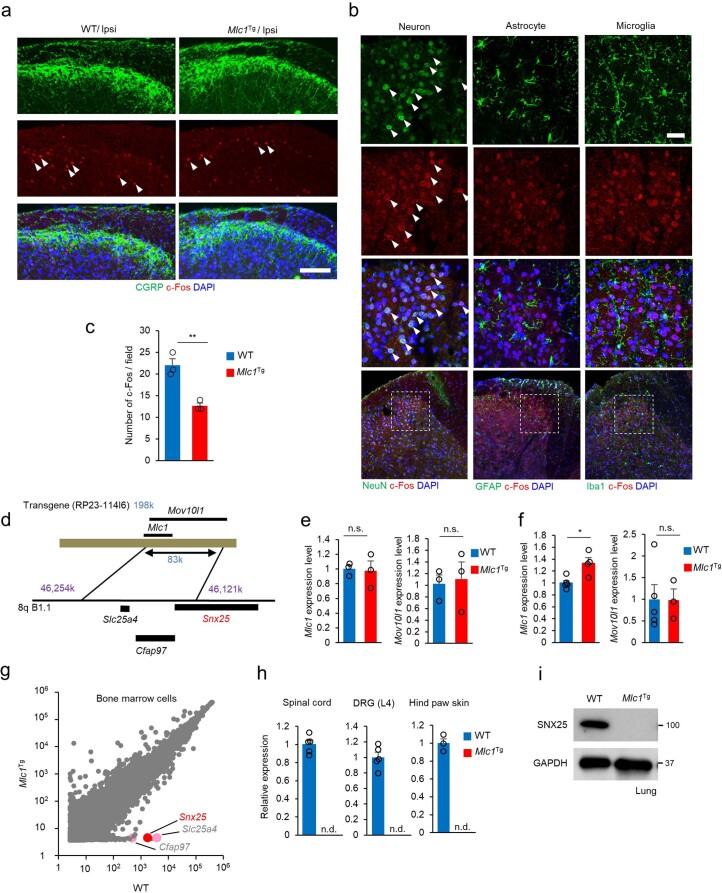
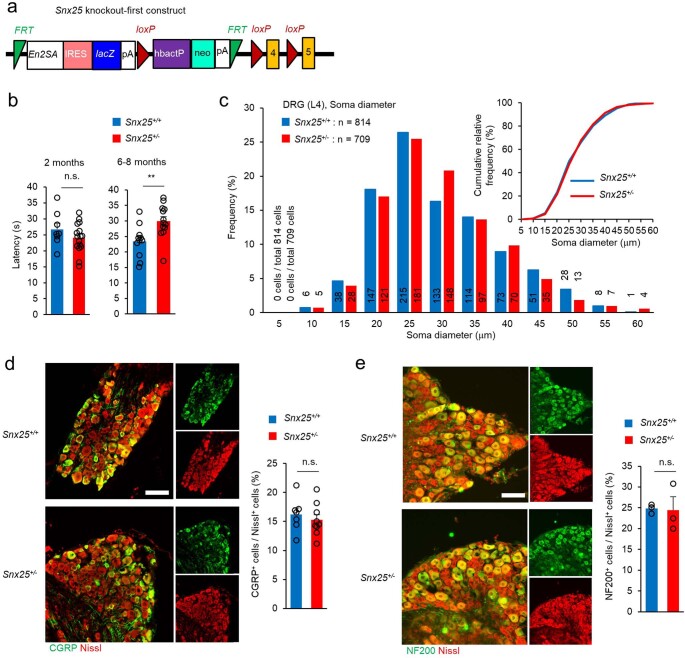
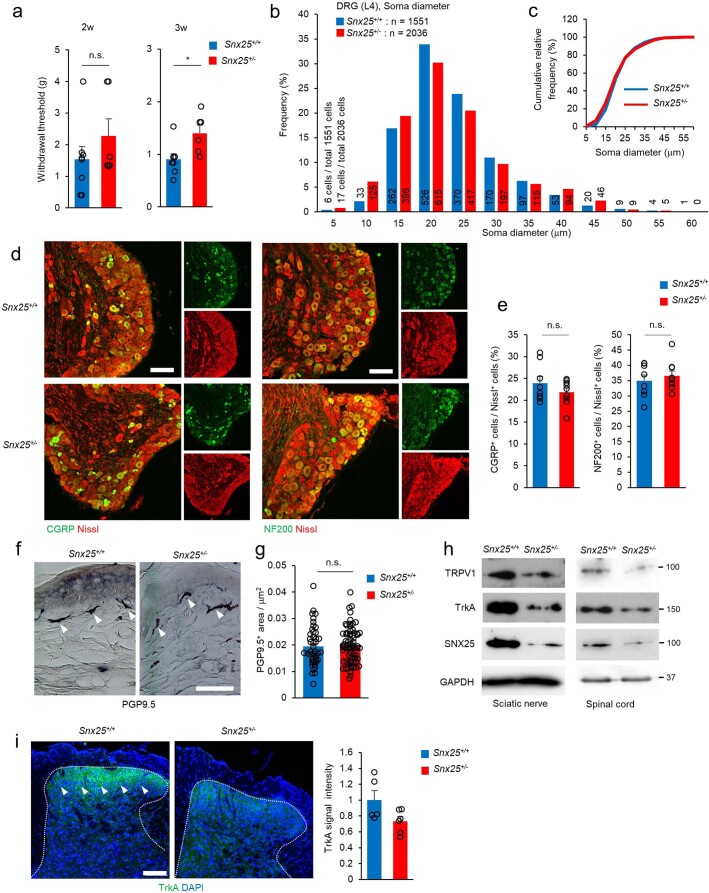
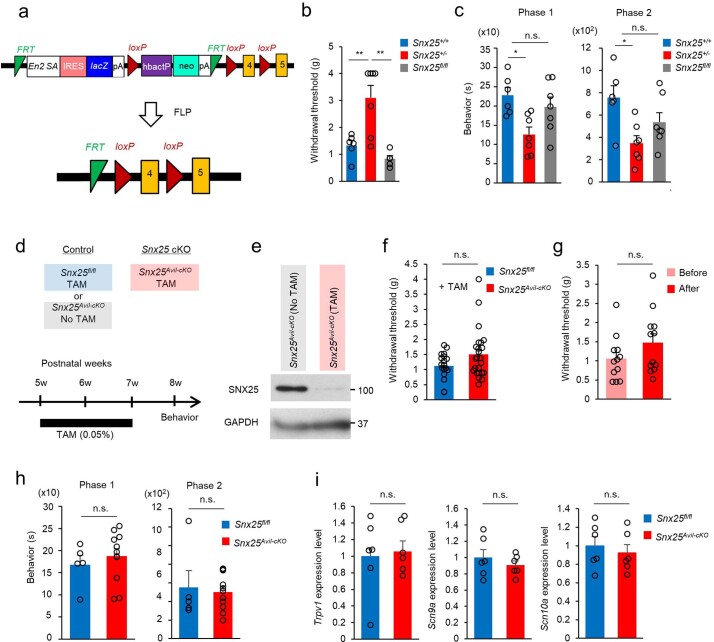
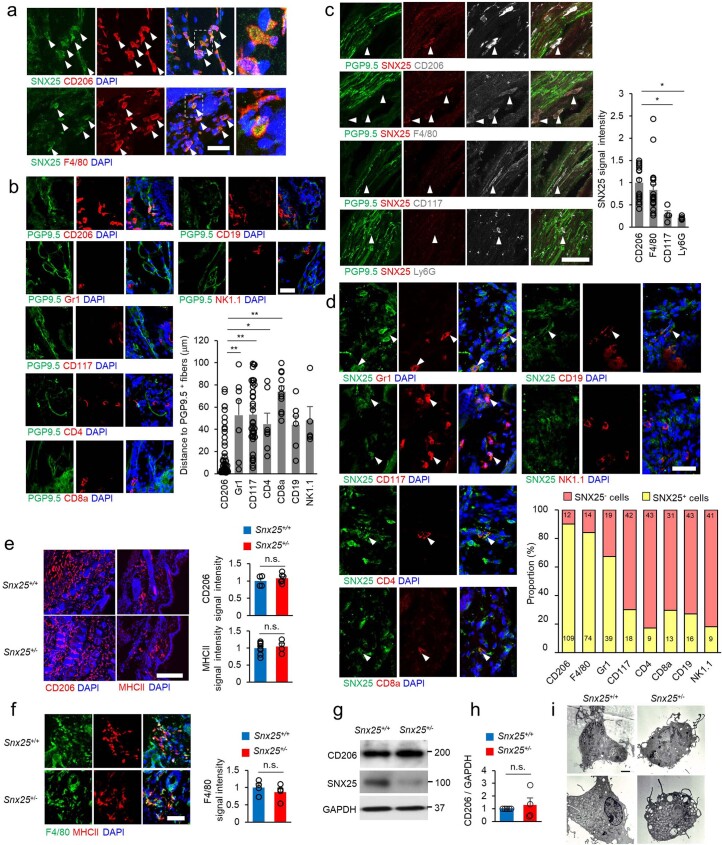
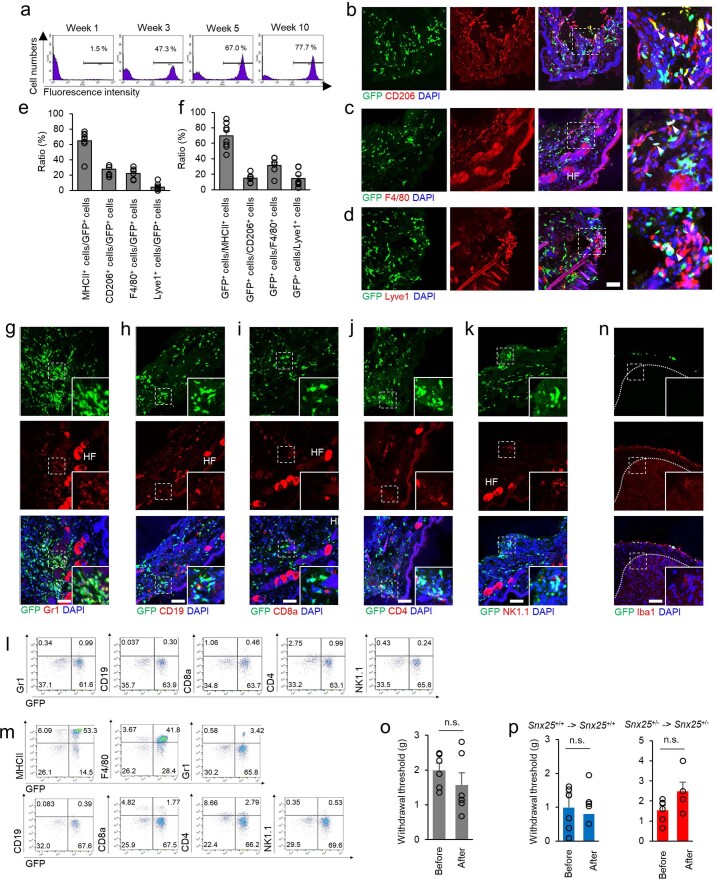
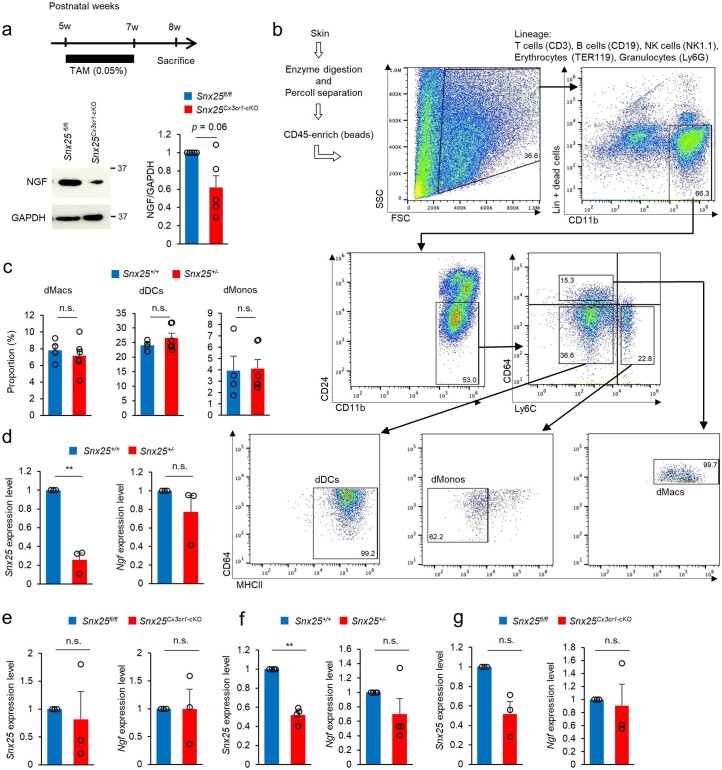
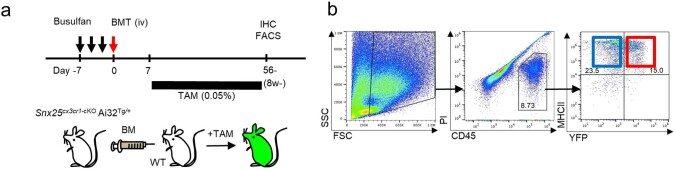
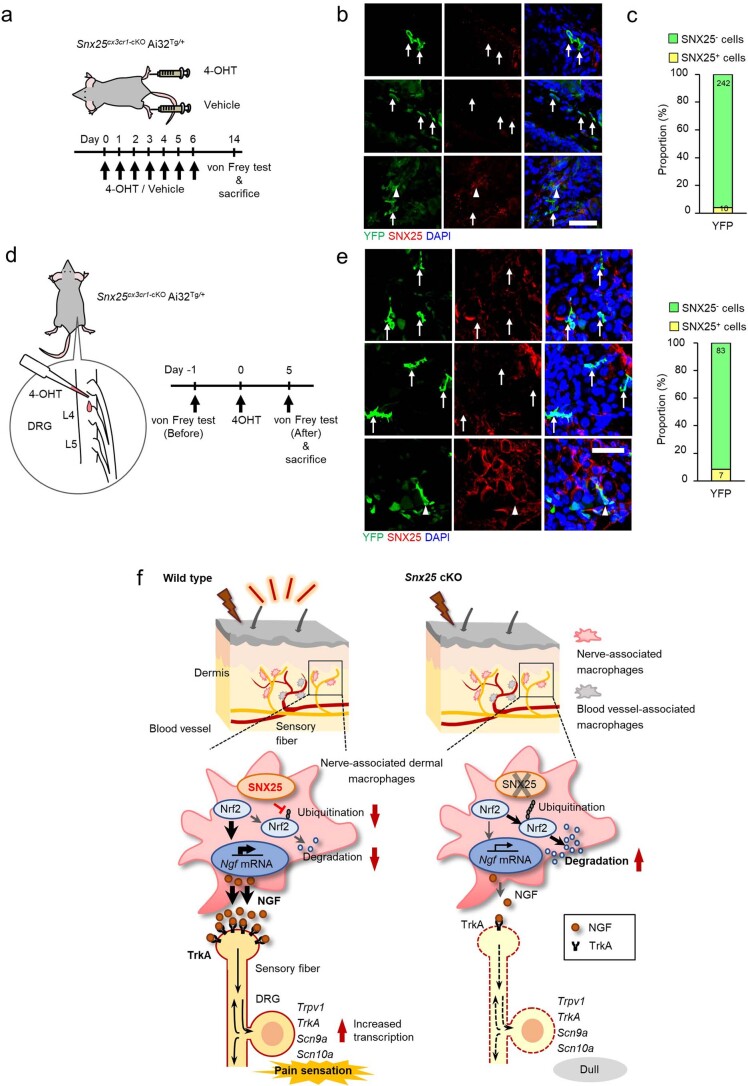
Cross-talk between peripheral neurons and immune cells is important in pain sensation. We identified Snx25 as a pain-modulating gene in a transgenic mouse line with reduced pain sensitivity. Conditional deletion of Snx25 in monocytes and macrophages, but not in peripheral sensory neurons, in mice (Snx25cKO mice) reduced pain responses in both normal and neuropathic conditions. Bone marrow transplantation using Snx25cKO and wild-type mice indicated that macrophages modulated pain sensitivity. Expression of sorting nexin (SNX)25 in dermal macrophages enhanced expression of the neurotrophic factor NGF through the inhibition of ubiquitin-mediated degradation of Nrf2, a transcription factor that activates transcription of Ngf. As such, dermal macrophages set the threshold for pain sensitivity through the production and secretion of NGF into the dermis, and they may cooperate with dorsal root ganglion macrophages in pain perception.


Conflict of interest statement

The authors declare no competing interests.

Figures

Fig. 1
Fig. 1. Mlc1Tg mice were insensitive to pain.
a, Comparison of paw-withdrawal thresholds to mechanical stimulation with von Frey’s filaments between WT (n = 6) and Mlc1Tg mice on a mixed 129S6–CBA–C57BL/6J background (Mlc1Tg; n = 8). P = 0.001. g, gram. b, VF thresholds in Mlc1Tg mice backcrossed with C57BL/6J mice for seven generations (WT, n = 6; Mlc1Tg-BL6, n = 4). P = 0.017. g, gram. c, Formalin responses plotted for 5-min periods in WT (n = 6) and Mlc1Tg (n = 6) mice. s, second. d, Duration of pain-related behavior during phase 1 (0–10 min) (left, P = 0.208) and phase 2 (20–60 min) (right, P = 0.001) of the response in mice as in c (WT, n = 6; Mlc1Tg, n = 6). s, second. Results are represented as mean ± s.e.m. Statistical significance was calculated using two-tailed Student’s t-test. *P < 0.05, **P < 0.01; NS, not significant. Source data
Fig. 2
Fig. 2. Snx25+/− mice showed a pain-insensitive phenotype.
a, Immunoblot showing the expression level of SNX25 in the lung of WT and Snx25+/− mice. b, VF thresholds of WT and Snx25+/− mice (WT, n = 19; Snx25+/−, n = 33). P = 7.844 × 10−5. g, gram. c, Pain-related behavior time plotted for 5-min periods in WT (n = 6) and Snx25+/− (n = 6) mice with injection of formalin into hind paws. s, second. d, Pain-related behavior time during phase 1 (0–10 min, P = 0.01) and phase 2 (20–60 min, P = 0.029) in mice as in c. s, second. e, VF thresholds plotted after SNI in WT and Snx25+/− mice (WT, n = 4; Snx25+/−, n = 7) at day 3 (P = 0.032), day 5 (P = 0.008) and day 7 (P = 0.04). g, gram. f, Representative immunoblots showing expression of TRPV1 and SNX25 in the DRG of WT and Snx25+/− mice. g, Semi-quantitative analyses of immunoblots of TRPV1 and SNX25 in DRGs from WT (n = 5) and Snx25+/− (n = 5) mice. TRPV1, P = 0.033; SNX25, P = 0.007. h, Confocal microscopy of the DRG stained with anti-TRPV1 antibody in WT and Snx25+/− mice. Scale bar, 100 μm. Right, magnified views of boxed areas in the corresponding left panels. Representative of three independent experiments. Scale bar, 20 μm. i, Confocal microscopy of the DRG of WT and Snx25+/− mice, stained with anti-TrkA antibody (left; scale bar, 100 μm) and quantification of mean TrkA fluorescence intensity (WT, n = 13; Snx25+/−, n = 12 DRG sections from four different mice) (right). P = 0.042. Representative of three independent experiments. DAPI, 4,6-diamidino-2-phenylindole. j, Fluo-4 Ca2+ imaging of primary DRG neurons from an entire well dissociated from WT and Snx25+/− mice (WT, n = 3; Snx25+/−, n = 3). The arrow indicates the time when capsaicin was added to a well. P values are as follows: 448 s, P = 0.033; 469 s, P = 0.008; 490 s, P = 0.04; 511 s, P = 0.002; 532 s, P = 0.014; 553 s, P = 0.03; 574 s, P = 0.038; 595 s, P = 0.034; 700 s, P = 0.046; 742 s, P = 0.049; 805 s, P = 0.049. ex., excitation; em., emission. k, mRNA expression for pain-related factors in the DRG of WT and Snx25+/− mice (WT, n = 3; Snx25+/−, n = 3). Trpv1, P = 0.026; Scn9a, P = 0.032; Scn10a, P = 0.022. Results are represented as mean ± s.e.m. Statistical significance was calculated using two-tailed Student’s t-test (be, i and j) or two-tailed Welch’s t-test (g,k). *P < 0.05, **P < 0.01. Source data
Fig. 3
Fig. 3. SNX25 in macrophages derived from BM contributed to pain sensation.
a, Confocal microscopy of the plantar skin of the naive hind paw of WT mice, immunolabeled for PGP9.5 and MHC-II. Representative of three independent experiments. Scale bar, 50 μm. b, Replacement rates of myeloid cells by transplanted BM of GFP mice in peripheral blood plotted against time after BMT (n = 4). c, Confocal microscopy of hind paw skin labeled for GFP and MHC-II in WT mice that received BM from GFP mice imaged at weeks 1, 3, 4, 5, 7 and 10 after BMT. Arrowheads denote double-labeled cells. Representative of three independent experiments. Scale bar, 100 μm. d, Confocal microscopy of hind paw skin labeled for GFP (Alexa 594) and Cx3cr1 mRNA (fluorescent in situ hybridization) in WT mice that received BM from GFP mice at week 5 after transplantation. Arrowheads show BM-derived GFP+ cells positive for Cx3cr1 mRNA. Representative of two independent experiments. Scale bar, 100 μm. Bottom, magnified views of the boxed area in the upper panel. Scale bar, 50 μm. e, Flow cytometry strategy to sort donor-derived macrophages (MHC-II+ or F4/80+) using propidium iodide (PI), CD45, F4/80, MHC-II and GFP expression from hind paw skins of WT mice that received BMT from GFP mice. FSC, forward scatter; SSC, side scatter. f, Percentage of GFP+ cells among MHC-II+ or F4/80+ cells. Results are presented as mean ± s.e.m. of three different mice that received BMT from GFP mice. Values are 85.1% and 80.8%, respectively. g, VF thresholds in Snx25+/− → WT BM chimeras (n = 10, P = 0.015) and WT → Snx25+/− BM chimeras (n = 13, P = 0.049) at day 28 after BMT. g, gram. Results are represented as mean ± s.e.m. Statistical significance was calculated using two-tailed Student’s t-test. *P < 0.05. Source data
Fig. 4
Fig. 4. Snx25 conditional KO in macrophages yielded a pain-insensitive phenotype.
a, VF thresholds in Snx25Cx3cr1-cKO mice (n = 17) and Snx25fl/fl mice (n = 25) treated with TAM for 2 weeks. P = 2.61 × 10−5. g, gram. b, Formalin responses in Snx25Cx3cr1-cKO mice (n = 8) and Snx25fl/fl mice (n = 4) treated with TAM for 2 weeks. Pain-related behaviors are plotted for phase 1 (0–10 min, P = 0.421) and phase 2 (20–60 min, P = 0.089). s, second. c, Expression of mRNA encoding Na+ channels in DRGs of Snx25Cx3cr1-cKO mice (n = 4) and Snx25fl/fl mice (n = 5). Scn9a, P = 0.064; Scn10a, P = 0.049. d, Quantification of Cxcl5, Cxcl2, Il1b and Cxcl3 mRNA by RT–qPCR in the hind paw skin from Snx25fl/fl mice (n = 3) and Snx25Cx3cr1-cKO mice (n = 3). Cxcl5, P = 0.004; Cxcl2, P = 6.81 × 10−5; Il1b, P = 1.444 × 10−5; Cxcl3, P = 0.069. e, Confocal microscopy of naive hind paw skin from Snx25Cx3cr1-cKO;Ai39Tg/+ mice expressing YFP (green) and MHC-II, F4/80, CD206 (macrophage markers, red) or CD117 (mast cell marker, red). Arrowheads denote double-labeled cells. Scale bar, 50 μm. f, Confocal microscopic images of the hind paw skin of Snx25Cx3cr1-cKO;Ai39Tg/+ mice stained for YFP (green) and PGP9.5 (red). Scale bar, 50 μm. Right, magnified view of the boxed area. Scale bar, 20 μm. g, Confocal microscopy of the hind paw skin stained for PGP9.5 (green), MHC-II (red) and F4/80 or CD206 (white) in WT mice. Scale bar, 50 μm. h, VF thresholds plotted for Snx25fl/fl mice before and after BMT from Snx25Cx3cr1-cKO mice without (no TAM, n = 7, P = 0.35) or with (TAM, n = 10, P = 0.005) TAM treatment at day 35 after BMT. g, gram. i, Establishment and time course of mechanical allodynia plotted after BMT and SNI in BM chimeric mice as in h (no TAM, n = 13; TAM, n = 18). Three days, P = 0.012. POD, postoperative day. g, gram. Results are represented as mean ± s.e.m. Significance was calculated using two-tailed Student’s t-test (ac,h,i) or two-tailed Welch’s t-test (d). *P < 0.05, **P < 0.01. Representative of three independent experiments (eg). Source data
Fig. 5
Fig. 5. NGF expression in macrophages was reduced in Snx25+/− mice.
a, Representative immunoblot showing NGF expression in the hind paw skin of WT and Snx25+/− mice. The graph shows semi-quantitative analyses of the immunoblots (WT, n = 4; Snx25+/−, n = 4). P = 0.002. b, Representative immunoblot showing NGF levels in the hind paw skin of WT and Snx25+/− mice 30 min after formalin injection and semi-quantitative analyses of NGF levels in the ipsilateral (ipsi) hind paw skin of WT (n = 3) and Snx25+/− mice (n = 3). P = 0.015. Cont, contralateral. c, Confocal microscopy of the hind paw skin immunolabeled for NGF and MHC-II, F4/80 and Iba1 (macrophage markers) and CD117 (mast cell marker) in WT mice. Arrowheads denoted double-labeled cells. Representative of three independent experiments. Scale bar, 50 μm. d, Immunoblot of NGF in BMDMs of WT and Snx25+/− mice, normalized to glyceraldehyde-3-phosphate dehydrogenase (GAPDH) content and analyzed semi-quantitatively (WT, n = 4; Snx25+/−, n = 5, P = 0.015). e, Confocal microscopic images of sciatic nerve sections immunolabeled for TrkA at 8 h after nerve ligation (arrows indicate ligation site) in WT and Snx25+/− mice (left), magnified views of the boxed areas in the corresponding left panels (middle) and semi-quantitative analysis of TrkA accumulation on the distal side of the nerve ligature (right) (n = 4 sciatic nerve sections from three different mice, P = 0.008). Representative of two independent experiments. Scale bar, 200 μm. f, Expression profiles of Snx25 and Ngf mRNA in BMDMs of WT and Snx25+/− mice (WT, n = 6; Snx25+/−, n = 6; Snx25, P = 0.049; Ngf, P = 0.085). g, Ngf mRNA quantified by RT–qPCR in BMDMs transfected with either Snx25 siRNA (siSnx25, n = 3) or scramble siRNA (siCtr, n = 3; P = 0.0085). h, Confocal microscopy of YFP-labeled BMDMs derived from Snx25Cx3cr1-cKO;Ai32Tg/+ mice without (top) or with (bottom, 1 μM, 7–8 d) 4-OHT treatment. Representative of three independent experiments. Scale bar, 100 μm. i, Flow cytometry of PI and YFP expression in BMDMs cultured from Snx25Cx3cr1-cKO;Ai32Tg/+ mice. j, Expression of Snx25 and Ngf in BMDMs cultured and sorted from Snx25Cx3cr1-cKO;Ai32Tg/+ mice (YFP, n = 3; YFP+, n = 3; Snx25, P = 0.027; Ngf, P = 0.009). k, Confocal microscopy of the hind paw skin immunolabeled for YFP and MHC-II in WT mice that received BMT from Snx25Cx3cr1-cKO;Ai32Tg/+ mice treated with TAM for 2 weeks. Boxed areas (i–iii) in the upper panel are magnified in the lower panels. Representative of three independent experiments. Scale bar, 100 μm. l, Expression patterns of Snx25 and Ngf in dMacs (n = 3), dMonos (n = 3) and dDCs (n = 3). m, Expression of Snx25 and Ngf in dMacs of WT and Snx25+/− mice (WT, n = 5; Snx25+/−, n = 5; Snx25, P = 0.002; Ngf, P = 0.014). n, Expression of Snx25 and Ngf in dMacs of Snx25fl/fl and Snx25Cx3cr1-cKO mice (Snx25fl/fl, n = 3; Snx25Cx3cr1-cKO, n = 3; Snx25, P = 0.007; Ngf, P = 0.057). o, Expression of Yfp, Snx25 and Ngf mRNA in dMacs of WT mice that received BMT from Snx25Cx3cr1-cKO;Ai32Tg/+ mice (YFP, n = 5; YFP+, n = 5; Yfp, P = 0.043; Snx25, P = 0.008; Ngf, P = 0.009). p, VF thresholds before and 24 h after injection in WT or Snx25+/− mice injected with NGF (10 ng μl−1, 10 μl) or PBS (NGF, WT, n = 5, P = 0.017; Snx25+/−, n = 7, P = 0.014. PBS, WT, n = 4; Snx25+/−, n = 5). g, gram. Results are represented as mean ± s.e.m. Statistical analyses were performed using two-tailed Student’s t-test (d,e), two-tailed Welch’s t-test (a,b,f,g,j,mo) or one-way ANOVA (l,p), and significant differences between group means were identified with the Tukey–Kramer test. *P < 0.05, **P < 0.01. Source data
Fig. 6
Fig. 6. SNX25 activated Ngf production by inhibiting ubiquitin-mediated degradation of Nrf2.
a, Ngf mRNA expression in BMDMs transfected with either Nrf2 siRNA or scramble siRNA analyzed semi-quantitatively by RT–qPCR (siNrf2, n = 4; siCtr, n = 4, P = 0.01). b, Representative immunoblot showing Nrf2 protein levels in 293T cells in the presence or absence of MG132. Arrow, Nrf2 (61–68 kDa); arrowhead, poly-ubiquitinated Nrf2 (100–110 kDa). c, Ubiquitination levels of Nrf2 protein in 293T cells transfected with Snx25 siRNA or scramble siRNA in the presence of MG132. Arrow, Nrf2; arrowhead, poly-ubiquitinated Nrf2. The band intensity of poly-ubiquitinated Nrf2 (Ub-Nrf2) was analyzed semi-quantitatively (siCtr, n = 3; siSnx25, n = 3, P = 0.017). d, Representative immunoblot showing Nrf2 and poly-ubiquitinated Nrf2 levels in 293T cells transfected with the full-length Snx25 expression vector (Snx25 OE) or empty vector (EV) in addition to the Nrf2 expression vector in the presence of MG132. Arrow, Nrf2; arrowhead, poly-ubiquitinated Nrf2. Semi-quantitative analysis of poly-ubiquitinated Nrf2 bands is shown (empty vector and Nrf2 vector, n = 8; Snx25 vector and Nrf2 vector, n = 8, P = 0.006). e, Immunoblot of Nrf2 in BMDMs of Snx25Cx3cr1-cKO mice treated with 4-OHT or vehicle in the presence of MG132 (4-OHT, n = 7; vehicle, n = 7, P = 0.093). Arrow, Nrf2; arrowhead, poly-ubiquitinated Nrf2. f, Co-immunoprecipitation (IP) of SNX25 and Nrf2 in 293T cells expressing Snx25 and Nrf2. Cell lysates were immunoprecipitated with anti-Nrf2 antibody and immunoblotted with anti-SNX25 antibody. Normal IgG (IgG) was used as a negative control. Arrow, SNX25; IB, immunoblot. g, Detection of ubiquitin-bound Nrf2 in SNX25-knockdown or scramble siRNA-treated BMDMs treated with MG132 followed by immunoprecipitation of cell lysates with anti-Nrf2 antibody and immunoblotting with anti-ubiquitin antibody. h, Representative immunoblot of HO-1 in the hind paw skin of WT and Snx25+/− mice. i, Ngf mRNA quantification by RT–qPCR in BMDMs transfected with either Keap1 siRNA or scramble siRNA (siCtr, n = 3; siKeap1, n = 3). Snx25+/−, P = 0.046. Results are represented as mean ± s.e.m. Statistical analyses were performed using two-tailed Welch’s t-test (a,ce) or one-way ANOVA (i), and significant differences between group means were identified with the Tukey–Kramer test. *P < 0.05, **P < 0.01. Source data
Fig. 7
Fig. 7. dMacs were sufficient to initiate pain sensation.
a, Confocal microscopy of the hind paw skin immunolabeled for CD206 or MHC-II in WT mice injected with control liposome or clodronate liposome. Right, quantification of mean fluorescence intensities for CD206 and MHC-II (n = 3 hind paw skin sections from three different mice, CD206, P = 0.003; MHC-II, P = 8.42 × 10−5). Scale bar, 200 μm. b, VF thresholds on the side injected with control liposome (n = 20, P = 0.296) or the side injected with clodronate liposome (n = 20, P = 0.023) of WT mice. g, gram. c,d, Expression of NGF, SNX25 and CD206 in the hind paw skin of sides injected with control liposome or clodronate liposome in WT mice examined by immunoblotting (c) and semi-quantitatively compared for NGF, SNX25 and CD206 (d). Control, n = 5; clodronate, n = 5. NGF, P = 6.69 × 10−6; SNX25, P = 2.87 × 10−6; CD206, P = 4.22 × 10−8. e, VF thresholds of sides injected with vehicle or 4-OHT (left and right side, respectively) of the hind paws of Snx25Cx3cr1-cKO;Ai32Tg/+ mice (n = 15, P = 0.009). g, gram. f, Confocal microscopy of the hind paw skin, the sciatic nerve and the DRG immunolabeled for MHC-II and YFP of the Snx25Cx3cr1-cKO;Ai32Tg/+ mice shown in e. Sections of the side injected with vehicle (top) and the side injected with 4-OHT (bottom). Scale bar, 50 μm. Results are represented as mean ± s.e.m. Statistical analyses were performed using two-tailed Student’s t-test (a,b,e) or two-tailed Welch’s t-test (d). *P < 0.05, **P < 0.01. Representative of three independent experiments (a,f). Source data
Fig. 8
Fig. 8. SNX25+ macrophages in the DRG did not contribute to pain sensitivity.
a, Confocal microscopy of the DRG (L4, naive) immunolabeled for PGP9.5 (green) and MHC-II (red) in WT and Snx25+/− mice. Right, magnified views of boxed areas in the middle panels. Scale bar, 100 μm. b, Confocal microscopic images of the DRG (L4, naive) immunolabeled for macrophage markers (CD206 or F4/80, red) and SNX25 (red) in WT mice. Scale bar, 50 μm. The graph shows the proportion of SNX25+ cells in each specific marker-positive cell population. The numbers in the columns indicate actual cell numbers counted. n = 11 sections from three different mice. c, Confocal microscopy of a DRG (L4) section stained for GFP (green) and fluorescent Nissl (red) in WT mice that received BMT from GFP mice. Arrowheads denote BM-derived GFP+ cells. Scale bar, 100 μm. d, Confocal microscopy of the DRG (L4) double labeled for GFP and MHC-II in the mice shown in c. Arrowheads denote double-labeled cells. Scale bar, 100 μm. e, Percentages of MHC-II+ cells among GFP+ cells and of GFP+ cells among MHC-II+ cells (5 weeks after transplantation) (n = 5 DRG sections from three different mice). f, Confocal microscopy of the sciatic nerve double labeled for GFP and CGRP in the mice shown in c. Arrowheads denote BM-derived GFP+ cells. Scale bar, 100 μm. g, Confocal microscopy of the sciatic nerve double labeled for GFP and MHC-II in the mice shown in c. Arrowhead denote a GFP+MHC-II+ cell. Scale bar, 100 μm. h, Confocal microscopy of the DRG (L4) labeled for fluorescent Nissl (red) and immunolabeled for YFP (green) after injection of 4-OHT directly into DRGs in Snx25Cx3cr1-cKO;Ai32Tg/+ mice (left) and Snx25fl/fl;Ai32Tg/+ mice (right). Scale bar, 100 μm. Bottom, confocal microscopy of the DRG (L4) immunolabeled for MHC-II (red) and YFP (green) after injection of 4-OHT directly into DRGs. Arrowheads indicate cells double labeled for MHC-II and YFP and counterstained with DAPI (blue). Scale bar, 100 μm. i, Confocal microscopy of the DRG immunolabeled for YFP, CD206 and SNX25 in Snx25fl/fl;Ai32Tg/+ mice and Snx25Cx3cr1-cKO;Ai32Tg/+ mice. Arrowheads denote CD206+SNX25+ macrophages. Scale bar, 50 μm. The graph shows the fluorescence intensities of SNX25 in CD206+ macrophages in Snx25Cx3cr1-cKO;Ai32Tg/+ mice (n = 7 sections from three different mice) and Snx25fl/fl;Ai32Tg/+ mice (n = 6 sections from three different mice). P = 0.001. j, VF thresholds before (n = 6) and after (n = 6) 4-OHT injection in Snx25Cx3cr1-cKO;Ai32Tg/+ mice (P = 0.382), Snx25fl/fl;Ai32Tg/+ (n = 7) and Snx25Cx3cr1-cKO;Ai32Tg/+ (n = 6) mice (P = 0.348) and in contralateral (n = 6) and ipsilateral (n = 6) sides of Snx25Cx3cr1-cKO;Ai32Tg/+ mice (P = 0.218). g, gram. k, Confocal microscopy of the hind paw skin, the DRG and the spinal cord immunolabeled for NGF (green) and F4/80 (red) in WT mice. Arrowheads denote double-positive cells and arrows denote NGFF4/80+ cells. Scale bar, 50 μm. l, Proportion of NGF+ cells (black column) in F4/80+ cells. Numbers inside columns are the actual numbers of cells counted. n = 6 sections from three different mice. Results are represented as mean ± s.e.m. Statistical analyses were performed using the two-tailed Student’s t-test. Representative of three independent experiments (ad,fi,k). Source data
Extended Data Fig. 1
Extended Data Fig. 1. Identification of the transgene insertion site in Mlc1Tg mice.
(a) Confocal microscopic images of the dorsal horn of the spinal cord (L4, 30 min after formalin injection, Ipsi: ipsilateral side to injection) immunolabeled for CGRP and c-Fos of WT and Mlc1Tg mice. Arrowheads denoted double-labeled cells. Scale bar, 100 μm. (b) Confocal microscopic images of the dorsal horn of the spinal cord immunolabeled for c-Fos (red) and cell markers (neuron, NeuN; astrocyte, GFAP; microglia, Iba1) of WT mice. Arrowheads denote double-labeled cells. Scale bar, 100 μm. (c) Quantification of c-Fos+ activated neurons in WT and Mlc1Tg mice (WT: n = 3; Mlc1Tg: n = 3, p = 0.005). (d) Diagram showing the insertion site of the RP23-114I6 transgene in chromosome 8 of the Mlc1Tg mice. The positions of three endogenous genes (Snx25, Slc25a4, and Cfap97) relative to the inserted transgene are indicated. (e) mRNA expression levels for Mlc1 (p = 0.856) and Mov10l1 (p = 0.816) in the brain of WT and Mlc1Tg mice (WT: n = 3; Mlc1Tg mice: n = 3). (f) mRNA expression levels for Mlc1 (p = 0.011) and Mov10l1 (p = 0.967) in the spinal cord of WT and Mlc1Tg mice (WT: n = 5; Mlc1Tg mice: n = 4). (g) cDNA microarray data of bone marrow cells of WT and Mlc1Tg mice (WT: n = 3; Mlc1Tg mice: n = 3) were plotted (Y axis: Mlc1Tg; X axis: C57BL/6 WT mice). Snx25, Slc25a4, and Cfap97 are indicated by colored dots. (h) RT-qPCR analyses of Snx25 mRNA in the spinal cord (WT: n = 5; Mlc1Tg mice: n = 4), DRG (WT: n = 5; Mlc1Tg mice: n = 5), and hind paw skin (WT: n = 3; Mlc1Tg mice: n = 5). (i) Immunoblot analysis showing the expression of SNX25 protein in the lung of WT and Mlc1Tg mice. Results are represented as mean ± SEM. Statistical analyses were performed using the two-tailed Student’s t-test. *p < 0.05, **p < 0.01. n.s., not significant. n.d., not detected. Representative of two independent experiments (a and b). Source data
Extended Data Fig. 2
Extended Data Fig. 2. DRG neurons are normal in Snx25+/− mice.
(a) Scheme of the targeting construct used to knock out the Snx25 gene. (b) Hot plate test of WT and Snx25+/− mice. Left panel shows latencies of 2-month-old mice (WT: n = 8; Snx25+/−: n = 16, p = 0.222). Right panel shows those of 6–8-month-old mice (WT: n = 11; Snx25+/−: n = 13, p = 0.006). s, second. (c) Size distribution of DRG neuron diameters is plotted for WT and Snx25+/− mice (L4 level, WT (blue columns): 814 cells from 3 mice; Snx25+/− mice (red columns): 709 cells from 3 mice). X-axis values indicate the maximum diameter in each 5-μm range (for example, 10 indicates diameters ranging from 5 μm to 10 μm). Numbers above or inside columns are the actual numbers of cells in each diameter range. Inset, cumulative frequency distribution of soma diameters. (d) Left, representative confocal microscopic images showing CGRP-immunoreactive neurons in the DRG (L4) of WT and Snx25+/− mice. Scale bar, 100 μm. Right, percentage of CGRP-positive cells among Nissl-positive cells in WT and Snx25+/− mice (WT: n = 7; Snx25+/−: n = 9 DRG sections from at least 3 different mice of each genotype, p = 0.521). (e) Left, representative confocal microscopic images of fluorescent Nissl-stained and NF200-immunoreactive neurons in the DRG (L4) of WT and Snx25+/− mice. Scale bar, 100 μm. Right, percentage of NF200-positive cells among Nissl-positive cells (WT: n = 3; Snx25+/−: n = 3 DRG sections from at least 3 different mice of each genotype, p = 0.903). Results are represented as mean ± SEM. Statistical analyses were performed using the two-tailed Student’s t-test. **p < 0.01. n.s., not significant. Representative of three independent experiments (d and e). Source data
Extended Data Fig. 3
Extended Data Fig. 3. Snx25+/− mice develop normally.
(a) VF thresholds of young (2 and 3 weeks after birth) WT (n = 8) and Snx25+/− mice (n = 6). 2w, p = 0.288; 3w, p = 0.016. g, gram. (b) Size distribution of DRG neuron diameters is plotted for 3-week-old WT and Snx25+/− mice (L4 level, WT (blue columns): 1551 cells from 3 mice; Snx25+/− mice (red columns): 2036 cells from 3 mice). X-axis values indicate the maximum diameter in each 5-μm range. Numbers above or inside columns are the actual numbers of cells in each diameter range. (c) Cumulative frequency distribution of DRG neuron diameters. (d) Representative confocal microscopic images showing CGRP- and NF200-immunoreactive neurons in the DRG (L4) of WT and Snx25+/− mice. Scale bars, 100 μm. (e) Left, percentage of CGRP+ cells among Nissl-positive cells (WT: n = 8; Snx25+/−: n = 9 DRG sections from at least 3 different mice of each genotype, p = 0.27). Right, percentage of NF200+ cells among Nissl-positive cells (WT: n = 8; Snx25+/−: n = 9 DRG sections from at least 3 different mice of each genotype, p = 0.544). (f) Representative images of PGP9.5+ immunoreactivities in the plantar skin of WT and Snx25+/− mice. Arrowheads indicate neuronal fibers labeled for PGP9.5. Scale bar, 50 μm. (g) PGP9.5+ region per unit area (μm2) was measured and plotted for each genotype (WT: 44 sections from 3 mice; Snx25+/−: 68 sections from 4 mice, p = 0.805). (h) Representative immunoblot showing TRPV1, TrkA, and SNX25 proteins in the sciatic nerve and spinal cord of WT and Snx25+/− mice. (i) Representative immunofluorescence images showing TrkA-immunoreactive terminals (green fluorescence, arrowheads) in the dorsal horn of the WT and Snx25+/− mice counterstained with DAPI (blue fluorescence). Right, quantification of mean fluorescence intensity (WT: n = 5; Snx25+/−: n = 6 spinal cord sections from 3 different mice of each genotype, p = 0.066). Scale bar, 100 μm. Results are represented as mean ± SEM. Statistical analyses were performed using the two-tailed Student’s t-test. *p < 0.05. n.s., not significant. Representative of three independent experiments (d, f, and i). Source data
Extended Data Fig. 4
Extended Data Fig. 4. Snx25 cKO in DRGs does not yield the pain-insensitive phenotype.
(a) Schematic representation showing that the initial targeting construct (upper; knock-out first construct) for the Snx25 gene was transformed to an Snx25fl/fl (for exon 4) construct after recombination by flippase (FLP). (b) VF thresholds of WT, Snx25+/−, and Snx25fl/fl mice are shown (WT: n = 6; Snx25+/−: n = 7; Snx25fl/fl: n = 5). Snx25+/+/Snx25+/−, p = 0.004; Snx25+/+/Snx25fl/fl, p = 0.001. g, gram. (c) Formalin responses in the phase 1 (left, 0–10 min, Snx25+/+/Snx25+/−, p = 0.014) and phase 2 (right, 20–60 min, Snx25+/+/Snx25+/−, p = 0.011) for three lines of mice (WT: n = 6; Snx25+/−: n = 7; Snx25fl/fl: n = 7). s, second. (d) Experimental paradigm and schedule. The Avil Cre driver functions specifically in DRG neurons. TAM feeding for two weeks was employed to differentiate control (No TAM) and experimental (TAM) groups. Another control was Snx25fl/fl mice without Cre driver and with TAM feeding. (e) Representative immunoblotting showed the expression levels of SNX25 in the DRG (L4) of Snx25Avil-cKO mice in the presence or absence of TAM. (f) VF thresholds are plotted for Snx25fl/fl and Snx25Avil-cKO mice treated with TAM (Snx25fl/fl: n = 19; Snx25Avil-cKO: n = 24, p = 0.068). g, gram. (g) VF thresholds were plotted for Snx25Avil-cKO mice before and after TAM treatment (n = 12, p = 0.165). g, gram. (h) Formalin responses of the two groups of mice (Snx25fl/fl : n = 5, Snx25Avil-cKO: n = 11). The responses in the phase 1 (left, 0–10 min, p = 0.529) and phase 2 (right, 20–60 min, p = 0.747) are indicated. s, second. (i) Expression profiles of mRNAs for pain-related factors (Trpv1, Scn9a, Scn10a) in DRG (L4) of Snx25fl/fl and Snx25Avil-cKO are shown (Snx25fl/fl: n = 6; Snx25Avil-cKO: n = 6). Trpv1, p = 0.687; Scn9a, p = 0.422; Scn10a, p = 0.576. Results are represented as mean ± SEM. Statistical analyses were performed using the two-tailed Student’s t-test (fi) or one-way ANOVA (b and c), and significant differences between group means were identified with the Tukey–Kramer test. *p < 0.05, **p < 0.01. n.s., not significant. Source data
Extended Data Fig. 5
Extended Data Fig. 5. Dermal macrophages located near nerve fibers express SNX25.
(a) Confocal microscopic images of the hind paw skin immunolabeled for SNX25 and macrophage markers (CD206 (upper panels) or F4/80 (lower panels)) of WT mice. Scale bar, 50 μm. The rightmost panels are enlarged images of the boxed areas in the panels to their left. Arrowheads indicate cells double labeled for SNX25 and macrophage markers. (b) Confocal microscopic images of hind paw skin immunolabeled for PGP9.5 (green) and the indicated cell-specific markers (red) of WT mice. Scale bar, 50 μm. The summary graph shows the distance between a PGP9.5+ fiber and each specific marker+ cell. CD206: n = 56; Gr1: n = 7; CD117: n = 36; CD4: n = 7; CD8a: n = 11; CD19: n = 6; NK1.1: n = 5 from at least 3 different mice. The other myeloid cells are considerably further from fibers, but a few neutrophils (Gr1) and mast cells (CD117) are localized near fibers. CD206/Gr1, p = 0.003; CD206/CD117, p = 6.12e-10; CD206/CD4, p = 0.046; CD206/CD8a, p = 6.59e-10. (c) Confocal microscopic images of the hind paw skin immunolabeled for PGP9.5 (green), SNX25 (red), and the indicated cell-specific markers (white) of WT mice. Scale bar, 50 μm. The summary graph shows the SNX25 fluorescence intensity in each specific marker+ cell located near a fiber. CD206: n = 15; F4/80: n = 19; CD117: n = 4; Ly6G: n = 4 from at least 3 different mice. CD206/CD117, p = 0.036; CD206/Ly6G, p = 0.017. (d) Confocal microscopic images of hind paw skin immunolabeled for SNX25 and specific cell markers (Gr1, CD117, CD4, CD8a, CD19, and NK1.1) in WT mice. Each antibody was used as a marker for neutrophils, mast cells, helper T cells, killer T cells, B cells, and NK cells, respectively. Scale bar, 50 μm. The summary graph shows the proportion of SNX25+ cells (yellow column) in each specific marker+ cells. The percentages of SNX25+ cells are 90.1% (CD206), 84.1% (F4/80), 67.2% (Gr1), 30.0% (CD117), 17.3% (CD4), 29.5% (CD8a), 27.1% (CD19), and 18.0% (NK1.1). Numbers inside columns are the actual numbers of cells counted. (e) Confocal microscopic images of the hind paw skin immunolabeled for CD206 or MHCII in WT and Snx25+/− mice. Right panel shows quantification of signal intensities for CD206 and MHCII in the two groups of mice (CD206, WT: n = 4; Snx25+/−: n = 6, MHCII, WT: n = 8; Snx25+/−: n = 4 hind paw skin sections from at least 3 different mice). CD206, p = 0.424; MHCII, p = 0.693. Scale bar, 200 μm. (f) Confocal microscopic images of the hind paw skin immunolabeled for F4/80 and MHCII in WT and Snx25+/− mice. Right panel shows quantification of F4/80 signal intensity in the two group of mice (n = 4 hind paw skin sections from 2 different mice, p = 0.429). Scale bar, 50 μm. (g) Representative immunoblot shows the expressions of CD206 and SNX25 proteins in the hind paw skins of WT and Snx25+/− mice. (h) Semi-quantitation of CD206 protein levels in the hind paw skins of WT and Snx25+/− mice (WT: n = 4; Snx25+/−: n = 4, p = 0.649). (i) Electron microscopic images of representative BMDMs derived from WT and Snx25+/− mice. Note that there is no overt difference in the morphology. Scale bar, 2 μm. Results are represented as mean ± SEM. Statistical analyses were performed using the two-tailed Student’s t-test (e, f) or two-tailed Welch’s t-test (h) or one-way ANOVA (b and c), and significant differences between group means were identified with the Tukey–Kramer test. *p < 0.05, **p < 0.01. n.s., not significant. Representative of three (a, b, c, d, e, f) or two (i) independent experiments. Source data
Extended Data Fig. 6
Extended Data Fig. 6. Dermal macrophages in the skin are derived from bone marrow.
(a) Time course (1–10 weeks after BMT) of myeloid cell chimerism in peripheral blood of WT mice received BMT from GFP mice. The proportions of GFP+ cells (positive ranges were indicated by bars) in total myeloid cells are expressed as percentages (n = 4). (b–d) Confocal microscopic images of the hind paw skin of WT mice that received BMT from GFP mice. Sections are double labeled for GFP and cell markers (CD206 (b), F4/80 (c), and Lyve1(d)). HF denotes hair follicles showing non-specific fluorescence. (Scale bar, 100 μm. (e) Percentage of MHCII+ (64.6%), CD206+ (27.7%), F4/80+ (22.3%), and Lyve1+ (4.3%) cells among GFP+ cells (5 weeks after transplantation) (MHCII: n = 8; CD206: n = 6; F4/80: n = 6; Lyve1: n = 8 hind paw skin sections from at least 3 different mice). (f) Percentage of GFP+ cells among MHCII+, CD206+, F4/80+, and Lyve1+ cells (5 weeks after transplantation) (MHCII: n = 8; CD206: n = 6; F4/80: n = 6; Lyve1: n = 8 hind paw skin sections from at least 3 different mice). Ratios are 70.0%, 15.1%, 31.5%, and 14.5%, respectively. (g–k) Confocal microscopic images of the sections stained for Gr1 (g), CD19 (h), CD8a (i), CD4 (j), and NK1.1 (k) of the hind paw skin of WT mice that received BMT from GFP mice. Each antibody was used as a marker for neutrophils, B cells, killer T cells, helper T cells, and NK cells, respectively. HF; hair follicles with non-specific fluorescence. Scale bars, 100 μm. (l) Flow cytometry strategy using Gr1, CD19, CD8a, CD4, and NK1.1 marker expression in the hind paw skin. (m) Flow cytometry strategy using MHCII, F4/80, Gr1, CD19, CD8a, CD4, and NK1.1 marker expression in the back skin. (n) Confocal microscopic images of the dorsal horn of the spinal cord (L4) of WT mice that received BMT from GFP mice. The gray matter is demarcated by the dotted line. Insets show magnified images of the boxed areas. Note the absence of GFP+ cells in the gray matter. Scale bar, 100 μm. (o) VF thresholds in WT mice before and after busulfan treatment (n = 6, p = 0.328). g, gram. (p) VF thresholds before and after BMT (WT, before BMT: n = 8; after BMT: n = 5, p = 0.748; Snx25+/− mice, before BMT: n = 6; after BMT: n = 4, p = 0.108) in the WT and Snx25+/− mice that received BMT from the mice of the same genotype. g, gram. Results are represented as mean ± SEM. Statistical analyses were performed using the two-tailed Student’s t-test. n.s., not significant. Representative of three independent experiments (b-d, g-k, and n). Source data
Extended Data Fig. 7
Extended Data Fig. 7. Impairment of macrophage function in Snx25+/− mice.
(a) Confocal images of the hind paw skin (naïve and 7 days after formalin injection) and DRG (L4) (naïve and 7 days after formalin injection) immunolabeled for Iba1 (green) and CD206 (red) in WT and Snx25+/− mice. Scale bars, 100 μm. (b) Quantification of mean CD206 fluorescence intensity at 7 days after formalin injection in the hind paw skin and DRG of WT and Snx25+/− mice. Hind paw skin (WT: n = 8; Snx25+/−: n = 8, p = 0.061) or DRG (WT: n = 4; Snx25+/−: n = 6, p = 0.028) sections from at least 3 different mice. Note the reduced number of the DRG macrophages in the Snx25+/− mice that may play an additive role to that of dermal macrophages in dull response in the inflammation paradigm. (c) Immune-related genes were examined with a mini-microarray (QIAGEN, RT2 Profiler PCR Array, PAMM-077ZC). Relative gene expression patterns of hind paw skin at 3 days after formalin injection in the WT and Snx25+/− mice are color-coded (n = 3 mice per group). (d) Left, a representative immunoblot showing TGFβ receptor type I (TGFbRI) levels in the ipsilateral (Ipsi) injected side and the contralateral (contra) side of the hind paw skin of WT and Snx25+/− mice at 30 min after formalin injection. Right, a representative immunoblot showing TGFbRI levels in the macrophage cell line RAW264.7 treated with scramble siRNA (siCtr) or Snx25 siRNA (siSnx25). Note that TGFbRI is upregulated in the Snx25-decreased tissues and cells. (e) Confocal microscopic images of the hind paw skin and DRG (L4) (7 days after formalin injection) immunolabeled for CCR2 (green) in WT and Snx25+/− mice. Insets show magnified views of boxed areas and arrowheads indicate CCR2+ cells. Scale bar, 100 μm. (f) Quantification of mean CCR2 fluorescence intensity at 7 days after formalin injection in the hind paw skin and DRG of WT and Snx25+/− mice. Hind paw skin (WT: n = 7; Snx25+/−: n = 6, p = 0.09) or DRG (WT: n = 3; Snx25+/−: n = 3, p = 0.099) sections from at least 3 different mice. (g) Size distribution of DRG neuron diameters (L4) of Snx25fl/fl mice (TAM, 1551 cells from 3 mice, blue columns) and Snx25Cx3cr1-cKO mice (TAM, 1627 cells from 3 mice, red columns) are plotted. X-axis values indicated the maximum diameter in each 5-μm range. (h) Immune-related genes were examined with a mini-microarray as in (c). Relative gene expression patterns of hind paw skin at 3 days after formalin injection in Snx25Cx3cr1-cKO mice (comparison with Snx25fl/fl mice as a control) are color-coded (n = 3 mice per group). (i) Experimental schedule of flow cytometry using Snx25Cx3cr1-cKO mice. (j) Flow cytometry strategy using 7-AAD, CD45, F4/80, and CD11b marker expression. F4/80+/CD11b+ cells were collected as macrophages in the hind paw skin of Snx25Cx3cr1-cKO mice after 3 days of formalin injection. (k) Expression patterns of representative chemokines (No TAM: n = 3; TAM: n = 5). Ccl2, p = 0.045; Ccl3, p = 0.023; Ccl4, p = 0.083; Cxcl2, p = 0.034. (l) Proportion of myeloid population in the hind paw skin of Snx25Cx3cr1-cKO mice (No TAM: n = 3; TAM: n = 3). CD11b+ F4/80+, p = 0.0378; CD11b+F4/80-, p = 0.029. Results are represented as mean ± SEM. Significance was calculated using the two-tailed Student’s t-test. *p < 0.05, **p < 0.01. Representative of three independent experiments (a and e). Source data
Extended Data Fig. 8
Extended Data Fig. 8. SNX25 in dermal macrophages regulates Ngf level.
(a) A representative immunoblot showing NGF levels in the hind paw skin of Snx25fl/fl mice and Snx25Cx3cr1-cKO mice after two-week TAM treatment (schedule was shown in upper panel). Semi-quantitative analyses of the NGF levels are shown (n = 5, p = 0.059). (b) Flow cytometry strategy to sort dMacs, dMonos and dDCs from the back skin of mice using CD11b, CD24, Ly6C, CD64, MHCII, and lineage (CD3, CD19, NK1.1, TER119, Ly6G) marker expression. (c) Proportion of myeloid population (dMacs, dMonos, and dDCs) (% each cell / CD45+ CD11b+ Lin- × 100) in the back skin of WT or Snx25+/− mice (WT: n = 4; Snx25+/−: n = 6). dMacs, p = 0.577; dMonos, p = 0.289; dDCs, p = 0.898. (d) Expression patterns of Snx25 and Ngf in dMonos of WT and Snx25+/− mice (WT: n = 3; Snx25+/−: n = 3). Snx25, p = 0.009; Ngf, p = 0.328. (e) Expression patterns of Snx25 and Ngf in dMonos of Snx25fl/fl and Snx25Cx3cr1-cKO mice (Snx25fl/fl: n = 3; Snx25Cx3cr1-cKO: n = 3). Snx25, p = 0.748; Ngf, p = 0.988. (f) Expression patterns of Snx25 and Ngf in dDCs of WT and Snx25+/− mice (WT: n = 4; Snx25+/−: n = 4). Snx25, p = 0.001; Ngf, p = 0.256. (g) Expression patterns of Snx25 and Ngf in dDCs of Snx25fl/fl and Snx25Cx3cr1-cKO mice. (Snx25fl/fl: n = 3; Snx25Cx3cr1-cKO: n = 3). Snx25, p = 0.062; Ngf, p = 0.804. Results are represented as mean ± SEM. Statistical analyses were performed using the two-tailed Student’s t-test (c), Welch’s t-test (a, d, e, f, and g). *p < 0.05, **p < 0.01. n.s., not significant. Source data
Extended Data Fig. 9
Extended Data Fig. 9. SNX25 in dMacs replenished from bone marrow regulates Ngf level.
(a) Schedules for generation of BM chimeric mice by transplanting Snx25Cx3cr1-cKO Ai32 Tg/+ BM into WT mice, and subsequent TAM feeding. (b) Flow cytometry strategy to sort YFP+ and YFP- dMacs using PI, CD45, YFP, MHCII marker expression.
Extended Data Fig. 10
Extended Data Fig. 10. Efficiency of SNX25 deletion in Snx25Cx3cr1-cKOAi32Tg/+ mice.
(a) Scheme depicting dermal injection of 4-OHT into the right hind paw and of vehicle into the left hind paws of a Snx25Cx3cr1-cKOAi32Tg/+ mouse and experimental schedule. (b) Confocal microscopic images of the hind paw skin immunolabeled for YFP and SNX25 in Snx25Cx3cr1-cKOAi32Tg/+ mice that received 4-OHT injection daily for 7 days. Arrows denote SNX25- cells and arrowheads denote SNX25+ cells in YFP-expressing cells. Scale bar, 50 μm. (c) Proportion of SNX25- cells (green column) in YFP+ cells. Note that 96.0% of YFP+ cells were SNX25-. Numbers inside columns were the actual numbers of cells counted. n = 30 hind paw skin sections from 3 different mice. (d) Scheme depicting injection of 4-OHT into surgically-exposed L4 DRG of Snx25Cx3cr1-cKOAi32Tg/+ mice and experimental schedule. (e) Confocal microscopic images of DRG double labeled for YFP and SNX25 in the mice indicated in d. Scale bar, 50 μm. The summary graph shows the proportion of SNX25- cells (green column) in YFP+ cells. Note that 91.2% of YFP+ cells were SNX25-. Numbers inside columns are the actual numbers of cells counted. n = 16 sections from 3 different mice. (f) Schematic representation of how SNX25 in dMacs set pain sensitivity via Nrf2–NGF/TrkA signaling and of how Snx25 cKO resulted in a dull phenotype. Both Snx25+/− and Snx25Cx3cr1-cKO mice display reduced pain responses under both normal and painful conditions. SNX25 inhibits the ubiquitination and subsequent proteasome degradation of Nrf2 and thereby maintains NGF production and secretion into tissues. Snx25 cKO, in turn, accelerates Nrf2 degradation and lowers NGF levels in dermis, which results in a dull phenotype. Representative of three independent experiments (b and e). Source data

Comment in

Similar articles

Cited by

References

    1. Abraira VE, Ginty DD. The sensory neurons of touch. Neuron. 2013;79:618–639. doi: 10.1016/j.neuron.2013.07.051. - DOI - PMC - PubMed
    1. Basbaum AI, Bautista DM, Scherrer G, Julius D. Cellular and molecular mechanisms of pain. Cell. 2009;139:267–284. doi: 10.1016/j.cell.2009.09.028. - DOI - PMC - PubMed
    1. Liu Y, Ma Q. Generation of somatic sensory neuron diversity and implications on sensory coding. Curr. Opin. Neurobiol. 2011;21:52–60. doi: 10.1016/j.conb.2010.09.003. - DOI - PMC - PubMed
    1. Chakarov S, et al. Two distinct interstitial macrophage populations coexist across tissues in specific subtissular niches. Science. 2019;363:eaau0964. doi: 10.1126/science.aau0964. - DOI - PubMed
    1. Kolter J, et al. A subset of skin macrophages contributes to the surveillance and regeneration of local nerves. Immunity. 2019;50:1482–1497. doi: 10.1016/j.immuni.2019.05.009. - DOI - PubMed

Publication types