. 2023 Feb;5(2):237-247.
doi: 10.1038/s42255-022-00731-5. Epub 2023 Jan 26.

A phenome-wide comparative analysis of genetic discordance between obesity and type 2 diabetes

Affiliations

A phenome-wide comparative analysis of genetic discordance between obesity and type 2 diabetes

Daniel E Coral et al. Nat Metab. 2023 Feb.

Abstract

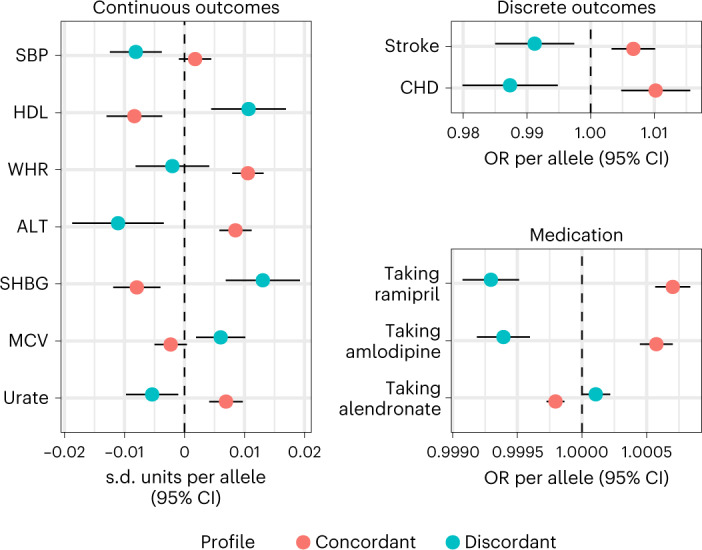
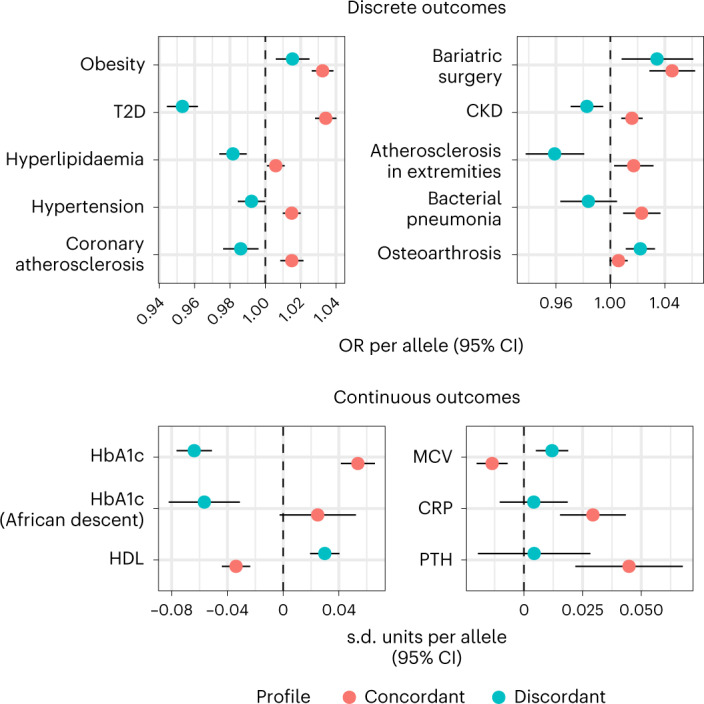
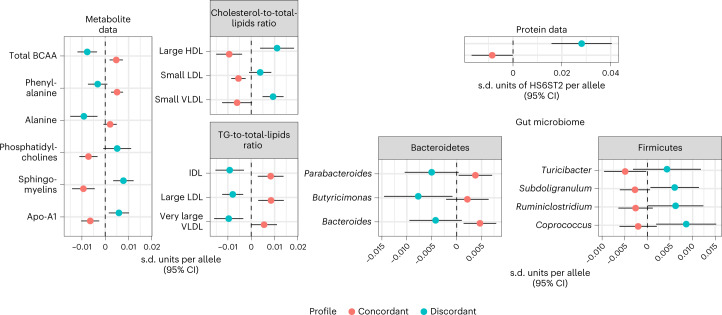
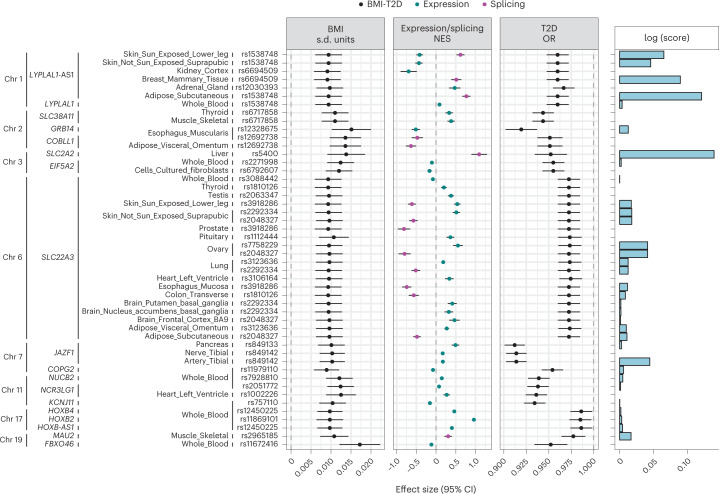
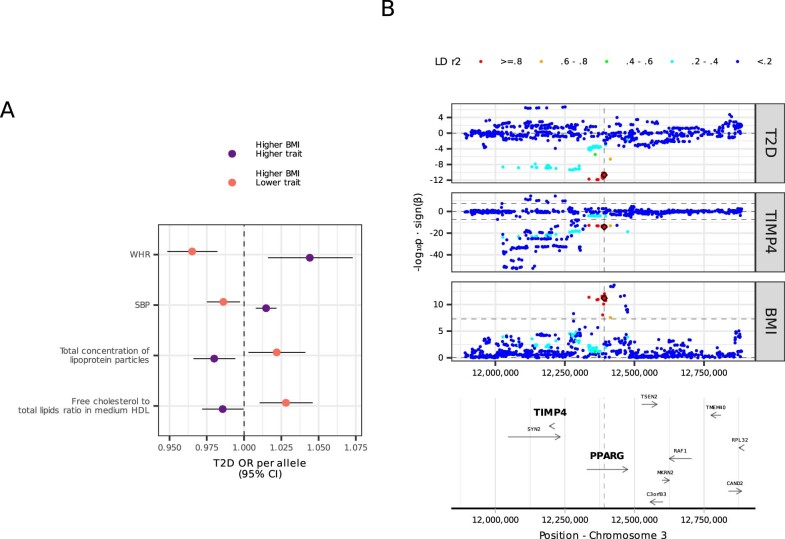
Obesity and type 2 diabetes are causally related, yet there is considerable heterogeneity in the consequences of both conditions and the mechanisms of action are poorly defined. Here we show a genetic-driven approach defining two obesity profiles that convey highly concordant and discordant diabetogenic effects. We annotate and then compare association signals for these profiles across clinical and molecular phenotypic layers. Key differences are identified in a wide range of traits, including cardiovascular mortality, fat distribution, liver metabolism, blood pressure, specific lipid fractions and blood levels of proteins involved in extracellular matrix remodelling. We find marginal differences in abundance of Bacteroidetes and Firmicutes bacteria in the gut. Instrumental analyses reveal prominent causal roles for waist-to-hip ratio, blood pressure and cholesterol content of high-density lipoprotein particles in the development of diabetes in obesity. We prioritize 17 genes from the discordant signature that convey protection against type 2 diabetes in obesity, which may represent logical targets for precision medicine approaches.


Conflict of interest statement

P.W.F. has received research grants from numerous diabetes drug companies and fees as consultant from Novo Nordisk, Lilly and Zoe. He is currently the Head of the Department of Translational Medicine at the Novo Nordisk Foundation. All other authors declare non-competing interests.

Figures

Fig. 1
Fig. 1. Summary-based comparison of concordant and discordant profiles.
Concordant and discordant GRS coefficients for traits where we found differences between profiles using GWAS summary data. All are per-allele effect sizes, in s.d. units for continuous outcomes and ORs for binary traits (diseases and self-reported medication). Traits shown had at least one estimate significant after 5% FDR correction and the difference between profiles was also significant after 5% FDR. Statistical tests were based on a z-distribution and were two-sided. Bars show 95% CIs. Sample sizes vary for every trait (N > 100,000 for all traits).
Fig. 2
Fig. 2. Comparison of concordant and discordant profiles in BioVU.
Concordant and discordant GRS coefficients for traits where we found differences between profiles in BioVU. Analyses of disease endpoints included data for up to 48,544 individuals. Continuous outcomes included data for up to 68,724 and 13,661 individuals of European and African descent, respectively. All are per-allele effect sizes, in s.d. units for continuous outcomes and ORs for disease endpoints. Traits shown had at least one estimate significant after 5% FDR correction and the difference between profiles was also significant after 5% FDR. Statistical tests were based on a z-distribution and were two-sided. Bars show 95% CIs. CRP, C-reactive protein.
Fig. 3
Fig. 3. Comparison of concordant and discordant profiles in molecular phenotypes.
Concordant and discordant GRS coefficients for traits where we found differences between profiles in molecular phenotypes. All are per-allele effect sizes, in s.d. units. Findings in metabolites shown here are derived from TwinsUK + KORA F4 (N = 7,824) and the UK Biobank (N = 115,078). Protein data were derived from the INTERVAL study (N = 3,301). Traits shown in these two domains had at least one estimate significant after 5% FDR correction, and the difference between profiles was also significant after 5% FDR. Statistical tests were based on a z-distribution and were two-sided. Bars show 95% CIs. Microbiome data came from the MiBioGen consortium (N = 18,340); the genii shown here had at least one estimate nominally significant, and the difference between estimates was also nominally significant (two-sided P < 0.05).
Fig. 4
Fig. 4. Genes with likely discordant pleiotropic effects on BMI and T2D.
Genes with likely pleiotropic, yet discordant, effects on BMI and T2D, as found in the SMR & HEIDI analysis. Genes were sorted by their chromosome location and tissue where the pleiotropic association was found, as well as the lead expression quantitative trait loci (eQTL). The first three panels comprise the effect sizes of the lead eQTL on BMI (s.d. units), gene expression/splicing (normalized effect size) and T2D risk (OR), respectively. Bars represent 95% CIs. The right panel represents the logarithm of the tissue-of-action score. BMI data were derived from the GIANT + UK Biobank meta-analysis (N = 681,275). Gene expression data came from the GTEx (N = 838) and eQTLGen consortia (N = 31,684). T2D data came from the DIAGRAM meta-analysis dataset (N = 158,186).
Extended Data Fig. 1
Extended Data Fig. 1. Analysis flowchart and profile identification.
Panel A: Analysis flowchart. Panel B: BMI and T2D risk estimates of concordant and discordant SNPs after alignment to the BMI increasing allele. Panel C: summary-based concordant and discordant GRS coefficients (standard deviation units for continuous traits, log OR for binary traits). Traits shown have at least 1 estimate significant after 5% FDR correction and the difference between profiles is also significant after 5% FDR. Statistical tests were based on a Z-distribution and were two-sided. Bars show 95% confidence intervals. Sample sizes vary for every trait (> 100.000 for all traits). The heatmap shows the Z-scores of the SNPs in every trait, with the single-linkage tree at the bottom, separately for concordant and discordant SNPs.
Extended Data Fig. 2
Extended Data Fig. 2. Traits with potential causal effect on diabesity discordance.
Panel A: Traits where a difference was found in the comparison of profiles and one of the two direction-specific GRS associated with BMI was associated with lower risk of T2D (two-sided Z-statistic P < 0.05). To derive the GRS we used BMI data from the GIANT + UK Biobank meta-analysis (N = 681,275). WHR data came from the GIANT consortium (N = 212,244). SBP data came from the meta-analysis performed by the ICBP (N = 757,601). Metabolite data came from the UK Biobank (N = 115,078). Estimates represent T2D OR, bars represent 95% confidence intervals, which are derived from the DIAGRAM meta-analysis (N = 158,186). Panel C: Regional association plot showing the pleiotropic effect of genetic instruments for blood levels of TIMP4 protein and high BMI and lower T2D risk. Protein data was derived from the INTERVAL study (N = 3,301).

Comment in

References

    1. World Health Organization. Cardiovascular diseases (CVDs). Available from: https://www.who.int/news-room/fact-sheets/detail/cardiovascular-diseases.... Accessed October 2022.
    1. Magliano DJ, et al. Trends in incidence of total or type 2 diabetes: systematic review. BMJ. 2019;366:l5003. doi: 10.1136/bmj.l5003. - DOI - PMC - PubMed
    1. Blüher M. Obesity: global epidemiology and pathogenesis. Nat. Rev. Endocrinol. 2019;15:288–298. doi: 10.1038/s41574-019-0176-8. - DOI - PubMed
    1. van Vliet-Ostaptchouk JV, et al. The prevalence of metabolic syndrome and metabolically healthy obesity in Europe: a collaborative analysis of ten large cohort studies. BMC Endocr. Disord. 2014;14:9. doi: 10.1186/1472-6823-14-9. - DOI - PMC - PubMed
    1. Blüher M. Metabolically healthy obesity. Endocr. Rev. 2020;41:405–420. doi: 10.1210/endrev/bnaa004. - DOI - PMC - PubMed

Publication types