

Gdaphen, R pipeline to identify the most important qualitative and quantitative predictor variables from phenotypic data
- PMID: 36703114
- PMCID: PMC9878791
- DOI: 10.1186/s12859-022-05111-0
Gdaphen, R pipeline to identify the most important qualitative and quantitative predictor variables from phenotypic data
Abstract
Background: In individuals or animals suffering from genetic or acquired diseases, it is important to identify which clinical or phenotypic variables can be used to discriminate between disease and non-disease states, the response to treatments or sexual dimorphism. However, the data often suffers from low number of samples, high number of variables or unbalanced experimental designs. Moreover, several parameters can be recorded in the same test. Thus, correlations should be assessed, and a more complex statistical framework is necessary for the analysis. Packages already exist that provide analysis tools, but they are not found together, rendering the decision method and implementation difficult for non-statisticians.
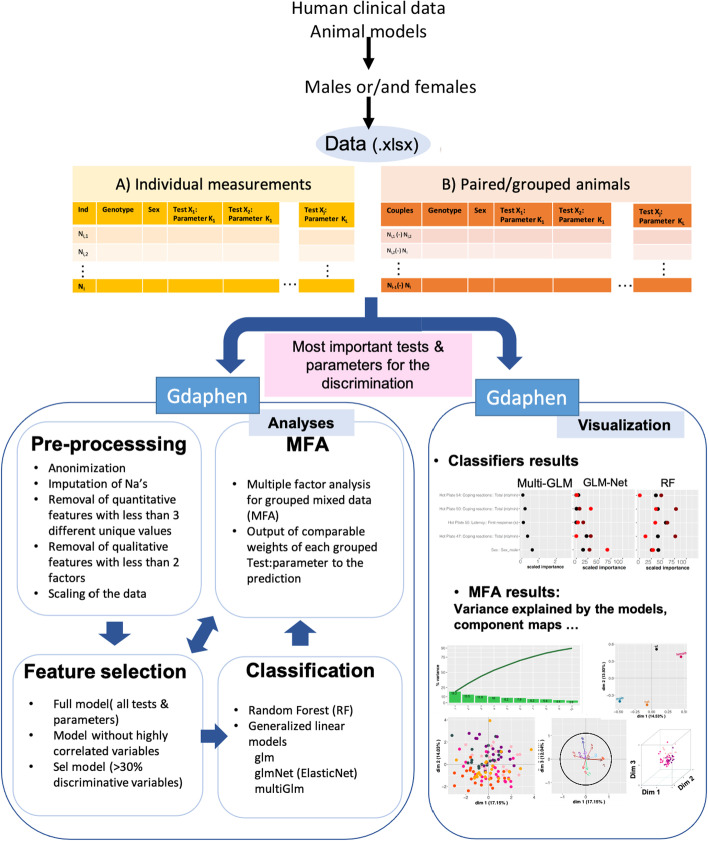
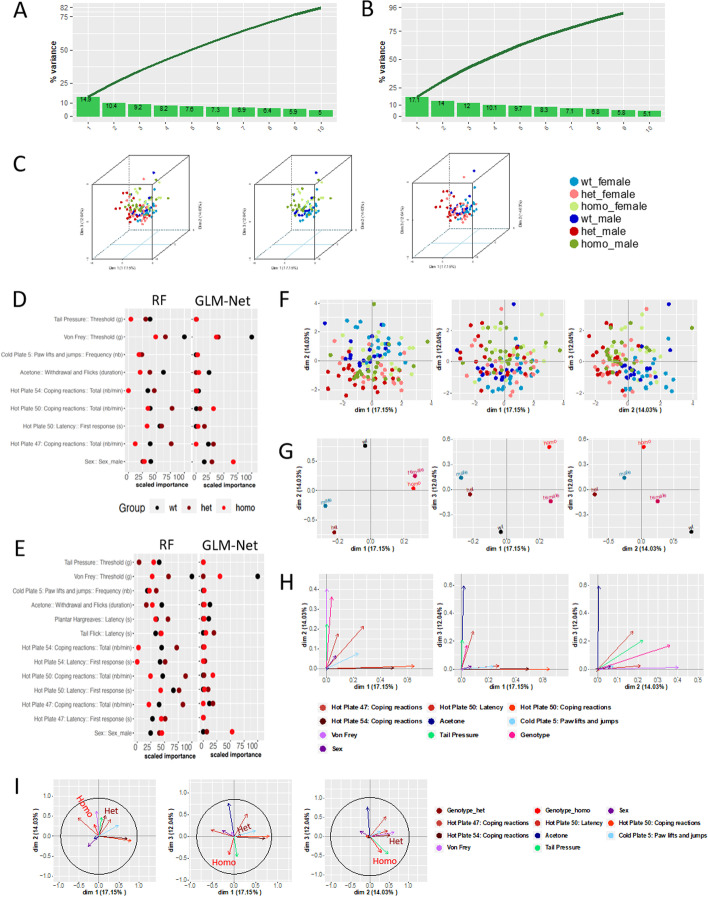
Result: We present Gdaphen, a fast joint-pipeline allowing the identification of most important qualitative and quantitative predictor variables to discriminate between genotypes, treatments, or sex. Gdaphen takes as input behavioral/clinical data and uses a Multiple Factor Analysis (MFA) to deal with groups of variables recorded from the same individuals or anonymize genotype-based recordings. Gdaphen uses as optimized input the non-correlated variables with 30% correlation or higher on the MFA-Principal Component Analysis (PCA), increasing the discriminative power and the classifier's predictive model efficiency. Gdaphen can determine the strongest variables that predict gene dosage effects thanks to the General Linear Model (GLM)-based classifiers or determine the most discriminative not linear distributed variables thanks to Random Forest (RF) implementation. Moreover, Gdaphen provides the efficacy of each classifier and several visualization options to fully understand and support the results as easily readable plots ready to be included in publications. We demonstrate Gdaphen capabilities on several datasets and provide easily followable vignettes.
Conclusions: Gdaphen makes the analysis of phenotypic data much easier for medical or preclinical behavioral researchers, providing an integrated framework to perform: (1) pre-processing steps as data imputation or anonymization; (2) a full statistical assessment to identify which variables are the most important discriminators; and (3) state of the art visualizations ready for publication to support the conclusions of the analyses. Gdaphen is open-source and freely available at https://github.com/munizmom/gdaphen , together with vignettes, documentation for the functions and examples to guide you in each own implementation.
Keywords: Bootstrapping; Clinical data; Discrimination; Generalized linear models; Imputation; Machine learning; Model; Phenotypic data; Prediction; R package; Random forest.
© 2023. The Author(s).
Conflict of interest statement
The authors declare that they have no competing interests.
Figures

Similar articles
-
Machine learning algorithms for outcome prediction in (chemo)radiotherapy: An empirical comparison of classifiers.Med Phys. 2018 Jul;45(7):3449-3459. doi: 10.1002/mp.12967. Epub 2018 Jun 13. Med Phys. 2018. PMID: 29763967 Free PMC article.
-
The Human SCN9A R185H Point Mutation Induces Pain Hypersensitivity and Spontaneous Pain in Mice.Front Mol Neurosci. 2022 Jun 13;15:913990. doi: 10.3389/fnmol.2022.913990. eCollection 2022. Front Mol Neurosci. 2022. PMID: 35769334 Free PMC article.
-
pyRforest: a comprehensive R package for genomic data analysis featuring scikit-learn Random Forests in R.Brief Funct Genomics. 2025 Jan 15;24:elae038. doi: 10.1093/bfgp/elae038. Brief Funct Genomics. 2025. PMID: 39373492 Free PMC article.
-
Single Marker Family-Based Association Analysis Not Conditional on Parental Information.Methods Mol Biol. 2017;1666:409-439. doi: 10.1007/978-1-4939-7274-6_20. Methods Mol Biol. 2017. PMID: 28980257 Review.
-
A review on longitudinal data analysis with random forest.Brief Bioinform. 2023 Mar 19;24(2):bbad002. doi: 10.1093/bib/bbad002. Brief Bioinform. 2023. PMID: 36653905 Free PMC article. Review.
References
-
- Vanhoeyveld J, Martens D. Imbalanced classification in sparse and large behaviour datasets. Data Min Knowl Discov. 2018;32(1):25–82. doi: 10.1007/s10618-017-0517-y. - DOI
MeSH terms
Grants and funding
LinkOut - more resources
Full Text Sources
