Review
. 2023 Jan 26;21(1):9.
doi: 10.1186/s12958-023-01060-2.

H3K4me3 mediates uterine leiomyoma pathogenesis via neuronal processes, synapsis components, proliferation, and Wnt/β-catenin and TGF-β pathways

Affiliations
Review

H3K4me3 mediates uterine leiomyoma pathogenesis via neuronal processes, synapsis components, proliferation, and Wnt/β-catenin and TGF-β pathways

María Cristina Carbajo-García et al. Reprod Biol Endocrinol. .

Abstract

Background: Uterine leiomyomas (UL) are the most common benign tumor in women of reproductive age. Their pathology remains unclear, which hampers the development of safe and effective treatments. Raising evidence suggests epigenetics as a main mechanism involved in tumor development. Histone modification is a key component in the epigenetic regulation of gene expression. Specifically, the histone mark H3K4me3, which promotes gene expression, is altered in many tumors. In this study, we aimed to identify if the histone modification H3K4me3 regulates the expression of genes involved in uterine leiomyoma pathogenesis.

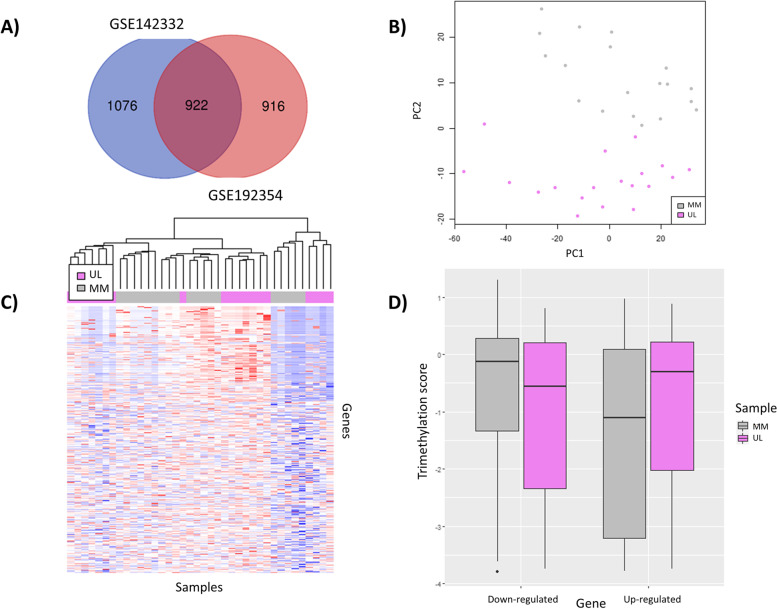
Methods: Prospective study integrating RNA-seq (n = 48) and H3K4me3 CHIP-seq (n = 19) data of uterine leiomyomas versus their adjacent myometrium. Differentially expressed genes (FDR < 0.01, log2FC > 1 or < - 1) were selected following DESeq2, edgeR, and limma analysis. Their differential methylation and functional enrichment (FDR < 0.05) were respectively analyzed with limma and ShinyGO.

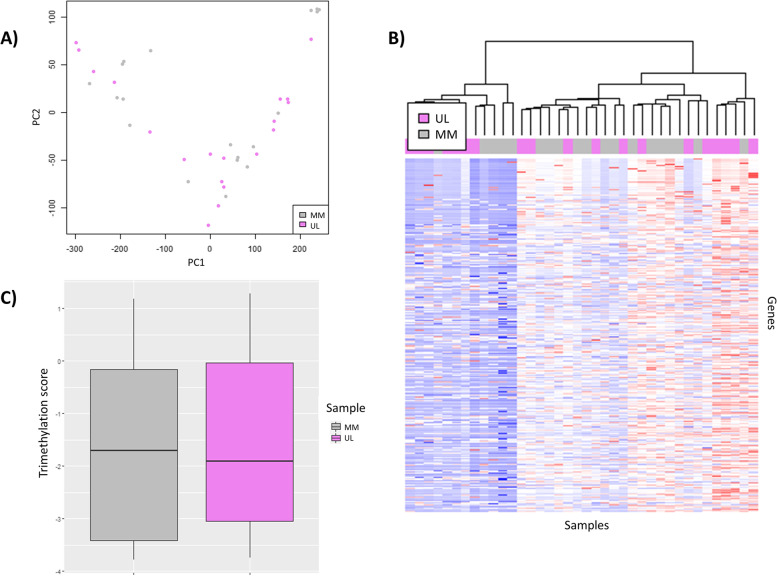
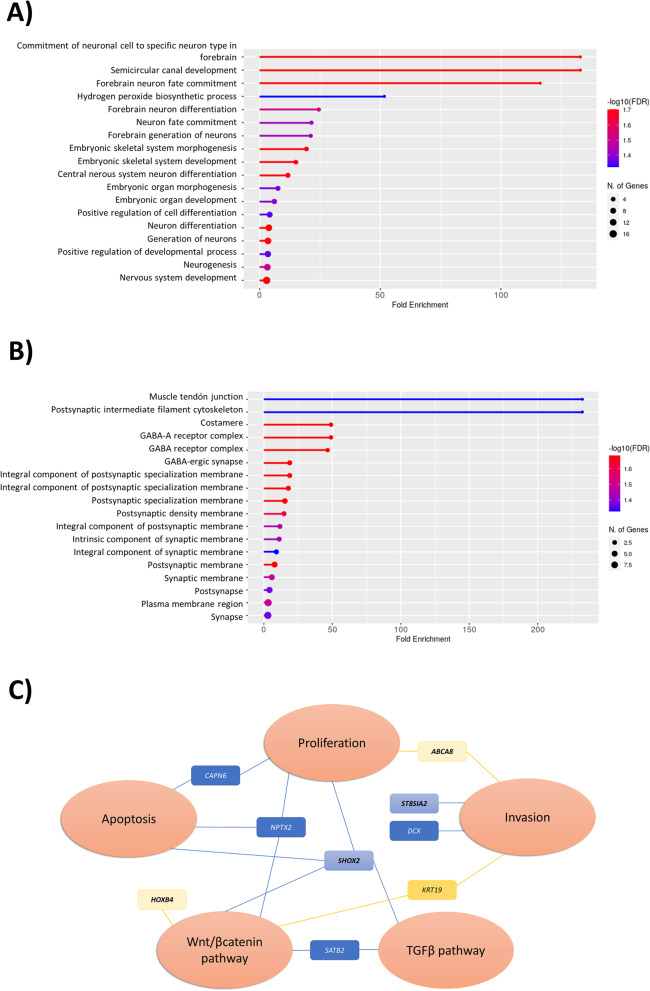
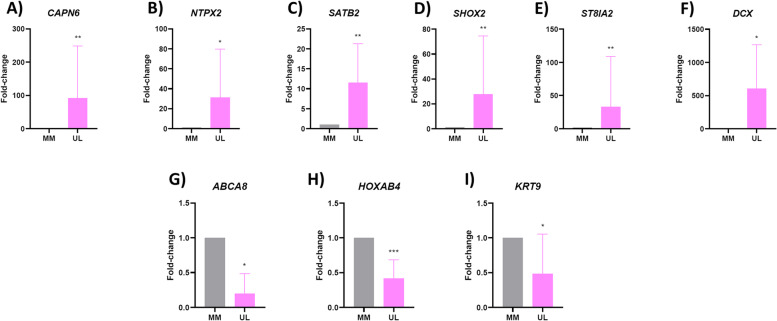
Results: CHIP-seq data showed a global suppression of H3K4me3 in uterine leiomyomas versus their adjacent myometrial tissue (p-value< 2.2e-16). Integrating CHIP-seq and RNA-seq data highlighted that transcription of 696/922 uterine leiomyoma-related differentially expressed genes (DEG) (FDR < 0.01, log2FC > 1 or < - 1) was epigenetically mediated by H3K4me3. Further, 50 genes were differentially trimethylated (FDR < 0.05), including 33 hypertrimethylated/upregulated, and 17 hypotrimethylated/downregulated genes. Functional enrichment analysis of the latter showed dysregulation of neuron-related processes and synapsis-related cellular components in uterine leiomyomas, and a literature review study of these DEG found additional implications with tumorigenesis (i.e. aberrant proliferation, invasion, and dysregulation of Wnt/β-catenin, and TGF-β pathways). Finally, SATB2, DCX, SHOX2, ST8SIA2, CAPN6, and NPTX2 proto-oncogenes were identified among the hypertrimethylated/upregulated DEG, while KRT19, ABCA8, and HOXB4 tumor suppressor genes were identified among hypotrimethylated/downregulated DEG.

Conclusions: H3K4me3 instabilities alter the expression of oncogenes and tumor suppressor genes, inducing aberrant proliferation, and dysregulated Wnt/β-catenin, and TGF-β pathways, that ultimately promote uterine leiomyoma progression. The reversal of these histone modifications may be a promising new therapeutic alternative for uterine leiomyoma patients.

Keywords: Gene expression; H3K4me3; Histone modification; Proliferation; Uterine leiomyoma; Wnt/β-catenin.


Conflict of interest statement

The authors declare no conflict of interest.

Figures

Fig. 1
Fig. 1
Overall H3K4me3 profile in uterine leiomyoma compared to adjacent myometrium tissues. Based on data extracted from GSE142332. A Principal component analysis of global H3K4me3 status in uterine leiomyomas (ULs; violet) and adjacent myometrium (MM; gray) (n = 19/group). B Heatmap representing the fold-enrichment score of genes with a CHIP-seq H3K4me3 peak in the promotor region after unsupervised clustering of ULs (violet) and MM (gray) (n = 19/group). The color scale ranges from red, for a higher normalized fold-enrichment score, to blue, for lower levels. C Boxplot analysis of the distribution of normalized fold-enrichment score for each peak in ULs (violet) compared to the adjacent MM (gray) samples (n = 19/group), representing the H3K4me3 profile
Fig. 2
Fig. 2
Selection of differentially expressed genes and description of their H3K4me3 status in ULs compared to MM tissue. A Venn diagram representing common DEGs (FDR-adjusted p-value< 0.01, log2FC > 1 or < − 1) between GSE192354 (n = 28) and GSE142332 (n = 19) datasets. B Principal component analysis of global H3K4me3 profile. C Heatmap based on the fold-enrichment score of selected DEGs shared between GSE192354 and GSE142332, whose promoter region presented a peak after unsupervised clustering of CHIP-seq data from uterine leiomyomas (ULs; violet) and their adjacent myometrium (MM; gray) (n = 19/group). The color scale ranges from red, for a higher normalized fold-enrichment score, to blue, for lower levels. D Boxplot analysis of the distribution of normalized fold-enrichment score for each peak of downregulated and upregulated genes in ULs (violet) compared to their adjacent MM (gray) samples (n = 19/group), representing the H3K4me3 status in each group of genes
Fig. 3
Fig. 3
Functional enrichment of H3K4me3-mediated differential expressed genes with altered status in UL vs MM. The most significant (A) biological processes and (B) cellular components were obtained following functional enrichment analysis of common DEGs associated with H3K4me3 instabilities in UL vs MM tissues. C Functional implication of selected hypertrimethylated/upregulated oncogenes (blue squares) and hypotrimethylated downregulated genes (yellow squares). The genes that were not been previously related to UL are in bold
Fig. 4
Fig. 4
Validation of RNA-seq results. mRNA expression levels of (A) CAPN6, (B) NPTX2, (C) SATB2, (D) SHOX2, (E) ST8SIA2, (F) DCX, (G) ABCA8, (H) HOXB4, and (I) KRT19 in a separate cohort of ULs compared to their adjacent MM matched tissues (n = 10). Relative gene expression was analyzed by qRT-PCR, quantified with the ΔΔCt method, and expressed as fold change. *p < 0.05; **p < 0.01; ***p < 0.001; ****p < 0.0001

References

    1. Stewart EA, Laughlin-Tommaso SK, Catherino WH, Lalitkumar S, Gupta D, Vollenhoven B. Uterine fibroids. Nat Rev Dis Prim. 2016;2:16043. doi: 10.1038/nrdp.2016.43. - DOI - PubMed
    1. Giuliani E, As-Sanie S, Marsh EE. Epidemiology and management of uterine fibroids. Int J Gynaecol Obstet. 2020;149(1):3–9. doi: 10.1002/ijgo.13102. - DOI - PubMed
    1. Mehine M, Kaasinen E, Heinonen HR, Mäkinen N, Kämpjärvi K, Sarvilinna N, et al. Integrated data analysis reveals uterine leiomyoma subtypes with distinct driver pathways and biomarkers. Proc Natl Acad Sci U S A. 2016;113(5):1315–1320. doi: 10.1073/pnas.1518752113. - DOI - PMC - PubMed
    1. Maruo T, Ohara N, Wang J, Matsuo H. Sex steroidal regulation of uterine leiomyoma growth and apoptosis. Hum Reprod Update. 2004;10(3):207–220. doi: 10.1093/humupd/dmh019. - DOI - PubMed
    1. Ono M, Yin P, Navarro A, Moravek MB, Coon VJS, Druschitz SA, et al. Paracrine activation of WNT/β-catenin pathway in uterine leiomyoma stem cells promotes tumor growth. Proc Natl Acad Sci U S A. 2013;110(42):17053–17058. doi: 10.1073/pnas.1313650110. - DOI - PMC - PubMed