Clinical Trial
. 2023 Jan 26;12(1):4.
doi: 10.1186/s40035-023-00336-2.

Combined metabolic activators improve cognitive functions in Alzheimer's disease patients: a randomised, double-blinded, placebo-controlled phase-II trial

Affiliations
Clinical Trial

Combined metabolic activators improve cognitive functions in Alzheimer's disease patients: a randomised, double-blinded, placebo-controlled phase-II trial

Burak Yulug et al. Transl Neurodegener. .

Abstract

Background: Alzheimer's disease (AD) is associated with metabolic abnormalities linked to critical elements of neurodegeneration. We recently administered combined metabolic activators (CMA) to the AD rat model and observed that CMA improves the AD-associated histological parameters in the animals. CMA promotes mitochondrial fatty acid uptake from the cytosol, facilitates fatty acid oxidation in the mitochondria, and alleviates oxidative stress.

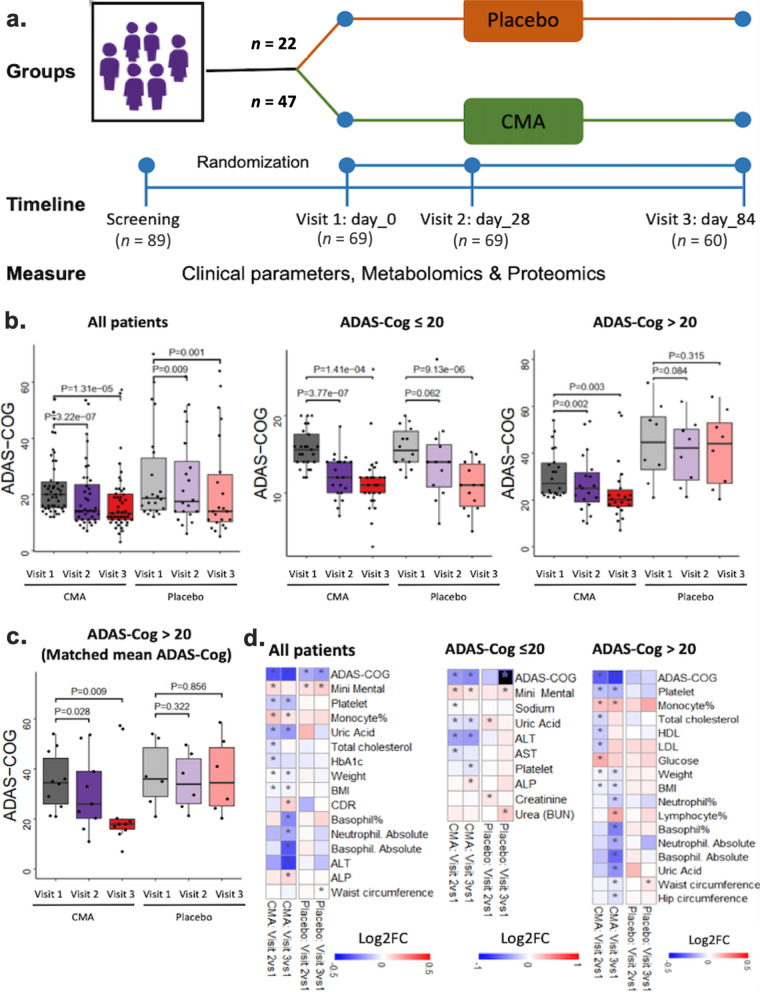
Methods: Here, we designed a randomised, double-blinded, placebo-controlled phase-II clinical trial and studied the effect of CMA administration on the global metabolism of AD patients. One-dose CMA included 12.35 g L-serine (61.75%), 1 g nicotinamide riboside (5%), 2.55 g N-acetyl-L-cysteine (12.75%), and 3.73 g L-carnitine tartrate (18.65%). AD patients received one dose of CMA or placebo daily during the first 28 days and twice daily between day 28 and day 84. The primary endpoint was the difference in the cognitive function and daily living activity scores between the placebo and the treatment arms. The secondary aim of this study was to evaluate the safety and tolerability of CMA. A comprehensive plasma metabolome and proteome analysis was also performed to evaluate the efficacy of the CMA in AD patients.

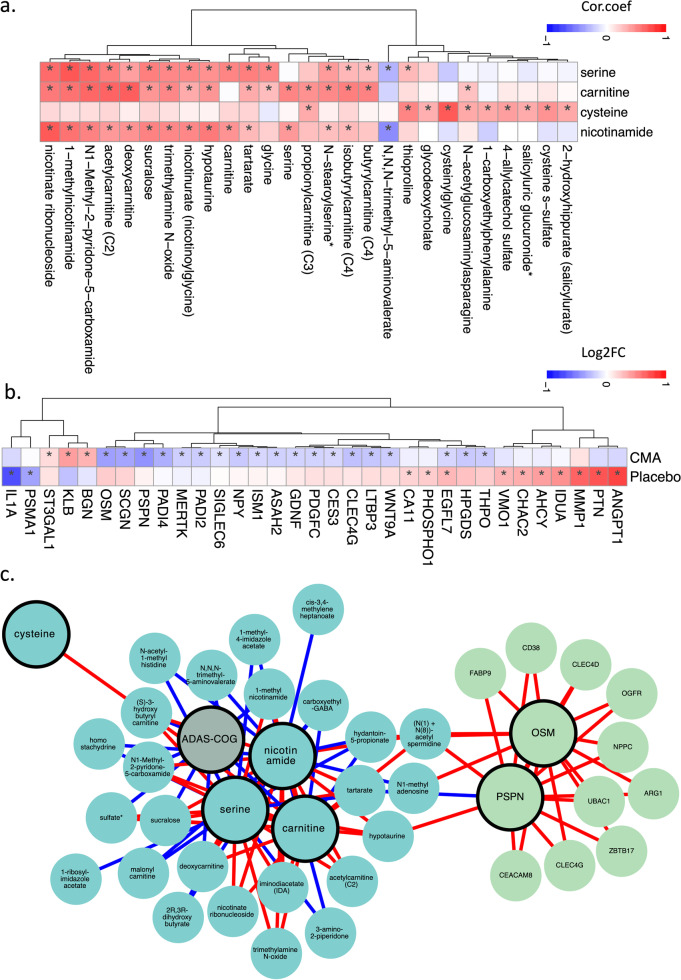
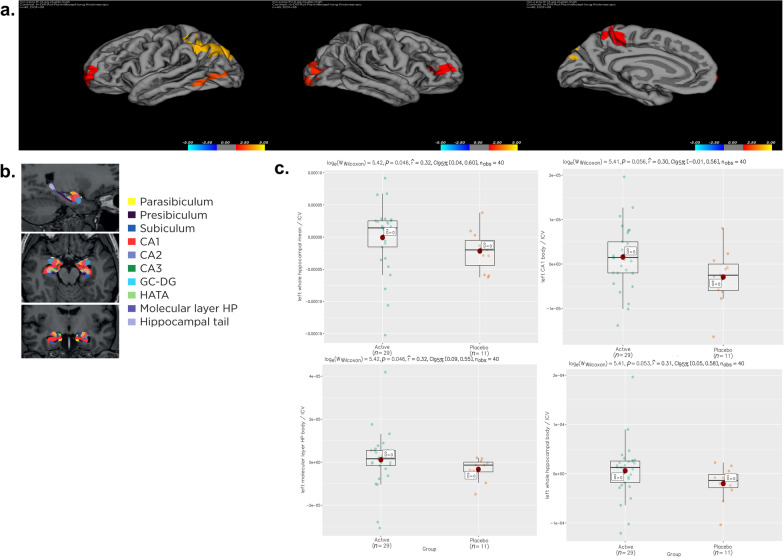
Results: We showed a significant decrease of AD Assessment Scale-cognitive subscale (ADAS-Cog) score on day 84 vs day 0 (P = 0.00001, 29% improvement) in the CMA group. Moreover, there was a significant decline (P = 0.0073) in ADAS-Cog scores (improvement of cognitive functions) in the CMA compared to the placebo group in patients with higher ADAS-Cog scores. Improved cognitive functions in AD patients were supported by the relevant alterations in the hippocampal volumes and cortical thickness based on imaging analysis. Moreover, the plasma levels of proteins and metabolites associated with NAD + and glutathione metabolism were significantly improved after CMA treatment.

Conclusion: Our results indicate that treatment of AD patients with CMA can lead to enhanced cognitive functions and improved clinical parameters associated with phenomics, metabolomics, proteomics and imaging analysis. Trial registration ClinicalTrials.gov NCT04044131 Registered 17 July 2019, https://clinicaltrials.gov/ct2/show/NCT04044131.

Keywords: Alzheimer’s disease; Combined metabolic activators; Multi-omics; Systems biology; Systems medicine.


Conflict of interest statement

AM, JB and MU are the founder and shareholders of ScandiBio Therapeutics. The other authors declare no competing interests.

Figures

Fig. 1
Fig. 1
CMA improves ADAS-Cog scores and clinical parameters. a Study design for testing the effects of CMA in AD patients. b Differences in ADAS-Cog scores in the CMA and placebo groups on days 0, 28 and 84. The ADAS-Cog scores were further analysed by stratifying the patients into high- (score > 20) and low-ADAS-Cog score (≤ 20) groups. The ADAS-Cog score was significantly decreased on day 28 vs day 0 (Log2FoldChange [FC] =  − 0.33, 26% improvement, P = 0.0000003) and on day 84 vs day 0 (Log2FC =  − 0.37, 29% improvement, P = 0.00001) in the CMA group. A slight but significant decrease was found in the placebo group on day 28 vs day 0 (Log2FC =  − 0.16, 12% improvement, P = 0.009) and on day 84 vs day 0 (Log2FC = −0.19, 14% improvement, P = 0.001). In addition, the ADAS-Cog score was significantly decreased on day 28 vs day 0 (Log2FC =  − 0.31, 24% improvement, P = 0.002) and on day 84 vs day 0 (Log2FC =  − 0.38, 30% improvement, P = 0.003) in the high-score CMA group, while no significance difference was seen in the high-score placebo group. c We selected 10 patients from the severe (ADAS-COG score > 20) CMA group with matched ADAS-COG values to the placebo group (P-value: 0.693) and presented the ADAS-Cog scores. We recalculated the differences in ADAS-COG scores and found significant improvement in the CMA group whereas there was no significant difference in the placebo group. d Heatmaps showing log2FC-based alterations of the clinical variables before vs after treatment in both CMA and placebo groups. Asterisks indicate statistical significance based on Student’s t-test (P < 0.05)
Fig. 2
Fig. 2
Identification of clinical variables informative for response to CMA administration. a Distribution of ADAS-Cog scores over visits for patients with ALT level ≤ 16 IU/l (upper panel) and ALT > 16 IU/l (lower panel) at visit 1. b Between-visit changes of ADAS-Cog score in AD patients stratified by other various clinical variables. Only those clinical variable groupings resulted in a more significant change of ADAS-Cog in the CMA group compared to the placebo group is shown (P < 0.05). The colour scale indicates log2 fold change of ADAS-Cog score between visits. Statistical significance between visits was determined by a paired t-test across individuals who attended both visits. Asterisks indicate a statistical significance of P < 0.05
Fig. 3
Fig. 3
CMA alters plasma metabolite levels. a Differences in the plasma levels of individual CMA, including serine, carnitine, cysteine and nicotinamide on days 0 and 84. bd Plasma levels of amino acids, lipids and other metabolites that were significantly different between day 84 and day 0 in the CMA and placebo groups. Adjusted P < 0.05. Heatmap shows log2FC values of metabolites between day 84 and day 0. Asterisks indicate statistical significance based on paired Student’s t-test. Adjusted P < 0.05. Log2FC: log2(fold change)
Fig. 4
Fig. 4
Correlation of CMA with plasma metabolites and altered plasma protein levels. a Associations between the plasma levels of individual CMA and the 10 most significantly correlated plasma metabolites. Asterisks indicate statistical significance (Adjusted P < 0.05) based on Spearman correlation analysis. Cor.Coeff: Correlation coefficient. b Heatmap showing log2FC-based significantly different proteins on day 84 vs day 0 in the CMA and placebo groups. Asterisks indicate statistical significance based on paired Student’s t-test (P < 0.01). c Integrated multi-omics data based on network analysis represent the neighbours of the CMA, including serine, carnitine, nicotinamide and cysteine, and ADAS-Cog scores. Only analytes that were significantly altered in CMA on day 84 vs day 0 are highlighted
Fig. 5
Fig. 5
Structural magnetic resonance imaging analysis. a Increased cortical thickness (red-yellow) in the study group (P < 0.05) in the inferior parietal, lateral occipital and middle frontal and paracentral cortical regions based on the illustration of FreeSurfer's Qdec application. b Segmentation maps of the hippocampal subfields displayed on the sagittal (top), axial (middle), and coronal (bottom) planes. c Hippocampal subfield measurements showing increased volumes in the study group (P < 0.05) in the left mean hippocampal (upper left) and left hippocampal molecular layer (lower left) based on the FreeSurfer's Qdec application. Other sub-anatomic hippocampal regions iii) including left CA1 body (upper right) and iv) left whole hippocampal body (lower right) were not significant but near to a statistically significant level (P > 0.05)

Similar articles

Cited by

References

    1. Trujillo-Estrada L, Jimenez S, De Castro V, Torres M, Baglietto-Vargas D, Moreno-Gonzalez I, et al. In vivo modification of Abeta plaque toxicity as a novel neuroprotective lithium-mediated therapy for Alzheimer's disease pathology. Acta Neuropathol Commun. 2013;1:73. doi: 10.1186/2051-5960-1-73. - DOI - PMC - PubMed
    1. Nunomura A, Perry G. RNA and oxidative stress in Alzheimer’s disease: focus on microRNAs. Oxid Med Cell Longev. 2020;2020:2638130. doi: 10.1155/2020/2638130. - DOI - PMC - PubMed
    1. Lam S, Bayraktar A, Zhang C, Turkez H, Nielsen J, Boren J, et al. A systems biology approach for studying neurodegenerative diseases. Drug Discov Today. 2020;25(7):1146–1159. doi: 10.1016/j.drudis.2020.05.010. - DOI - PubMed
    1. Mielke JG, Taghibiglou C, Liu L, Zhang Y, Jia Z, Adeli K, et al. A biochemical and functional characterization of diet-induced brain insulin resistance. J Neurochem. 2005;93(6):1568–1578. doi: 10.1111/j.1471-4159.2005.03155.x. - DOI - PubMed
    1. Arnold SE, Arvanitakis Z, Macauley-Rambach SL, Koenig AM, Wang HY, Ahima RS, et al. Brain insulin resistance in type 2 diabetes and Alzheimer disease: concepts and conundrums. Nat Rev Neurol. 2018;14(3):168–181. doi: 10.1038/nrneurol.2017.185. - DOI - PMC - PubMed

Publication types

Associated data