

Hyperpolarized water through dissolution dynamic nuclear polarization with UV-generated radicals
- PMID: 36703471
- PMCID: PMC9814647
- DOI: 10.1038/s42004-020-0301-6
Hyperpolarized water through dissolution dynamic nuclear polarization with UV-generated radicals
Abstract
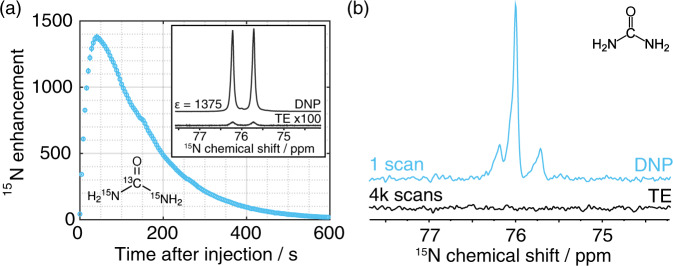
In recent years, hyperpolarization of water protons via dissolution Dynamic Nuclear Polarization (dDNP) has attracted increasing interest in the magnetic resonance community. Hyperpolarized water may provide an alternative to Gd-based contrast agents for angiographic and perfusion Magnetic Resonance Imaging (MRI) examinations, and it may report on chemical and biochemical reactions and proton exchange while perfoming Nuclear Magnetic Resonance (NMR) investigations. However, hyperpolarizing water protons is challenging. The main reason is the presence of radicals, required to create the hyperpolarized nuclear spin state. Indeed, the radicals will also be the main source of relaxation during the dissolution and transfer to the NMR or MRI system. In this work, we report water magnetizations otherwise requiring a field of 10,000 T at room temperature on a sample of pure water, by employing dDNP via UV-generated, labile radicals. We demonstrate the potential of our methodology by acquiring a 15N spectrum from natural abundance urea with a single scan, after spontaneous magnetization transfer from water protons to nitrogen nuclei.
© 2020. The Author(s).
Conflict of interest statement
The authors declare no competing interest.
Figures

Similar articles
-
Inversion of Hyperpolarized 13C NMR Signals through Cross-Correlated Cross-Relaxation in Dissolution DNP Experiments.J Phys Chem B. 2022 Jun 23;126(24):4599-4610. doi: 10.1021/acs.jpcb.2c03375. Epub 2022 Jun 8. J Phys Chem B. 2022. PMID: 35675502 Free PMC article.
-
Nuclear Overhauser spectroscopy in hyperpolarized water - chemical vs. magnetic exchange.Chem Commun (Camb). 2022 Oct 18;58(83):11661-11664. doi: 10.1039/d2cc03735a. Chem Commun (Camb). 2022. PMID: 36169286 Free PMC article.
-
Signal enhancement of hyperpolarized 15 N sites in solution-increase in solid-state polarization at 3.35 T and prolongation of relaxation in deuterated water mixtures.NMR Biomed. 2022 Nov;35(11):e4787. doi: 10.1002/nbm.4787. Epub 2022 Jul 14. NMR Biomed. 2022. PMID: 35704397 Free PMC article.
-
Hyperpolarization via dissolution dynamic nuclear polarization: new technological and methodological advances.MAGMA. 2021 Feb;34(1):5-23. doi: 10.1007/s10334-020-00894-w. Epub 2020 Nov 13. MAGMA. 2021. PMID: 33185800 Review.
-
Use of dissolved hyperpolarized species in NMR: Practical considerations.Prog Nucl Magn Reson Spectrosc. 2020 Jun-Aug;118-119:74-90. doi: 10.1016/j.pnmrs.2020.03.002. Epub 2020 Apr 28. Prog Nucl Magn Reson Spectrosc. 2020. PMID: 32883450 Review.
Cited by
-
Primary Structure of Glycans by NMR Spectroscopy.Chem Rev. 2023 Feb 8;123(3):1040-1102. doi: 10.1021/acs.chemrev.2c00580. Epub 2023 Jan 9. Chem Rev. 2023. PMID: 36622423 Free PMC article. Review.
-
Detection of Protein-Ligand Interactions by 19F Nuclear Magnetic Resonance Using Hyperpolarized Water.J Phys Chem Lett. 2022 May 5;13(17):3819-3823. doi: 10.1021/acs.jpclett.2c00448. Epub 2022 Apr 24. J Phys Chem Lett. 2022. PMID: 35465675 Free PMC article.
-
Toward protein NMR at physiological concentrations by hyperpolarized water-Finding and mapping uncharted conformational spaces.Sci Adv. 2022 Aug 5;8(31):eabq5179. doi: 10.1126/sciadv.abq5179. Epub 2022 Aug 5. Sci Adv. 2022. PMID: 35930648 Free PMC article.
-
Unconventional Parahydrogen-Induced Hyperpolarization Effects in Chemistry and Catalysis: From Photoreactions to Enzymes.ACS Catal. 2025 Apr 4;15(8):6386-6409. doi: 10.1021/acscatal.4c07870. eCollection 2025 Apr 18. ACS Catal. 2025. PMID: 40270879 Free PMC article. Review.
-
Efficient Scavenging of TEMPOL Radical by Ascorbic Acid in Solution and Related Prolongation of 13C and 1H Nuclear Spin Relaxation Times of the Solute.Molecules. 2024 Feb 5;29(3):738. doi: 10.3390/molecules29030738. Molecules. 2024. PMID: 38338481 Free PMC article.
References
-
- Bloembergen N, Purcell EM, Pound RV. Relaxation effects in nuclear magnetic resonance absorption. Phys. Rev. 1948;73:679–712. doi: 10.1103/PhysRev.73.679. - DOI
-
- Weinberg I, Zimmerman JR. Concentration dependence of chemical exchange and nmr multiplet structure in water-ethanol mixtures. J. Chem. Phys. 1955;23:748–749. doi: 10.1063/1.1742090. - DOI
-
- Zimmerman JR, Brittin WE. Nuclear magnetic resonance studies in multiple phase system - lifetime of a water molecule in an adsorbing phase on silica gel. J. Phys. Chem.-Us. 1957;61:1328–1333. doi: 10.1021/j150556a015. - DOI
LinkOut - more resources
Full Text Sources
Other Literature Sources
