

Dehydration entropy drives liquid-liquid phase separation by molecular crowding
- PMID: 36703474
- PMCID: PMC9814391
- DOI: 10.1038/s42004-020-0328-8
Dehydration entropy drives liquid-liquid phase separation by molecular crowding
Abstract
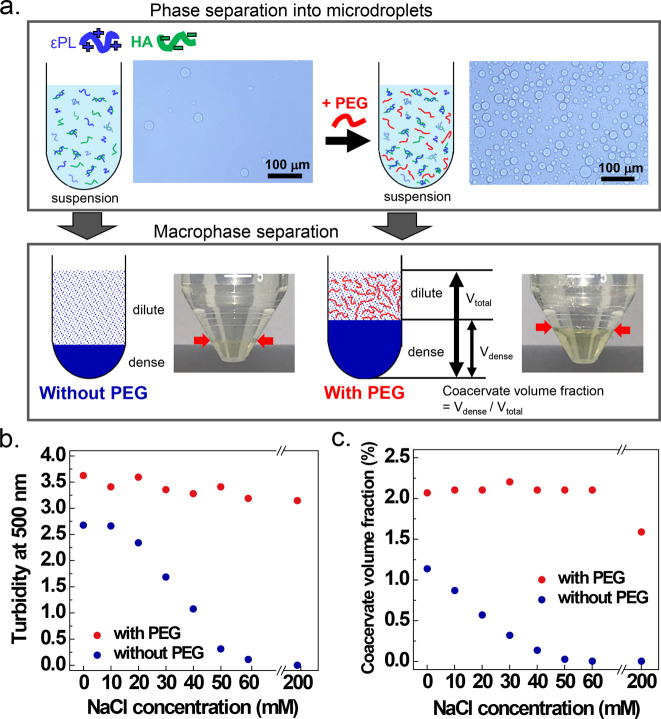
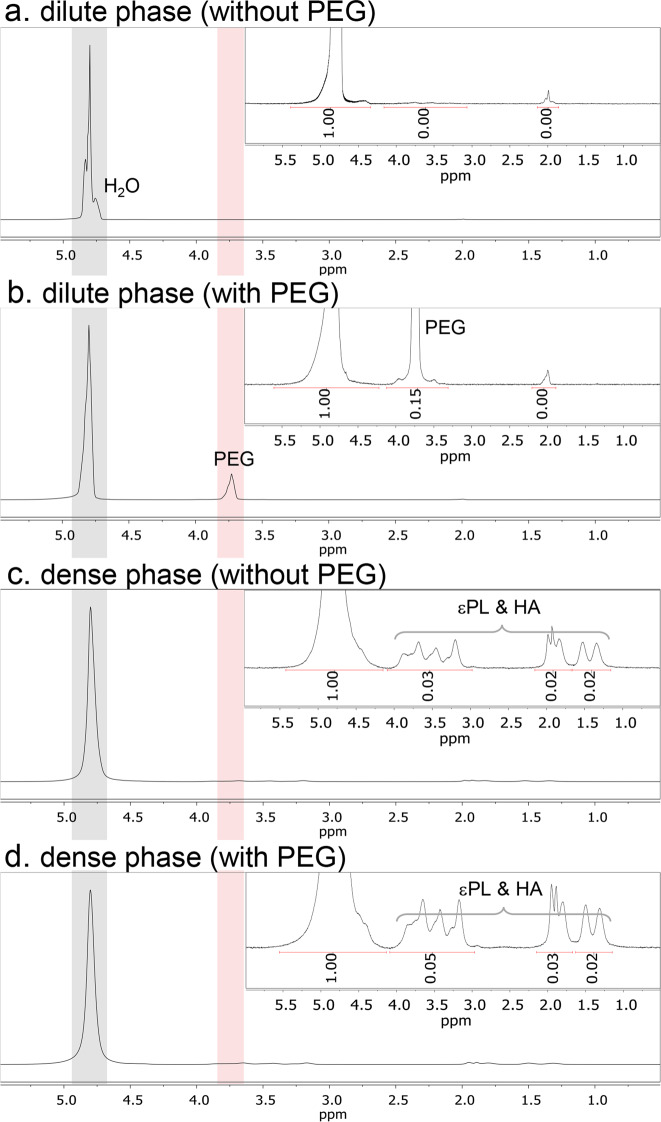
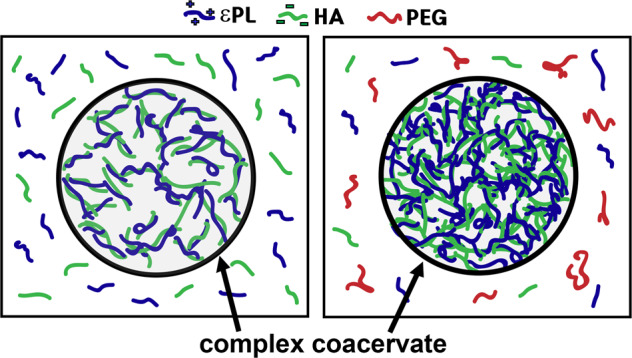
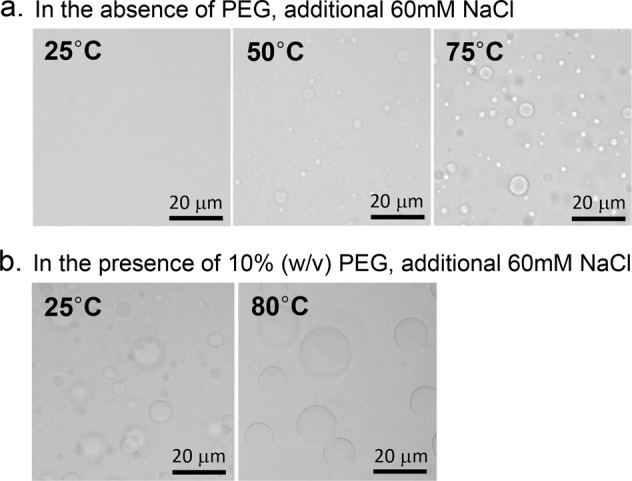
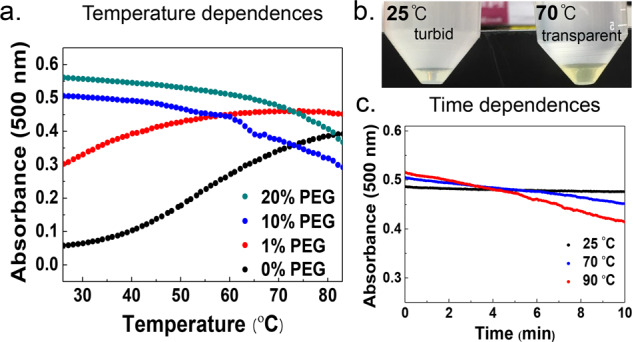
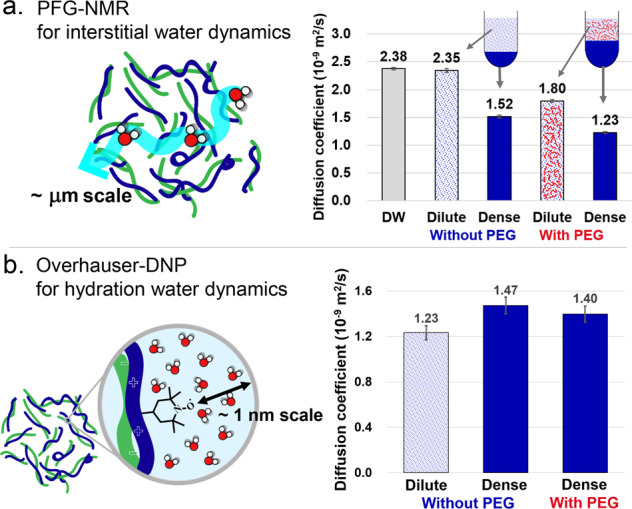
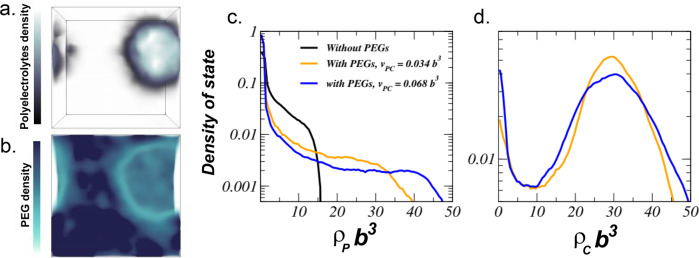
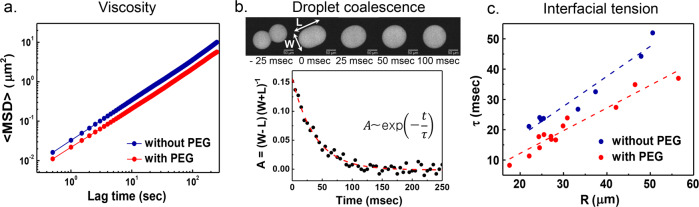
Complex coacervation driven liquid-liquid phase separation (LLPS) of biopolymers has been attracting attention as a novel phase in living cells. Studies of LLPS in this context are typically of proteins harboring chemical and structural complexity, leaving unclear which properties are fundamental to complex coacervation versus protein-specific. This study focuses on the role of polyethylene glycol (PEG)-a widely used molecular crowder-in LLPS. Significantly, entropy-driven LLPS is recapitulated with charged polymers lacking hydrophobicity and sequence complexity, and its propensity dramatically enhanced by PEG. Experimental and field-theoretic simulation results are consistent with PEG driving LLPS by dehydration of polymers, and show that PEG exerts its effect without partitioning into the dense coacervate phase. It is then up to biology to impose additional variations of functional significance to the LLPS of biological systems.
© 2020. The Author(s).
Conflict of interest statement
The authors declare no competing interests.
Figures
Similar articles
-
Understanding the Impacts of Molecular and Macromolecular Crowding Agents on Protein-Polymer Complex Coacervates.Biomacromolecules. 2023 Nov 13;24(11):4771-4782. doi: 10.1021/acs.biomac.3c00545. Epub 2023 Oct 10. Biomacromolecules. 2023. PMID: 37815312 Free PMC article.
-
Liquid-liquid phase separated microdomains of an amphiphilic graft copolymer in a surfactant-rich medium.J Colloid Interface Sci. 2022 Jun;615:807-820. doi: 10.1016/j.jcis.2022.02.020. Epub 2022 Feb 8. J Colloid Interface Sci. 2022. PMID: 35180629
-
Programmable Coacervate Droplets via Reaction-Coupled Liquid-Liquid Phase Separation (LLPS) and Competitive Inhibition.J Am Chem Soc. 2025 May 14;147(19):16027-16037. doi: 10.1021/jacs.4c17063. Epub 2025 Mar 20. J Am Chem Soc. 2025. PMID: 40112030
-
Liquid-Liquid Phase Separation in Crowded Environments.Int J Mol Sci. 2020 Aug 17;21(16):5908. doi: 10.3390/ijms21165908. Int J Mol Sci. 2020. PMID: 32824618 Free PMC article. Review.
-
Nonspecific characteristics of macromolecules create specific effects in living cells.Biophys Rev. 2020 Apr;12(2):425-434. doi: 10.1007/s12551-020-00673-w. Epub 2020 Mar 6. Biophys Rev. 2020. PMID: 32144739 Free PMC article. Review.
Cited by
-
Effects of Conformational Constraint on Peptide Solubility Limits.J Phys Chem B. 2022 Dec 15;126(49):10510-10518. doi: 10.1021/acs.jpcb.2c06458. Epub 2022 Nov 30. J Phys Chem B. 2022. PMID: 36450134 Free PMC article.
-
Structure-Property Relationships of Granular Hybrid Hydrogels Formed through Polyelectrolyte Complexation.Macromolecules. 2024 Mar 20;57(7):3190-3201. doi: 10.1021/acs.macromol.3c02335. eCollection 2024 Apr 9. Macromolecules. 2024. PMID: 38616812 Free PMC article.
-
Phase separation and molecular ordering of the prion-like domain of the Arabidopsis thermosensory protein EARLY FLOWERING 3.Proc Natl Acad Sci U S A. 2023 Jul 11;120(28):e2304714120. doi: 10.1073/pnas.2304714120. Epub 2023 Jul 3. Proc Natl Acad Sci U S A. 2023. PMID: 37399408 Free PMC article.
-
The key role of solvent in condensation: Mapping water in liquid-liquid phase-separated FUS.Biophys J. 2021 Apr 6;120(7):1266-1275. doi: 10.1016/j.bpj.2021.01.019. Epub 2021 Jan 28. Biophys J. 2021. PMID: 33515602 Free PMC article.
-
A Zn-dependent structural transition of SOD1 modulates its ability to undergo phase separation.EMBO J. 2023 Jan 16;42(2):e111185. doi: 10.15252/embj.2022111185. Epub 2022 Nov 23. EMBO J. 2023. PMID: 36416085 Free PMC article.
