

Green-production transitions and hazardous industrial discharge: A regional case study from China
- PMID: 36703513
- PMCID: PMC10450345
- DOI: 10.1177/00368504231152747
Green-production transitions and hazardous industrial discharge: A regional case study from China
Abstract
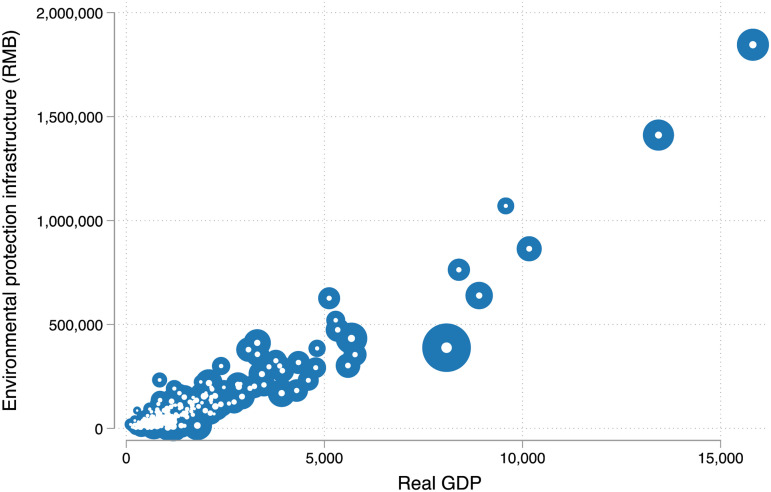
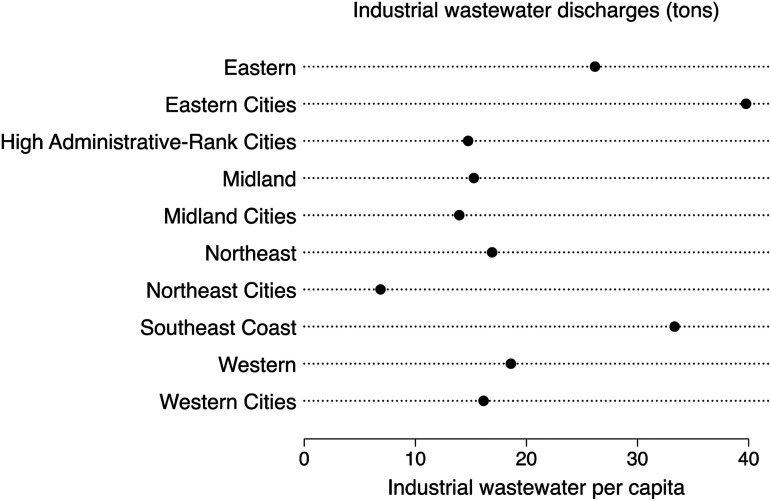
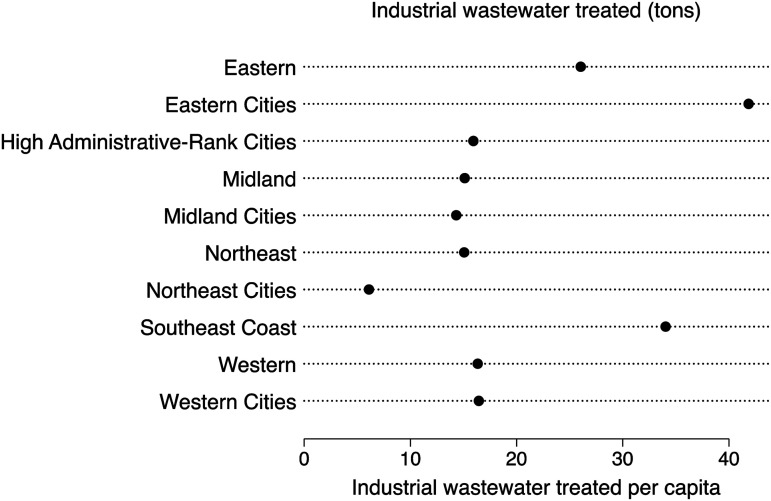
Green production, which reduces hazardous industrial discharges per unit output, is promoted throughout China. The Environmental Kuznets Curve suggests a negative correlation between hazardous industrial discharge and economic growth due to green innovation. This study expanded the EKC framework by including heterogeneity in evaluating the relationship between hazardous industrial discharges and economic growth to reflect green transformation. Administrative ranking disparity is identified as one of the fundamental driving forces of green production transition in a developing country. Building on an enriched EKC framework, we used a spatial estimation model to exclude spatial effects and obtained accurate estimates of the classified regions. The modified research method was used to examine whether industrial pollution has been reduced in 267 cities and towns in China from 2007 to 2021. Environmental protection performance was examined to estimate whether there is a switch to green manufacturing. As industrial hazards are of different types, the author sought to determine whether there was a decrease in industrial sulphur dioxide emissions, wastewater, solid waste, or dust, even though more industrial hazards were recycled than before. The spatial estimates indicated that (a) the national level of pollution remains positively linked with the total output, and every percentage of output growth increases sulphur dioxide emissions by 444.573 tons; (b) a positive relationship between economic growth and wastewater is altered by environmental protection in cities, while the general decoupling between economic growth and other types of industrial pollution, such as solid waste and industrial dust, was not observed; (c) growth in the southeast was decoupled from sulphur emissions, and its sulphur dioxide production per unit of output increased to 0.021 tons. Sulphur dioxide emissions per unit of economic growth along the southeast coast were 379. 048 tons, which was well below the overall average of 444.573 tons. High-income towns along the southeast coast have achieved clean production breakthroughs, realising a 15% reduction in industrial sulphur dioxide emissions by 2021. Although there were signs of a shift toward clean manufacturing in high administrative ranking cities, most regions of China are transitioning to environmentally friendly manufacturing and suffer from the hardships of green production transformation.
Keywords: SO2; administrative ranking; and spatial regression; green-production transition; industrial dust; industrial waste recycled; industrial wastewater.
Conflict of interest statement
The research findings presented in this study are included in the article and supplementary materials, and further enquiries can be directed to the author.
The author(s) declared no potential conflicts of interest with respect to the research, authorship, and/or publication of this article.
Figures


Similar articles
-
The Minderoo-Monaco Commission on Plastics and Human Health.Ann Glob Health. 2023 Mar 21;89(1):23. doi: 10.5334/aogh.4056. eCollection 2023. Ann Glob Health. 2023. PMID: 36969097 Free PMC article. Review.
-
Spatial correlation and influencing factors of industrial agglomeration and pollution discharges: a case study of 284 cities in China.Environ Sci Pollut Res Int. 2023 Jan;30(1):434-450. doi: 10.1007/s11356-022-22230-6. Epub 2022 Jul 28. Environ Sci Pollut Res Int. 2023. PMID: 35902516
-
Study on the interactive influence between economic growth and environmental pollution.Environ Sci Pollut Res Int. 2020 Nov;27(31):39442-39465. doi: 10.1007/s11356-020-10017-6. Epub 2020 Jul 10. Environ Sci Pollut Res Int. 2020. PMID: 32651783
-
Effect of green finance reform and innovation pilot zone on improving environmental pollution: an empirical evidence from Chinese cities.Environ Sci Pollut Res Int. 2023 Jun;30(30):75058-75077. doi: 10.1007/s11356-023-27657-z. Epub 2023 May 22. Environ Sci Pollut Res Int. 2023. PMID: 37211567
-
Can the Adjustment and Renovation Policies of Old Industrial Cities Reduce Urban Carbon Emissions?-Empirical Analysis Based on Quasi-Natural Experiments.Int J Environ Res Public Health. 2022 May 26;19(11):6453. doi: 10.3390/ijerph19116453. Int J Environ Res Public Health. 2022. PMID: 35682040 Free PMC article. Review.
Cited by
-
Special collections for applying artificial intelligence techniques to encourage economic growth and maintain sustainable societies.Sci Prog. 2024 Jan-Mar;107(1):368504231223625. doi: 10.1177/00368504231223625. Sci Prog. 2024. PMID: 38312028 Free PMC article.
References
-
- Sun J, Wang J, Wang T, et al.Urbanization, economic growth, and environmental pollution. Manag Environ Qual.: An International Journal 2019; 30: 483–494.
-
- Xie Q, Xu X, Liu X. Is there an EKC between economic growth and smog pollution in China? New evidence from semiparametric spatial autoregressive models. J Clean Prod 2019; 220: 873–883.
-
- Soltmann C, Stucki T, Woerter M. The impact of environmentally friendly innovations on value added. E R E 2015; 62: 457–479.
-
- Kaika D, Zervas E. The Environmental Kuznets Curve (EKC) theory-part A: concept, causes and the CO2 emissions case. Energy Policy 2013; 62: 1392–1402.
-
- Nigatu G. The level of pollution and the economic growth factor: a nonparametric approach to environmental Kuznets curve. Quant Econ 2015; 13: 147–159.
LinkOut - more resources
Full Text Sources
Research Materials
