. 2023 Jun;43(6):947-961.
doi: 10.1177/0271678X231153723. Epub 2023 Jan 26.

Alpha-adrenergic receptor activation after fetal hypoxia-ischaemia suppresses transient epileptiform activity and limits loss of oligodendrocytes and hippocampal neurons

Affiliations

Alpha-adrenergic receptor activation after fetal hypoxia-ischaemia suppresses transient epileptiform activity and limits loss of oligodendrocytes and hippocampal neurons

Simerdeep K Dhillon et al. J Cereb Blood Flow Metab. 2023 Jun.

Abstract

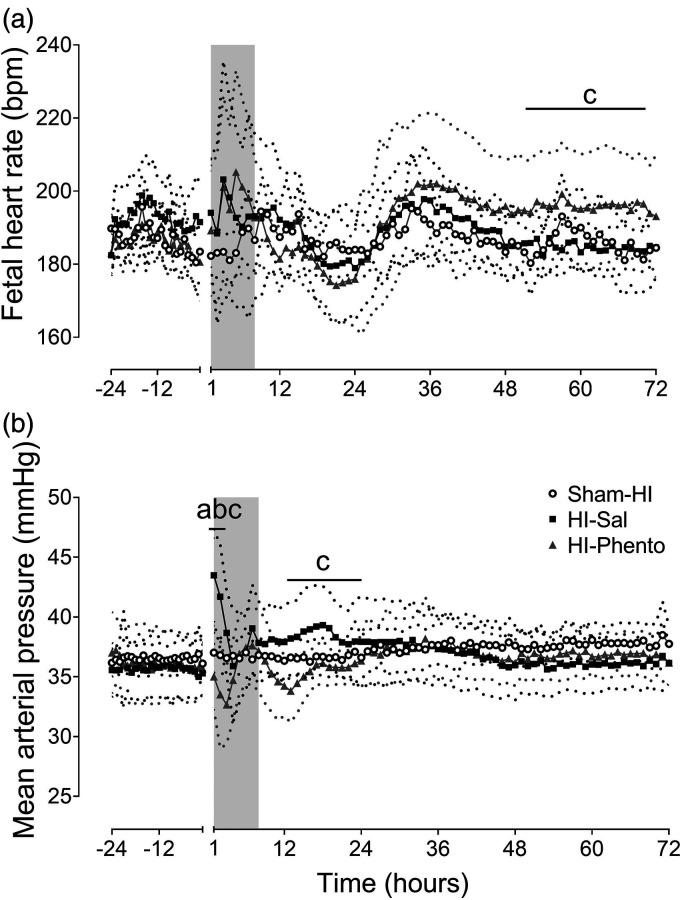
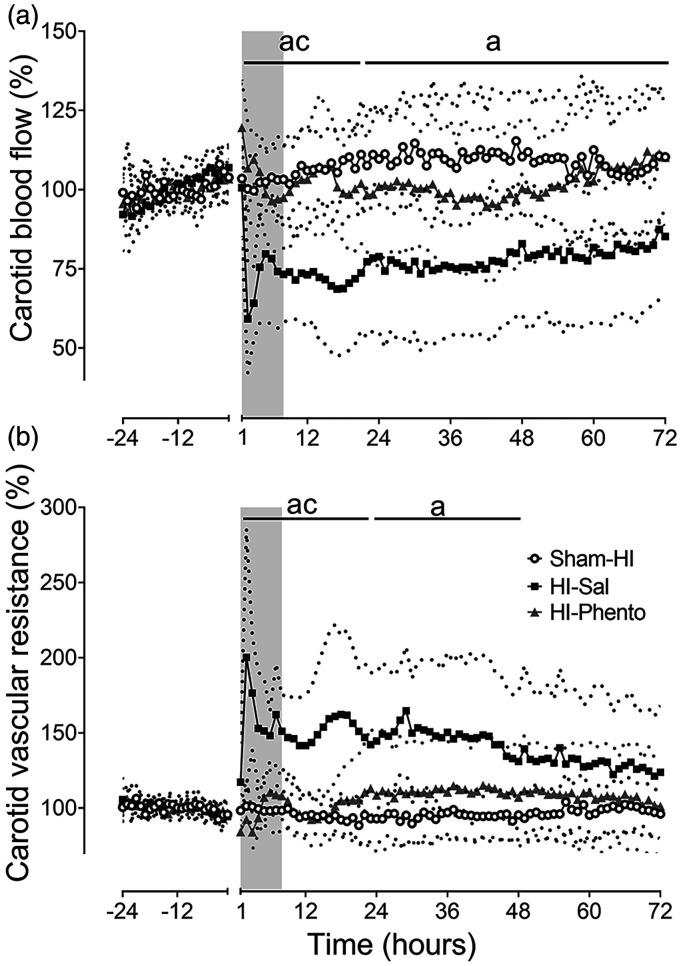
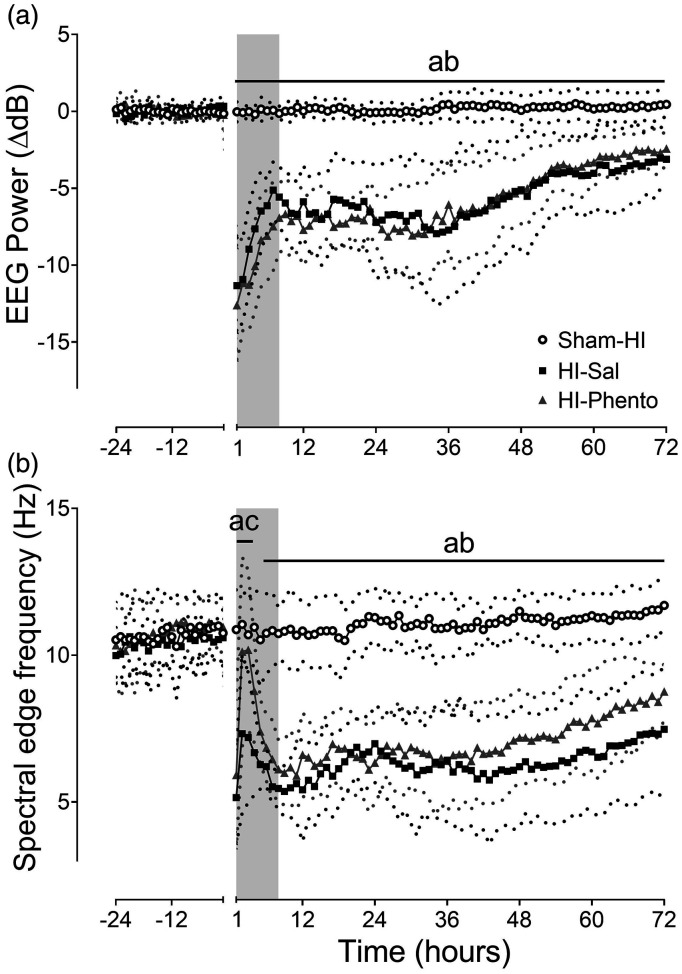
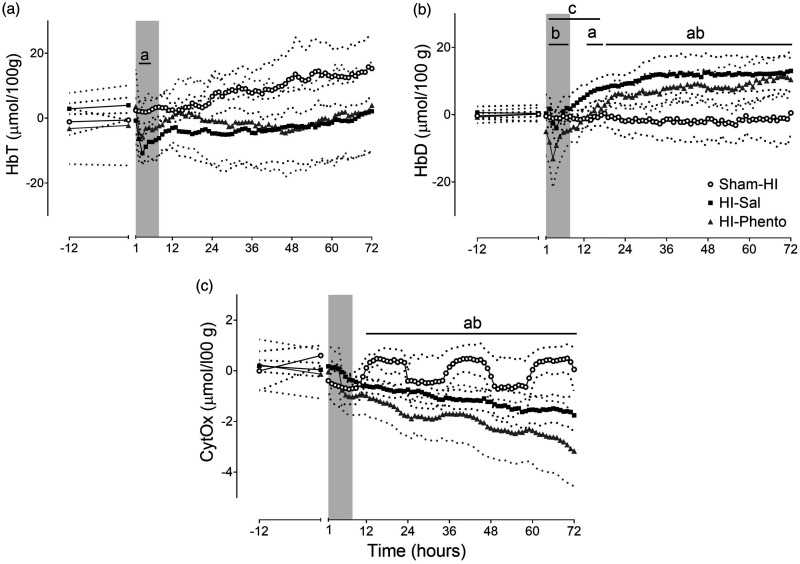
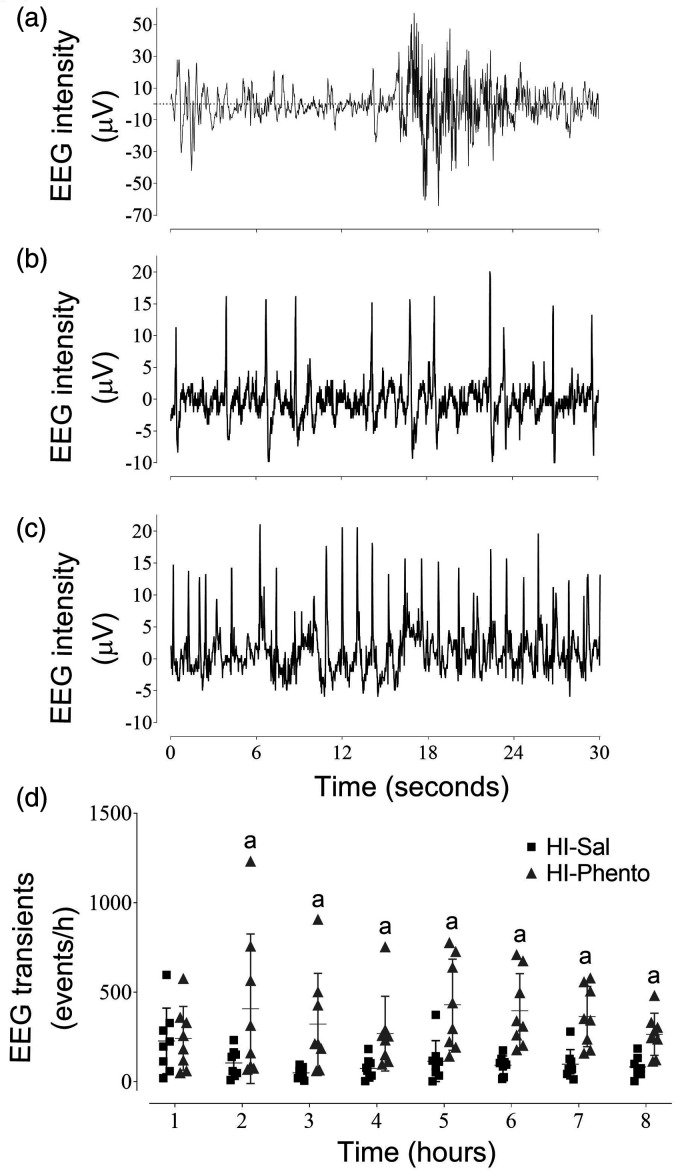
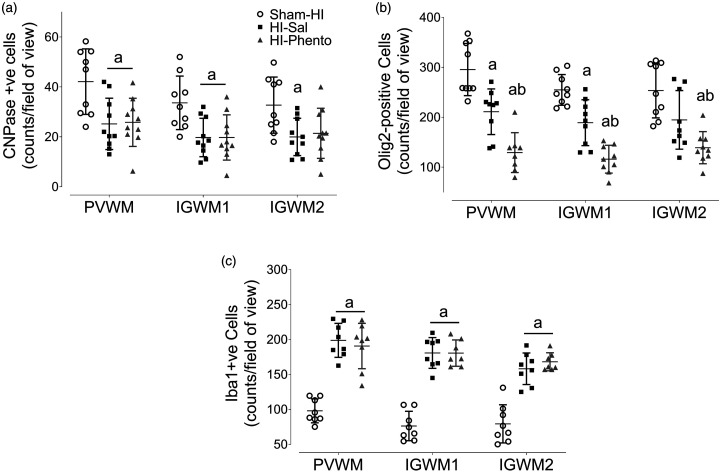
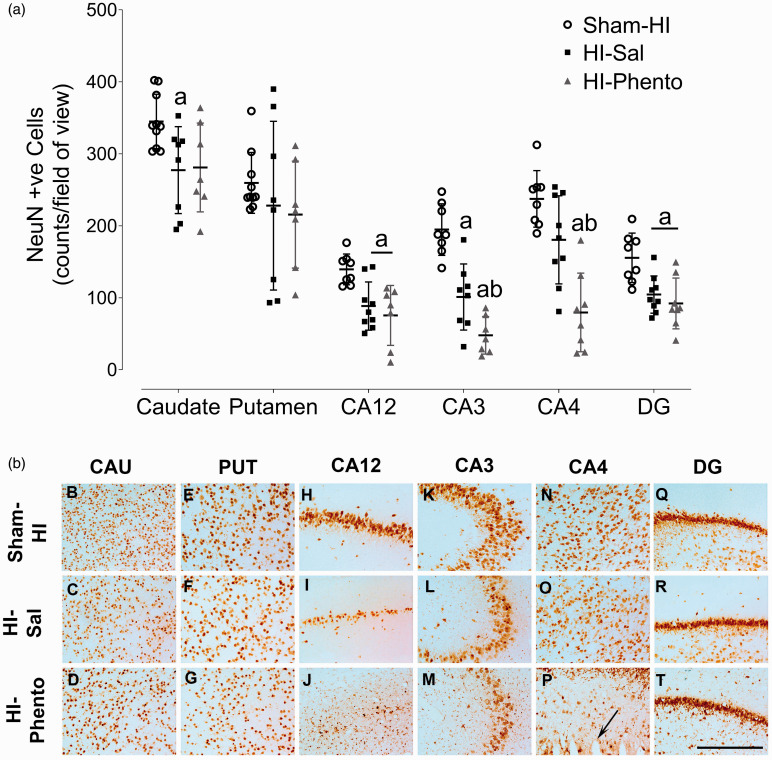
Exposure to hypoxic-ischaemia (HI) is consistently followed by a delayed fall in cerebral perfusion. In preterm fetal sheep this is associated with impaired cerebral oxygenation, consistent with mismatch between perfusion and metabolism. In the present study we tested the hypothesis that alpha-adrenergic inhibition after HI would improve cerebral perfusion, and so attenuate mismatch and reduce neural injury. Chronically instrumented preterm (0.7 gestation) fetal sheep received sham-HI (n = 10) or HI induced by complete umbilical cord occlusion for 25 minutes. From 15 minutes to 8 hours after HI, fetuses received either an intravenous infusion of a non-selective alpha-adrenergic antagonist, phentolamine (10 mg bolus, 10 mg/h infusion, n = 10), or saline (n = 10). Fetal brains were processed for histology 72 hours post-HI. Phentolamine infusion was associated with increased epileptiform transient activity and a greater fall in cerebral oxygenation in the early post-HI recovery phase. Histologically, phentolamine was associated with greater loss of oligodendrocytes and hippocampal neurons. In summary, contrary to our hypothesis, alpha-adrenergic inhibition increased epileptiform transient activity with an exaggerated fall in cerebral oxygenation, and increased neural injury, suggesting that alpha-adrenergic receptor activation after HI is an important endogenous neuroprotective mechanism.

Keywords: Hypoxia-ischaemia; cerebral hypoperfusion; neural injury; neuro-inhibition; sympathetic nervous system.


Conflict of interest statement

The author(s) declared no potential conflicts of interest with respect to the research, authorship, and/or publication of this article.

Figures

Figure 1.
Figure 1.
Post-occlusion cardiovascular changes. Time sequence of changes in fetal heart rate (bpm, Panel A) and mean arterial pressure (mmHg, Panel B) during 24 hours before umbilical cord occlusion and 72 hours of post-HI recovery in the sham-HI (open circles, n = 8), HI-saline (closed squares, n = 8) and HI-phentolamine (grey triangles, n = 8) groups. Data during umbilical cord occlusion are not shown here. The shaded area is the period of phentolamine infusion. Data are hourly averages presented as mean ± SD (SD is shown as dotted lines), and were analysed using mixed-design ANOVA with time as a repeated measure and HI and phentolamine as independent factors. Between group comparisons were performed using the Sidak post hoc test. Figure symbols are (a) sham-HI vs. HI-saline P < 0.05, (b) sham-HI vs. HI-phentolamine P < 0.05 and (c) HI-saline vs. HI-phentolamine P < 0.05.
Figure 2.
Figure 2.
Post-occlusion cerebral blood flow changes. Time sequence of changes in carotid blood flow (% baseline, Panel A) and carotid vascular resistance (% baseline, Panel B) during 24 hours before umbilical cord occlusion and 72 hours of post-HI recovery in the sham-HI (open circles, n = 8), HI-saline (closed squares, n = 8) and HI-phentolamine (grey triangles, n = 8) groups. Data during umbilical cord occlusion are not shown here. The shaded area is the period of phentolamine infusion. Data are hourly averages presented as mean ± SD (SD is shown as dotted lines), and were analysed using mixed-design ANOVA with time as a repeated measure and HI and phentolamine as independent factors. Between group comparisons were performed using the Sidak post hoc test. Figure symbols are (a) sham-HI vs. HI-saline P < 0.05, (b) sham-HI vs. HI-phentolamine P < 0.05 and (c) HI-saline vs. HI-phentolamine P < 0.05.
Figure 3.
Figure 3.
Post-occlusion neurophysiological recovery. Time sequence of changes in EEG power (normalised to baseline ΔdB, Panel A), spectral edge frequency (Hz, Panel B) during 24 hours before umbilical cord occlusion and 72 hours of post-HI recovery in the sham-HI (open circles, n = 10), HI-saline (closed squares, n = 10) and HI-phentolamine (grey triangles, n = 10) groups. Data during umbilical cord occlusion are not shown here. The shaded area is the period of phentolamine infusion. Data are hourly averages presented as mean ± SD (SD is shown as dotted lines), and were analysed using mixed-design ANOVA with time as repeated measure and HI and phentolamine as independent factors. Between group comparisons were performed using the Sidak post hoc test. Figure symbols are (a) sham-HI vs. HI-saline P < 0.05, (b) sham-HI vs. HI-phentolamine P < 0.05 and (c) HI-saline vs. HI-phentolamine P < 0.05.
Figure 4.
Figure 4.
Cerebral oxygenation after HI. Time sequence of changes HbT (µmol/100 g, Panel A), HbD (µmol/100 g, Panel B) and CytOx (µmol/100 g, Panel C) during 12 hours before HI and 72 hours post-HI recovery in the sham-HI (open circles, n = 5), HI-saline (closed squares, n = 8) and HI-phentolamine (grey triangles, n = 5) groups. The shaded area is the period of phentolamine infusion. Data are hourly averages presented as mean ± SD (SD is shown as dotted lines), and were analysed using mixed-design ANOVA with time as a repeated measure and HI and phentolamine as independent factors. Between group comparisons were performed using the Sidak post hoc test. Figure symbols are (a) sham-HI vs. HI-saline P < 0.05, (b) sham-HI vs. HI-phentolamine P < 0.05 and (c) HI-saline vs. HI-phentolamine P < 0.05.
Figure 5.
Figure 5.
Examples of continuous EEG recordings. EEG recordings from individual fetuses in the sham-HI (Panel A), HI-saline (Panel B) and HI-phentolamine (Panel C) groups at 2 hours after HI. Hourly epileptiform transients counts during the first 8 hours post-HI in the HI-saline (closed squares, n = 8) and HI-phentolamine (grey triangles, n = 8) groups (Panel D). Data are presented as individual animals (the central bar mean ± SD). Figure symbol is (a) HI-saline vs. HI-phentolamine P < 0.05.
Figure 6.
Figure 6.
White matter immunohistochemistry. Cell density of immature and mature oligodendrocyte (CNPase, Panel A; Sham-HI n = 9, HI-Sal n = 10, HI-Phento n = 10), total oligodendrocytes (Olig2, Panel B; Sham-HI n = 9, HI-Sal n = 9, HI-Phento n = 9) and microglia and macrophages (Iba1, Panel C; Sham-HI n = 8, HI-Sal n = 8, HI-Phento n = 8) in the white matter areas of periventricular, and parasagittal intragyral areas in the sham-HI (open circles), HI-saline (closed squares), and HI-phentolamine (grey triangles) groups at 72 hours after 25 minutes of umbilical cord occlusion. Data are presented as individual animals (the central bar mean ± SD), and analysed using mixed design two-way ANOVA with regions as repeated measures and HI and phentolamine as independent variables. Comparisons between the groups were performed using the Sidak post hoc test. Figure symbols are (a) P < 0.05 vs. sham-HI, (b) P < 0.05 vs. HI-saline. PVWM: periventricular white matter, IGWM: intragyral white matter.
Figure 7.
Figure 7.
Neuronal survival. Cell density of neurons (labelled with NeuN, Panel A) in caudate nucleus, putamen, CA12, CA3, CA4 and DG of the hippocampus in sham-HI (open circles, n = 10), HI-saline (closed squares, n = 9) and HI-phentolamine (grey triangles, n = 8) groups at 72 hours after 25 minutes of umbilical cord occlusion. Data are presented as individual animals, (central bar is mean ± SD). Data was analysed using two-way ANOVA with region as a repeated measure and HI and phentolamine as independent factors. Comparisons between the groups in each region were performed using the Sidak post hoc test. Figure symbols are (a) P < 0.05 vs. sham-HI and (b) P < 0.05 vs. HI-saline. CA: cornu amnonis, DG: dentate gyrus. Photomicrographs of neurons (NeuN-positive cells) in the striatal caudate nucleus (caudate, panel B-D), putamen (panel E–G), CA1/2 (panel H–J), CA3 (panel K-M), CA4 (panel N-P) and dentate gyrus (DG, panel Q-T), of the hippocampus of sham-HI, HI-saline and HI-phentolamine groups at 72 hours post-HI. Scale bar is 50 µm.

Similar articles

Cited by

References

    1. Sarda SP, Sarri G, Siffel C.Global prevalence of long-term neurodevelopmental impairment following extremely preterm birth: a systematic literature review. J Int Med Res 2021; 49: 030006052110280. - PMC - PubMed
    1. Manuck TA, Rice MM, Bailit JL, et al.. Preterm neonatal morbidity and mortality by gestational age: a contemporary cohort. Am J Obstet Gynecol 2016; 215: 103.e1–e14. - PMC - PubMed
    1. Dhillon SK, Lear CA, Galinsky R, et al.. The fetus at the tipping point: modifying the outcome of fetal asphyxia. J Physiol 2018; 596: 5571–5592. - PMC - PubMed
    1. Dhillon SK, Gunn ER, Lear BA, et al.. Cerebral oxygenation and metabolism after hypoxia-iFront pharmacolschemia. Front Pediatr 2022; 10: 925951. - PMC - PubMed
    1. Jensen EC, Bennet L, Hunter CJ, et al.. Post-hypoxic hypoperfusion is associated with suppression of cerebral metabolism and increased tissue oxygenation in near-term fetal sheep. J Physiol 2006; 572: 131–139. - PMC - PubMed

Publication types

LinkOut - more resources