. 2023 Apr;10(10):e2207693.
doi: 10.1002/advs.202207693. Epub 2023 Jan 26.

Transferrin Receptor-Mediated Iron Uptake Promotes Colon Tumorigenesis

Affiliations

Transferrin Receptor-Mediated Iron Uptake Promotes Colon Tumorigenesis

Hyeoncheol Kim et al. Adv Sci (Weinh). 2023 Apr.

Abstract

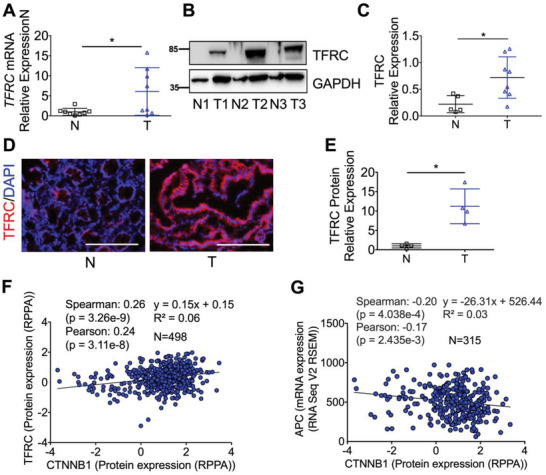
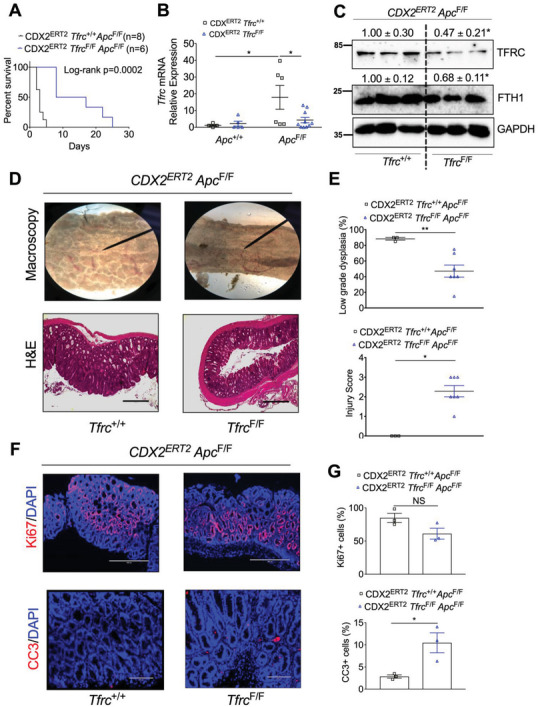
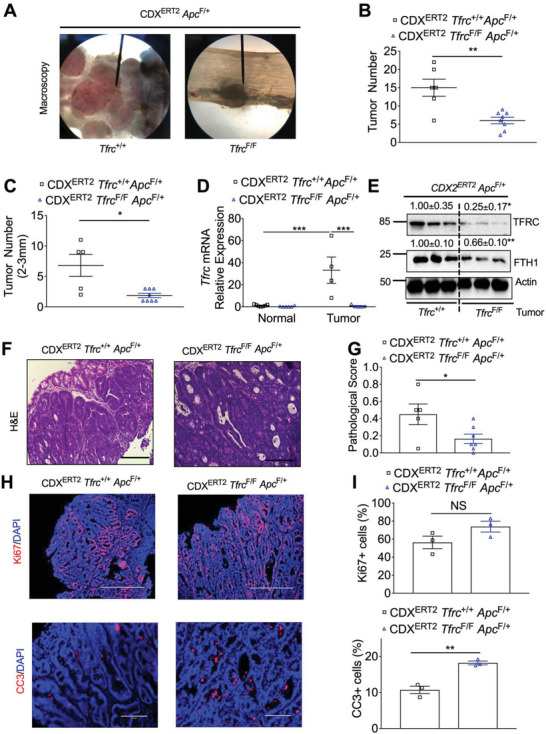
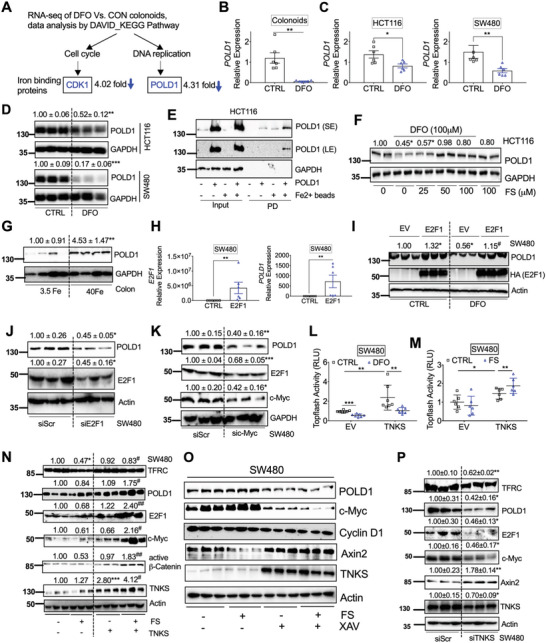
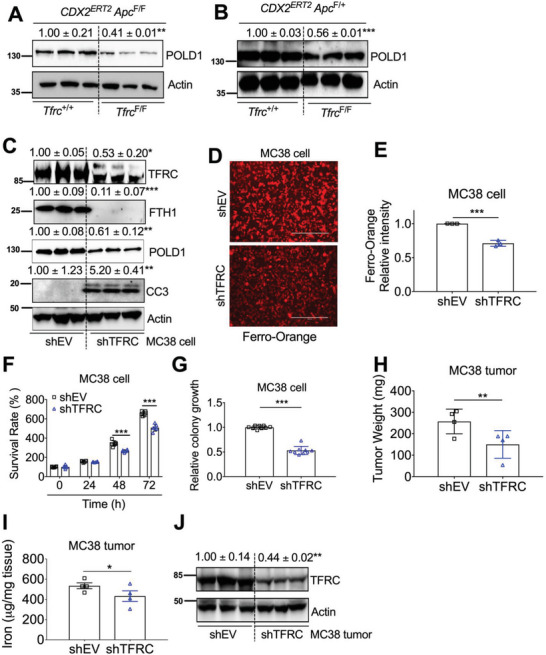
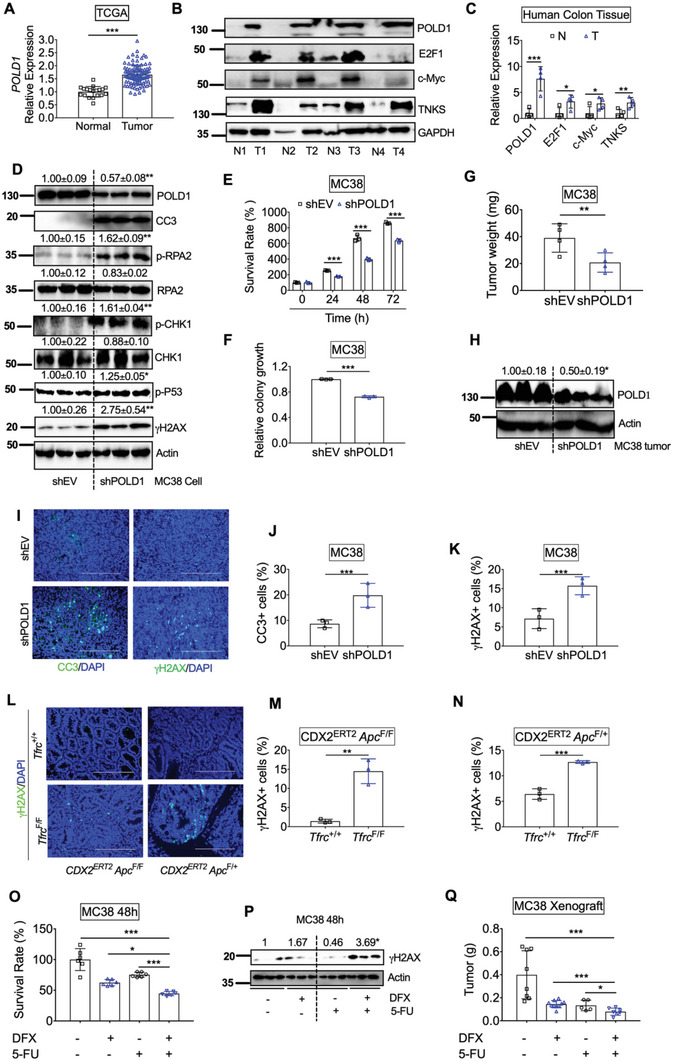
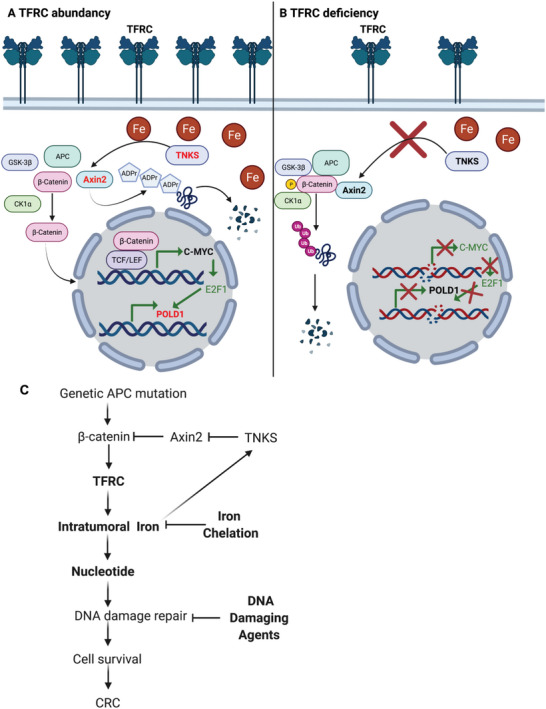
Transferrin receptor (TFRC) is the major mediator for iron entry into a cell. Under excessive iron conditions, TFRC is expected to be reduced to lower iron uptake and toxicity. However, the mechanism whereby TFRC expression is maintained at high levels in iron-enriched cancer cells and the contribution of TFRC to cancer development are enigmatic. Here the work shows TFRC is induced by adenomatous polyposis coli (APC) gene loss-driven β-catenin activation in colorectal cancer, whereas TFRC-mediated intratumoral iron accumulation potentiates β-catenin signaling by directly enhancing the activity of tankyrase. Disruption of TFRC leads to a reduction of colonic iron levels and iron-dependent tankyrase activity, which caused stabilization of axis inhibition protein 2 (AXIN2) and subsequent repression of the β-catenin/c-Myc/E2F Transcription Factor 1/DNA polymerase delta1 (POLD1) axis. POLD1 knockdown, iron chelation, and TFRC disruption increase DNA replication stress, DNA damage response, apoptosis, and reduce colon tumor growth. Importantly, a combination of iron chelators and DNA damaging agents increases DNA damage response and reduces colon tumor cell growth. TFRC-mediated iron import is at the center of a novel feed-forward loop that facilitates colonic epithelial cell survival. This discovery may provide novel strategies for colorectal cancer therapy.

Keywords: DNA damage response; TFRC; colon; iron; β-catenin.


Conflict of interest statement

C.A.L. has received consulting fees from Astellas Pharmaceuticals and Odyssey Therapeutics and is an inventor on patents pertaining to Kras regulated metabolic pathways, redox control pathways in cancer, and targeting the GOT1‐pathway as a therapeutic approach.

Figures

Figure 1
Figure 1
TFRC is increased in human CRC and is positively correlated with the CTNNB1 protein expression. Detection of TFRC expression in human normal (n = 5–8) and tumor (n = 8) colon tissues by A) qPCR analysis, B) immunoblotting analysis and (C) quantification, and D) immunofluorescence staining and E) quantification. F,G) Correlation analysis using TCGA colorectal adenocarcinoma Firehose legacy dataset from cBioPortal platform. Scale bar = 200 µm. *p < 0.05 and **p < 0.01. Student t‐test.
Figure 2
Figure 2
TFRC disruption prolongs mouse survival and reduces low‐grade dysplasia caused by biallelic Apc loss. A) Survival curve in CDX2ERT2 Tfrc F/F Apc F/F mice (n = 8) and CDX2ERT2 Tfrc +/+ Apc F/F mice (n = 6) treated with 100 mg kg−1 TAM for 3 days and 1.5% DSS for 7 days. B) qPCR analysis, C) immunoblotting analysis, D) macroscopic and H&E staining images, E) histological scores, F) IF staining, and G) quantification of colons from CDX2ERT2 Tfrc F/F Apc F/F mice (n = 3–10) and control mice (n = 3–6) treated with 100 mg kg−1 TAM for 3 days and euthanized 7 days later. Scale bar = 200 µm (CC3 staining) or 400 µm (HE and Ki67 staining). *p < 0.05 and **p < 0.01. NS, not significant. Values above blots are mean ± S.D.
Figure 3
Figure 3
TFRC depletion reduces colon tumorigenesis. A) Macroscopic images, B) total tumor number, C) tumor number at sizes of 2–3 mm, D) qPCR analysis, E) immunoblotting analysis, F–I) histological staining and quantification of colons from CDX2ERT2 Tfrc F/F Apc F/+ mice (n = 3–9) and CDX2ERT2 Tfrc +/+ Apc F/+ mice (n = 3–7) treated with TAM (100 mg kg−1) for 3 days and 2 cycles of DSS (2%) for 7 days with an interval of 14 days regular water. Scale bar = 200 µm (HE and CC3 staining) or 400 µm (Ki67 staining). *p < 0.05, **p < 0.01, and ***p < 0.001. NS, not significant. Values above blots are mean ± S.D.
Figure 4
Figure 4
The DNA polymerase POLD1 is regulated by iron/TNKS/Axin2/c‐Myc/E2F1 axis. A) RNA‐seq analysis followed by DAVID bioinformatics analysis and KEGG pathway enrichment identified decreased expression of the iron binding proteins CDK1 in the cell cycle pathway and POLD1 in the DNA replication pathway after DFO treatment in colonoids. Tumor colonoids were treated with DFO (0 or 100 µm) in KGMG medium for 4 days. qPCR analysis of mRNA expression of POLD1 in (B) colonoids, C) HCT116 and SW480 after DFO treatment. D) Immunoblotting blot analysis in colon derived HCT116 or SW480 cancer cells following DFO (100 µm) treatment. E) Immunoblotting analysis of proteins pulled down (PD) by Fe2+ or empty beads in HCT116 cells. F) Immunoblotting analysis of HCT116 cells treated with or without DFO (100 µm) and/or different doses of FS. G) Immunoblotting analysis of POLD1 expression in colons from C57BL/6 mice (n = 4) treated with 3.5 or 40 Fe. H) qPCR analysis of SW480 cells transfected with E2F1. I) Immunoblotting analysis of SW480 cells transfected with E2F1 and treated with or without DFO (100 µm). Immunoblotting analysis in SW480 cells transfected with J) siE2F1, K) siMYC or a scrambled control (siScr) for 24 h. Topflash luciferase assay in SW480 cells transfected with TNKS or empty vector (EV) for 24 h and then treated with L) DFO (100 µm) or M) FS (100 µm) for an additional 24 h. N) Immunoblotting analysis of SW480 cells transfected with TNKS for 24 h and then treated with FS (100 µm) for overnight. O) Immunoblotting analysis of SW480 cells treated with FS (100 µm) and TNKS inhibitor XAV939 (10 µm) for overnight. P) Immunoblotting blot analysis in SW480 transfected siScr or TNKS siRNA. *p < 0.05, **p < 0.01, and ***p < 0.001 compared with untreated control (CTRL), 3.5 Fe or siScr. #p < 0.05 and ##p < 0.01 compared with DFO or FS. Values above blots are either mean or mean ± S.D.
Figure 5
Figure 5
TFRC depletion causes decreased iron, POLD1 and tumor growth. Immunoblotting analysis in (A) dysplastic colons from CDX2ERT2 Tfrc F/F Apc F/F and CDX2ERT2 Tfrc +/+ Apc F/F mice (n = 3). B) Colon tumors from CDX2ERT2 Tfrc F/F Apc F/+ and CDX2ERT2 Tfrc +/+ Apc F/+ mice (n = 3). C) Immunoblotting analysis, D) Ferro‐Orange staining and E) quantification, F) MTT assay, G) colony formation assay in MC38 cells with or without TFRC knockdown. H) Tumor weight, I) tumor iron levels, and J) immunoblotting analysis of tumor xenografts from MC38 cells with or without TFRC knockdown (n = 3–4). *p < 0.05, **p < 0.01, and ***p < 0.001 compared with Tfrc +/+ mice or shEV. Values above blots are mean ± S.D.
Figure 6
Figure 6
POLD1 inhibition leads to increased DNA replication stress and impaired tumor growth. A) Gene expression of POLD1 in colons from TCGA database. B) Immunoblotting analysis and C) quantification of protein expression in human normal and tumor colons (n = 4). D) Immunoblotting analysis, E) MTT assay and F) colony formation assay in MC38 cells with or without stable POLD1 knockdown. G) Tumor weight, H) Immunoblotting analysis, I) immunofluorescence staining, quantification of J) CC3 and K) γH2AX staining in tumor xenografts from MC38 cells with or without POLD1 knockdown (n = 3). L) γH2AX staining and quantification of M) dysplastic colon tissues from CDX2ERT2 Tfrc F/F Apc F/F and CDX2ERT2 Tfrc +/+ Apc F/F mice (n = 3) and N) colon tumor tissues from CDX2ERT2 Tfrc F/F Apc F/+ and CDX2ERT2 Tfrc +/+ Apc F/+ mice (n = 3). O) MTT assay and P) Immunoblotting analysis in MC38 cells treated with DFX (10 µ m) and/or 5‐FU (10 µ m) for 48 h. Q) tumor weight for xenografts from MC38 cells treated with DFX and/or 5‐FU (n = 5–10). *p < 0.05, **p < 0.01, and ***p < 0.001. NS, not significant. Values above blots are either mean or mean ± S.D.
Figure 7
Figure 7
Working model. A) TFRC‐mediated iron uptake in colon tumors is required for maintaining the activity of metal‐dependent TNKS, which causes poly‐ADP‐ribosylation and degradation of Axin2, and activation of β‐catenin/c‐Myc/E2F1/POLD1 signaling. B) TFRC deficiency‐caused low iron status leads to decreased TNKS activity, stabilized Axin2, β‐catenin phosphorylation and degradation, suppressed c‐Myc/E2F1/POLD1 transcription, increased DNA replicative stress, DNA damage and subsequent cell apoptosis. C) TFRC is induced by active β‐catenin signaling due to genetic APC mutation, whereas TFRC‐mediated intratumorally iron accumulation potentiates β‐catenin signaling via directly enhancing the activity of TNKS. TFRC‐mediated iron import is at the center of this feed‐forward loop to facilitate tumor cell survival via supplying nucleotides for DNA damage repair in CRC. Combination of iron chelation and DNA damaging agents increases DNA damage and suppresses cell growth in CRC.

References

    1. Siegel R. L., Miller K. D., Fuchs H. E., Jemal A., CA Cancer J. Clin. 2021, 71, 7. - PubMed
    1. Soerjomataram I., Bray F., Nat. Rev. Clin. Oncol. 2021, 18, 663. - PubMed
    1. Cross A. J., Ferrucci L. M., Risch A., Graubard B. I., Ward M. H., Park Y., Hollenbeck A. R., Schatzkin A., Sinha R., Cancer Res. 2010, 70, 2406. - PMC - PubMed
    1. Oates P. S., West A. R., World J. Gastroenterol. 2006, 12, 4281. - PMC - PubMed
    1. Bastide N. M., Chenni F., Audebert M., Santarelli R. L., Taché S., Naud N., Baradat M., Jouanin I., Surya R., Hobbs D. A., Kuhnle G. G., Letron I. R., Gueraud F., Corpet D. E., Pierre F. H. F., Cancer Res. 2015, 75, 870. - PubMed

Publication types

LinkOut - more resources