

A novel cuproptosis-related prognostic gene signature and validation of differential expression in hepatocellular carcinoma
- PMID: 36703728
- PMCID: PMC9871247
- DOI: 10.3389/fphar.2022.1081952
A novel cuproptosis-related prognostic gene signature and validation of differential expression in hepatocellular carcinoma
Abstract
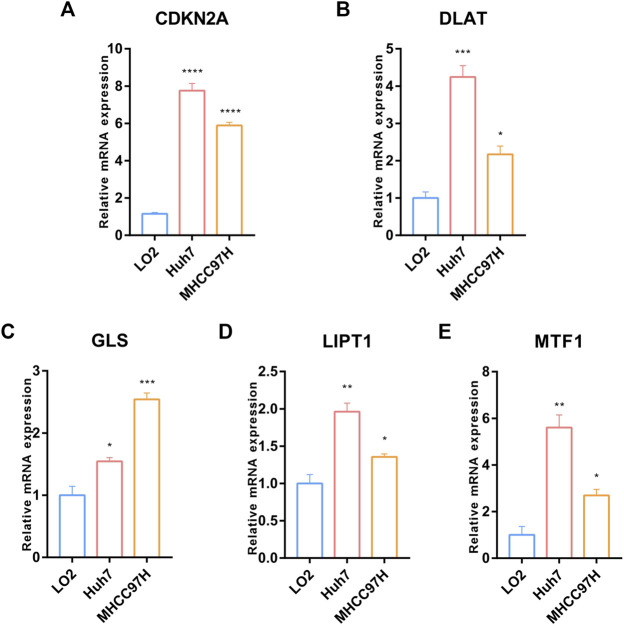
Background: Cuproptosis is a newly discovered form of programmed cell death, which is characterized by accumulation of intra-cellular copper ion leading to the aggregation of lipoproteins and destabilization of Fe-S cluster proteins in mitochondrial metabolism, thereby affecting the prognosis of patients with cancer. However, the role of cuproptosis-related genes (CRGs) in hepatocellular carcinoma (HCC) remains elusive. Methods: Mutation signature, copy number variation and the expression of 10 CRGs were assessed in HCC from TCGA-LIHC dataset. ICGC-LIRI-JP dataset was used as further validation cohort. The least absolute shrinkage and selection operator (LASSO) was used to construct the prognostic model. Kaplan Meier curves, time-ROC curves, nomogram, univariate and multivariate Cox regression were utilized to evaluate the predictive efficacy of CRGs-score. Immune infiltration was analyzed by CIBERSOFT, ssGSEA algorithm, and TIMER database. The expression of prognostic CRGs was validated by qPCR both in-vitro and in-vivo. Drug sensitivity analysis was performed by pRRophetic. Results: All of the CRGs were differentially expressed in HCC and 5 out of them (CDKN2A, DLAT, GLS, LIPT1, MTF1) correlated with patient survival. These signature genes were selected by LASSO analysis to establish a prognosis model to stratify HCC patients into high and low CRGs-score subgroups. High CRGs-score was associated with a worse prognosis. Subsequently, univariate and multivariate Cox regression verified that CRGs-score was an independent cancer risk factor that correlated with clinical factors including stage and grade. Nomogram integrating the CRGs-score and clinical risk factors performed well to predict patient survival. Immune infiltration analysis further revealed that the expression of immune checkpoint genes was significantly enhanced in high CRGs-score group, especially PD-1 and PD-L1. An independent validation cohort (ICGC) confirmed that CRGs-score as a stable and universally applicable indicator in predicting HCC patient survival. Concordantly, the expression of five confirmed signature genes were also differentially expressed in human HCC cell lines and mouse HCC model. In addition, we also analyzed the sensitivity of 10 clinical targeted therapies between high and low CRGs-score groups. Conclusion: This study elucidated the role of dysregulated CRGs in HCC cohort, with validation with in-vitro and in-vivo models. The CRGs-score might be applied as a novel prognostic factor in HCC.
Keywords: cuproptosis; drug sensitivity; hepatocellular carcinoma; prognostic model; tumor immunity.
Copyright © 2023 Li and Zeng.
Conflict of interest statement
The authors declare that the research was conducted in the absence of any commercial or financial relationships that could be construed as a potential conflict of interest.
Figures


Similar articles
-
Cuproptosis-Related Signature Predicts the Prognosis, Tumor Microenvironment, and Drug Sensitivity of Hepatocellular Carcinoma.J Immunol Res. 2022 Nov 16;2022:3393027. doi: 10.1155/2022/3393027. eCollection 2022. J Immunol Res. 2022. PMID: 36438201 Free PMC article.
-
Prognostic and Immunological Significance of the Molecular Subtypes and Risk Signatures Based on Cuproptosis in Hepatocellular Carcinoma.Mediators Inflamm. 2023 Apr 20;2023:3951940. doi: 10.1155/2023/3951940. eCollection 2023. Mediators Inflamm. 2023. PMID: 37124062 Free PMC article.
-
Establishment and Validation of the Novel Necroptosis-related Genes for Predicting Stemness and Immunity of Hepatocellular Carcinoma via Machine-learning Algorithm.Comb Chem High Throughput Screen. 2025;28(1):146-165. doi: 10.2174/0113862073271292231108113547. Comb Chem High Throughput Screen. 2025. PMID: 39641162
-
Identification of a novel cuproptosis-related gene signature and integrative analyses in patients with lower-grade gliomas.Front Immunol. 2022 Aug 15;13:933973. doi: 10.3389/fimmu.2022.933973. eCollection 2022. Front Immunol. 2022. PMID: 36045691 Free PMC article. Review.
-
Machine learning algorithm to construct cuproptosis- and immune-related prognosis prediction model for colon cancer.World J Gastrointest Oncol. 2023 Mar 15;15(3):372-388. doi: 10.4251/wjgo.v15.i3.372. World J Gastrointest Oncol. 2023. PMID: 37009317 Free PMC article. Review.
Cited by
-
Signature identification based on immunogenic cell death-related lncRNAs to predict the prognosis and immune activity of patients with endometrial carcinoma.Transl Cancer Res. 2024 Jun 30;13(6):2913-2937. doi: 10.21037/tcr-23-2243. Epub 2024 Jun 27. Transl Cancer Res. 2024. PMID: 38988945 Free PMC article.
-
Cuproptosis-a potential target for the treatment of osteoporosis.Front Endocrinol (Lausanne). 2023 May 5;14:1135181. doi: 10.3389/fendo.2023.1135181. eCollection 2023. Front Endocrinol (Lausanne). 2023. PMID: 37214253 Free PMC article. Review.
-
Cuproplasia and cuproptosis in hepatocellular carcinoma: mechanisms, relationship and potential role in tumor microenvironment and treatment.Cancer Cell Int. 2025 Apr 9;25(1):137. doi: 10.1186/s12935-025-03683-4. Cancer Cell Int. 2025. PMID: 40205387 Free PMC article. Review.
-
A Novel Gene Pair CSTF2/DPE2A Impacts Prognosis and Cell Cycle of Hepatocellular Carcinoma.J Hepatocell Carcinoma. 2023 Sep 28;10:1639-1657. doi: 10.2147/JHC.S413935. eCollection 2023. J Hepatocell Carcinoma. 2023. PMID: 37791068 Free PMC article.
-
Development of a MVI associated HCC prognostic model through single cell transcriptomic analysis and 101 machine learning algorithms.Sci Rep. 2025 Mar 7;15(1):7977. doi: 10.1038/s41598-025-91475-1. Sci Rep. 2025. PMID: 40055377 Free PMC article.
References
LinkOut - more resources
Full Text Sources
Research Materials
Miscellaneous