

Detection of hospital environmental contamination during SARS-CoV-2 Omicron predominance using a highly sensitive air sampling device
- PMID: 36703815
- PMCID: PMC9873263
- DOI: 10.3389/fpubh.2022.1067575
Detection of hospital environmental contamination during SARS-CoV-2 Omicron predominance using a highly sensitive air sampling device
Abstract
Background and objectives: The high transmissibility of SARS-CoV-2 has exposed weaknesses in our infection control and detection measures, particularly in healthcare settings. Aerial sampling has evolved from passive impact filters to active sampling using negative pressure to expose culture substrate for virus detection. We evaluated the effectiveness of an active air sampling device as a potential surveillance system in detecting hospital pathogens, for augmenting containment measures to prevent nosocomial transmission, using SARS-CoV-2 as a surrogate.
Methods: We conducted air sampling in a hospital environment using the AerosolSenseTM air sampling device and compared it with surface swabs for their capacity to detect SARS-CoV-2.
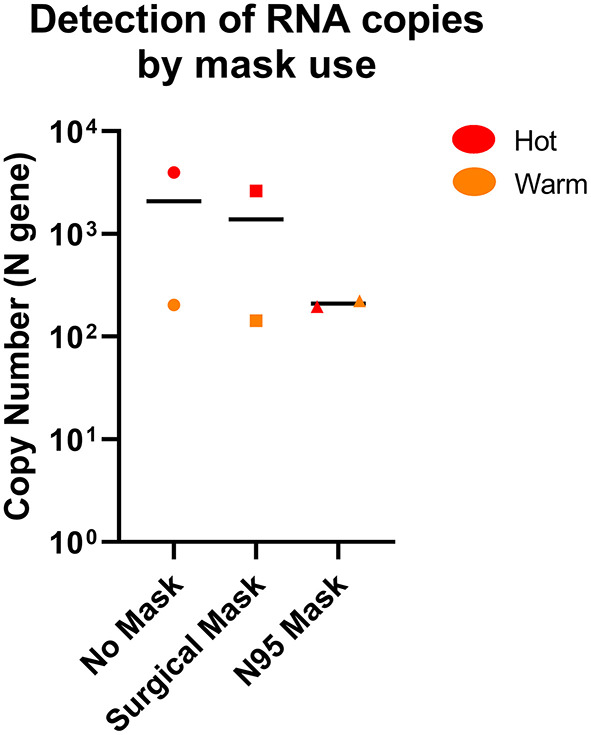
Results: When combined with RT-qPCR detection, we found the device provided consistent SARS-CoV-2 detection, compared to surface sampling, in as little as 2 h of sampling time. The device also showed that it can identify minute quantities of SARS-CoV-2 in designated "clean areas" and through a N95 mask, indicating good surveillance capacity and sensitivity of the device in hospital settings.
Conclusion: Active air sampling was shown to be a sensitive surveillance system in healthcare settings. Findings from this study can also be applied in an organism agnostic manner for surveillance in the hospital, improving our ability to contain and prevent nosocomial outbreaks.
Keywords: Omicron; SARS-CoV-2; air-sampling; mass screening; surveillance.
Copyright © 2023 Tan, Ang, Tay, Somani, Ng, Peng, Chu, Tambyah and Allen.
Conflict of interest statement
PT reports receiving grants from Roche, Arcturus, Johnson and Johnson, Sanofi Pasteur, and personal fees from AJ Biologicals, outside the submitted work. The remaining authors declare that the research was conducted in the absence of any commercial or financial relationships that could be construed as a potential conflict of interest.
Figures
Similar articles
-
Airborne SARS-CoV-2 surveillance in hospital environment using high-flowrate air samplers and its comparison to surface sampling.Indoor Air. 2022 Jan;32(1):e12930. doi: 10.1111/ina.12930. Epub 2021 Sep 14. Indoor Air. 2022. PMID: 34519380 Free PMC article.
-
Risk of air and surface contamination of SARS-CoV-2 in isolation wards and its relationship with patient and environmental characteristics.Ecotoxicol Environ Saf. 2022 Aug;241:113740. doi: 10.1016/j.ecoenv.2022.113740. Epub 2022 Jun 6. Ecotoxicol Environ Saf. 2022. PMID: 35687998 Free PMC article.
-
Effectiveness and cost-effectiveness of four different strategies for SARS-CoV-2 surveillance in the general population (CoV-Surv Study): a structured summary of a study protocol for a cluster-randomised, two-factorial controlled trial.Trials. 2021 Jan 8;22(1):39. doi: 10.1186/s13063-020-04982-z. Trials. 2021. PMID: 33419461 Free PMC article.
-
Fending off Delta - Hospital measures to reduce nosocomial transmission of COVID-19.Int J Infect Dis. 2022 Apr;117:139-145. doi: 10.1016/j.ijid.2022.01.069. Epub 2022 Feb 4. Int J Infect Dis. 2022. PMID: 35124240 Free PMC article. Review.
-
SARS-CoV-2 indoor contamination: considerations on anti-COVID-19 management of ventilation systems, and finishing materials in healthcare facilities.Ann Ig. 2021 Jul-Aug;33(4):381-392. doi: 10.7416/ai.2020.2396. Epub 2020 Dec 4. Ann Ig. 2021. PMID: 33270076 Review.
Cited by
-
Transmission dynamics of MERS-CoV in a transgenic human DPP4 mouse model.Npj Viruses. 2024 Aug 21;2(1):36. doi: 10.1038/s44298-024-00048-y. Npj Viruses. 2024. PMID: 40295821 Free PMC article.
-
Development of COPMAN-Air method for high-sensitivity detection of SARS-CoV-2 in air.Sci Rep. 2025 Apr 24;15(1):14340. doi: 10.1038/s41598-025-99365-2. Sci Rep. 2025. PMID: 40275056 Free PMC article.
References
-
- Coleman KK, Tay DJW, Tan KS, Ong SWX, Than TS, Koh MH, et al. . Viral load of severe acute respiratory syndrome coronavirus 2 (SARS-CoV-2) in respiratory aerosols emitted by patients with coronavirus disease 2019 (COVID-19) while breathing, talking, and singing. Clin Infect Dis. (2022) 74:1722–8. 10.1093/cid/ciab691 - DOI - PMC - PubMed
Publication types
MeSH terms
LinkOut - more resources
Full Text Sources
Medical
Miscellaneous